Guidelines of the minimum sample size
requirements for Cohen’s Kappa
ABSTRACT
Background: To estimate sample size for Cohen’s kappa agreement test can be challenging especially when dealing with various effect sizes. This study aimed to present minimum sample size determination for Cohen’s kappa under different scenarios when certain assumptions are held.
Methods: The sample size formula was introduced by Flack and colleagues (1988). The power was pre-specified to be at least 80% and 90% while alpha was set at less than 0.05. The effect sizes were derived from several pre-specified estimates such as the pattern of the true marginal rating frequencies and the difference between the two kappa coefficients in the hypothesis testing.
Results:When the true marginal rating frequencies are the same, the minimum sample size determination ranges from 2 to 927 depending on the actual value of the effect size. When the true marginal rating frequencies are not the same, then the majority of the minimum sample size required for this condition is more than double than that required sample size when the true marginal rating frequencies are the same.
Conclusion:Concerning that the sample size formula could produce a very extreme small sample size, the determination of K1 and K2 should be based on reasonable estimates. We recommend for all sample size determinations for Cohen’s kappa agreement test, the true marginal rating frequencies can be assumed to be the same. Otherwise, it will be necessary to multiply the estimated minimum sample size by two to accommodate if the true marginal rating frequencies are not the same.
Key words: agreement; guidelines; kappa; sample size
Mohamad Adam Bujang (1,2), Nurakmal Baharum (3)
(1) Clinical Research Centre, Sarawak General Hospital, Ministry of Health, Malaysia
(2) Faculty Computer and Mathematical Sciences, Universiti Teknologi Mara, Shah Alam, Selangor, Malaysia (3) Biostatistics Unit, National Clinical Research Centre, Ministry of Health, Malaysia
CORRESPONDING AUTHOR:Mohamad Adam Bujang, Clinical Research Centre, Sarawak General Hospital, Jalan Tun Ahmad Zaidi Adruce 93586, Kuching, Sarawak, Malaysia - E-mail address: [email protected] - Office: +60 082 276820 Fax: +60 082 276823
DOI: 10.2427/12267
Accepted on May 4, 2017
INTRODUCTION
Determination of a minimum required sample size is one of the major requirements when planning for an
only those researchers with a basic understanding of a particular statistical test can appreciate the usefulness of these softwares.
Sample size is a function of alpha (type I error), power (1 – type II error) and effect size. To simplify all calculations, alpha and power are usually set at 0.05 and 80.0% respectively. Cohen’s kappa coefficient is a test statistic which determines the degree of agreement between two different evaluations from a response variable. The response variable must be in categorical form. The evaluations of the response variable are observed either by two different raters or by the same rater at two different times [1].
The scenario of an evaluation by same rater at two different times usually applies in test-retest reliability studies [2-5]. By assumption, kappa requires statistical independence of raters. The scenario can be considered as independent because the response from the same rater in time 2 should be free from the effect of his/her response in time 1. Therefore, researcher will have to give some amounts of lag time for about 1 to 3 weeks before responses at time 2 can be observed. The idea is to measure to what extent responses at time 2 are agreeable with responses at time 1. The range of kappa’s coefficient lies between -1 and 1 where kappa equal to -1 indicates perfect disagreement and kappa equal to 1 indicates perfect agreement.
Inter-rater agreement is usually a measure of the agreement by different raters; who may be using the same scale, instrument, classification or procedure to assess the same objects (or subjects). Intra-rater agreement, on the other hand, is also referred to as ‘test–retest agreement’ in which a measure of the agreement by the same rater, who may be using the same scale, instrument, classification or procedure to assess the same objects (or subjects), albeit at two different times. The technical application of Cohen’s kappa test in reliability studies have been discussed in depth by previous studies [6-9].
An important requirement prior to conducting statistical analysis for Cohen’s kappa agreement test is to determine the minimum sample size required for attaining a particular power for this test. Previous study has proposed to derive a minimum sample size required based on simulation [10], while other proposes to derive it based on manual calculation which was also presented as a summary table for determining the minimum sample size required [11-12]. Cantor (1998) provides a very useful formula to estimate sample size and it requires the researcher to estimate asymptomatic variance for kappa [11]. Meanwhile, Sim and Wright (2005), provides a summary table showing estimated sample size based on a goodness-of-fit formula by Donner and Eliasziw (1992) but with limited options of the effect size. Although all these guidelines are now available, however they can still be improved further especially on how to determine the minimum sample size required for conducting for a range of varying effect sizes.
The determination of a minimum sample size required for conducting the Cohen’s kappa agreement test can be difficult for a non-statistician because it involves various considerations. Since the minimum sample size required for kappa agreement test can vary widely depending on the choice of the effect size, it is necessary to derive an almost complete tabulation of all the minimum sample sizes required for conducting the Cohen’s kappa agreement test for a wide range of varying effect sizes. This study aimed to determine a minimum sample size required for conducting the Cohen’s kappa agreement test in accordance to a wide range of varying effect sizes and develop a guide for estimation of sample size using the tabulated results of this study.
METHODS
Sample size calculations were performed using PASS software (Hintze, J. (2011). PASS 11. NCSS, LLC. Kaysville, Utah, USA) and the formula of the sample size calculation for conducting Cohen’s kappa agreement test was introduced by Flack et. al. (1988) [9]. Based on this formula, all the calculations are based on rating of k categories from two raters or the rating from the same rater such as in test-retest reliability study. In practice, the category frequencies may not be equivalent, but the standard error maximization method of Flack, Afifi, Lachenbruch, and Schouten (1988) assumes that the category frequencies are equal for both raters. Therefore, only one set of frequencies is needed (Figure 1). Full derivation of the formula for determining this minimum sample size required and the assumptions and notations for this hypothesis testing are presented in a statistical manual which was published elsewhere [13].
The determination of a minimum sample size requirement is based on the pre-specified values of power, type I error (alpha) and effect size. The main parameters that can affect the effect size are (i) the total number of categories in the contingency table (here, the total number of categories represents the total number of possible ratings for a nominal item or an ordinal item), (ii) the frequencies or proportion in each category which indicates the response of an agreement (iii) the values of the kappa coefficients (K1 and K2) for hypothesis testing and (iv) the difference
between the two Cohen’s kappa coefficient (K1 and K2)
for hypothesis testing.
To simplify the process of mathematical computations, the power is pre-specified to be at 80% and 90%. The alpha is set to be 0.05 and a two-sided t-test was conducted where the values for K1 can be either greater
than or less than K2. The various categories of contingency
times). As such the cross-tabulation table will always be symmetrical. Meanwhile, the total number of category represents the total number of category of the response variable in a categorical form.
First of all, the minimum required sample sizes were calculated based on the assumption that all the possible different ratings by both raters are assumed to be proportional to one another in the contingency table. In other words, we assumed that the true marginal rating frequencies are the same. For example, say we have a binary response item with two categories (“yes” or “no”), so all the ratings will be tabulated in a 2 by 2 contingency table, from which the degree of inter-rater agreement can be measured. The proportion is assumed to be proportional to one another when it refers to an equal rating by the two raters in responding the scale such as 0.5 for response “yes” and also 0.5 for response “no” by both raters. On the other hand, the response can
also be 0.6 for response “yes” and also 0.4 for response “no” by both raters. In other words, the response for the categories can be different but the formula by Flack et. al. (1988) assumed that the responses by both raters are the same. The values of kappa coefficient which are fixed for K1 shall range from 0.0, 0.3, 0.5 and 0.7; while those
fixed for K2 shall range from 0.2, 0.3, 0.4, 0.5, 0.6,
0.7, 0.8 and 0.9. K2 refers to an expected or formulated
kappa coefficient which is hypothesized to be far from K1. K1 and K2 can represent response by first rater and
second rater respectively or a response from a test-retest reliability studies.
Additional analyses were performed to determine the extent to which these minimum sample size requirements will change when true marginal rating frequencies are not the same for each category. These different frequencies or proportions of ratings by both raters shall represent all the possible levels of inter-rater agreement, which shall be FIGURE 1. Illustration on the changes of the minimum number of sample size for kappa agreement test due to the changes in the proportion for each category
RATER 2 Strongly
agree Agree Disagree Strongly disagree Total
RATER 1
Strongly agree P11 P12 P13 P14 0.25
Agree P21 P22 P23 P24 0.25
Disagree P31 P32 P33 P34 0.25
Strongly disagree P41 P42 P43 P44 0.25
Total 0.25 0.25 0.25 0.25 1.00
Power at 0.8; minimum sample size required; n=18 Power at 0.9; minimum sample size required; n=25
RATER 2 Strongly
agree Agree Disagree Strongly disagree Total
RATER 1
Strongly agree P11 P12 P13 P14 0.10
Agree P21 P22 P23 P24 0.20
Disagree P31 P32 P33 P34 0.30
Strongly disagree P41 P42 P43 P44 0.40
Total 0.10 0.20 0.30 0.40 1.00
Power at 0.8; minimum sample size required; n=36 Power at 0.9; minimum sample size required; n=48 Rater 2 Strongly
agree Agree Disagree Strongly disagree Total
RATER 1
Strongly agree P11 P12 P13 P14 0.10
Agree P21 P22 P23 P24 0.20
Disagree P31 P32 P33 P34 0.30
Strongly disagree P41 P42 P43 P44 0.40
Total 0.10 0.10 0.10 0.70 1.00
Power at 0.8; minimum sample size required; n=35 Power at 0.9; minimum sample size required; n=48 The calculation are conducted when alpha is set at 0.05 and by two-sided test;
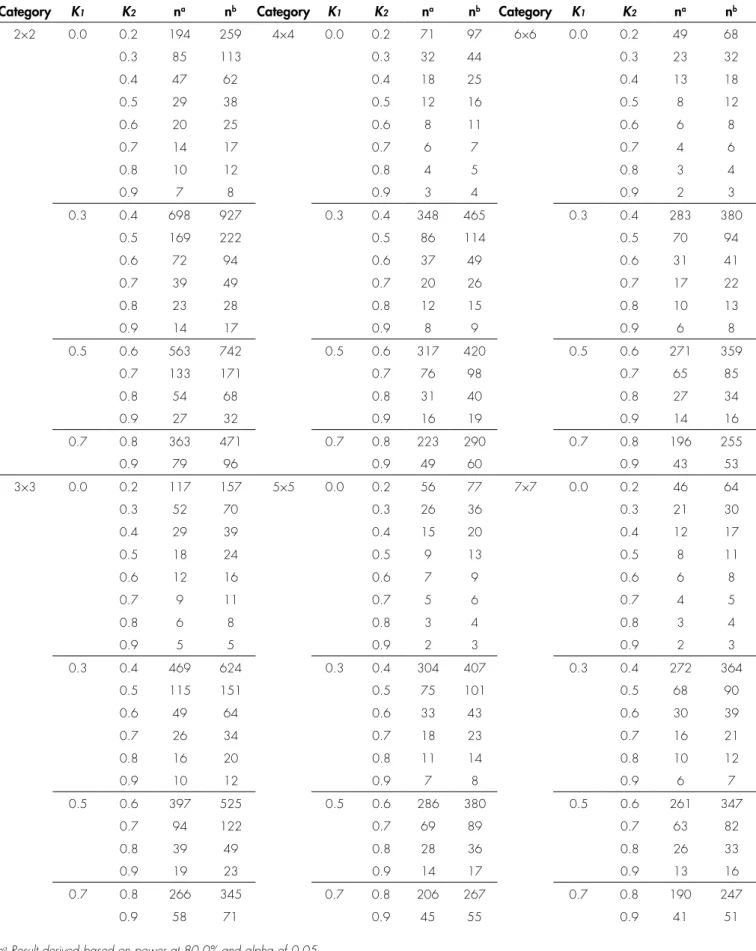
TABLE 1. Sample size calculation for kappa at category 2 until 7 when proportion each category is assumed at proportionate
Category K1 K2 na nb Category K1 K2 na nb Category K1 K2 na nb
2×2 0.0 0.2 194 259 4×4 0.0 0.2 71 97 6×6 0.0 0.2 49 68
0.3 85 113 0.3 32 44 0.3 23 32
0.4 47 62 0.4 18 25 0.4 13 18
0.5 29 38 0.5 12 16 0.5 8 12
0.6 20 25 0.6 8 11 0.6 6 8
0.7 14 17 0.7 6 7 0.7 4 6
0.8 10 12 0.8 4 5 0.8 3 4
0.9 7 8 0.9 3 4 0.9 2 3
0.3 0.4 698 927 0.3 0.4 348 465 0.3 0.4 283 380
0.5 169 222 0.5 86 114 0.5 70 94
0.6 72 94 0.6 37 49 0.6 31 41
0.7 39 49 0.7 20 26 0.7 17 22
0.8 23 28 0.8 12 15 0.8 10 13
0.9 14 17 0.9 8 9 0.9 6 8
0.5 0.6 563 742 0.5 0.6 317 420 0.5 0.6 271 359
0.7 133 171 0.7 76 98 0.7 65 85
0.8 54 68 0.8 31 40 0.8 27 34
0.9 27 32 0.9 16 19 0.9 14 16
0.7 0.8 363 471 0.7 0.8 223 290 0.7 0.8 196 255
0.9 79 96 0.9 49 60 0.9 43 53
3×3 0.0 0.2 117 157 5×5 0.0 0.2 56 77 7×7 0.0 0.2 46 64
0.3 52 70 0.3 26 36 0.3 21 30
0.4 29 39 0.4 15 20 0.4 12 17
0.5 18 24 0.5 9 13 0.5 8 11
0.6 12 16 0.6 7 9 0.6 6 8
0.7 9 11 0.7 5 6 0.7 4 5
0.8 6 8 0.8 3 4 0.8 3 4
0.9 5 5 0.9 2 3 0.9 2 3
0.3 0.4 469 624 0.3 0.4 304 407 0.3 0.4 272 364
0.5 115 151 0.5 75 101 0.5 68 90
0.6 49 64 0.6 33 43 0.6 30 39
0.7 26 34 0.7 18 23 0.7 16 21
0.8 16 20 0.8 11 14 0.8 10 12
0.9 10 12 0.9 7 8 0.9 6 7
0.5 0.6 397 525 0.5 0.6 286 380 0.5 0.6 261 347
0.7 94 122 0.7 69 89 0.7 63 82
0.8 39 49 0.8 28 36 0.8 26 33
0.9 19 23 0.9 14 17 0.9 13 16
0.7 0.8 266 345 0.7 0.8 206 267 0.7 0.8 190 247
0.9 58 71 0.9 45 55 0.9 41 51
subject to Cohen’s kappa agreement test. This is because the effect size can take on a wide range of values since the proportion of rating in each category (that indicates a particular level of an agreement) can range from very low to very high. An example of how varying the proportions of rating in each category can affect the minimum required sample size determination is illustrated in Figure 1.
RESULTS
When the true marginal rating frequencies are the same, the minimum required sample size for conducting the Cohen’s kappa agreement test shall range from 2 to 927 depending on the actual effect size since the power (80.0% or 90.0%) and alpha less than 0.05) have already been fixed. In addition, a category with the higher scale (which consists of a larger number of possible categories) will yield a smaller minimum sample size requirement. For instance, using the same effect size (K1=0.0 vs K2=0.2),
the 2-category will yield a minimum sample size of 194 while a 10-category will yield a minimum sample size of only 29. Apart from that, a smaller difference between the two Cohen’s kappa coefficient values (K1 and K2) will
require a larger minimum sample size. For example, for the contingency tables in the same category (‘2-by-2’ table), a
difference of 0.2 (K1=0.0 vs K2=0.2) will yield a minimum
sample size of 194; while a difference of 0.3 (K1=0.0 vs
K2=0.3), 0.4 (K1=0.0 vs K2=0.4) and 0.5 (K1=0.0 vs
K2=0.5) will yield a minimum sample size of 85, 47 and
29 respectively (Table 1 and Table 2).
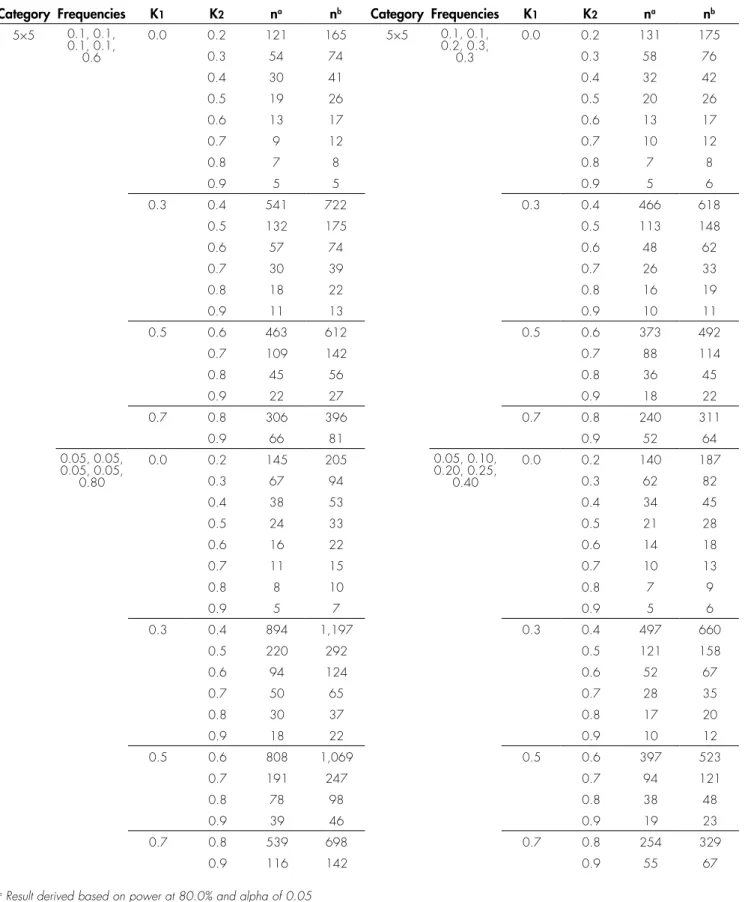
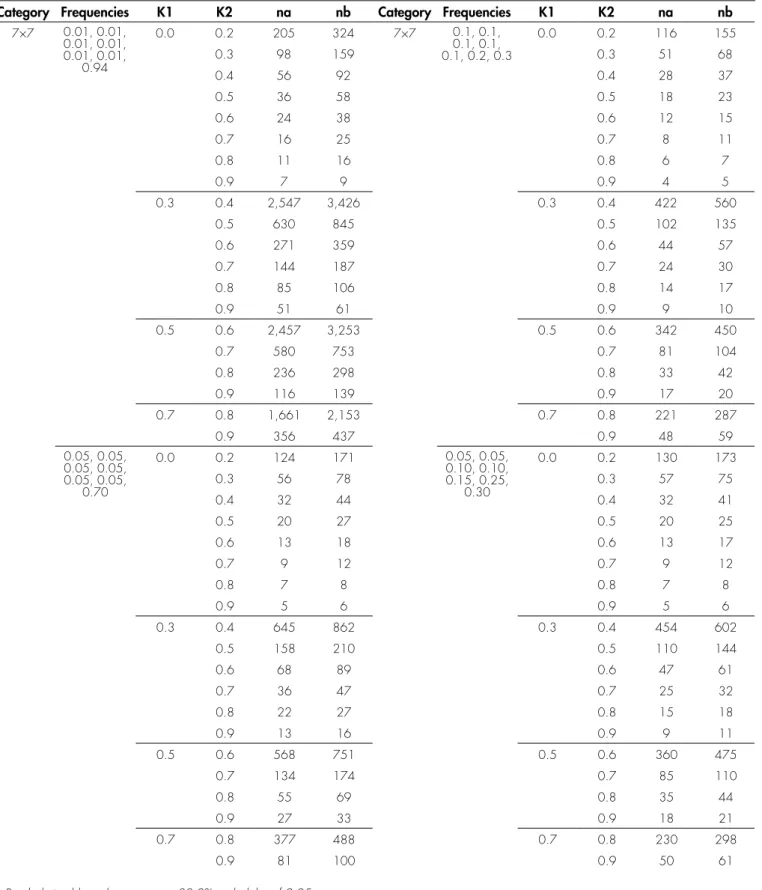
Additional analyses which have incorporated a range of varying frequencies or proportions (of ratings in agreement by both raters) in each category have proposed that the minimum required sample size for conducting Cohen’s kappa agreement test is roughly between two to ten times more than sample size required when the true marginal rating frequencies or proportions are the same (refer to Table 3 and Table 4). For instance, a minimum sample size of 272 is required for category 7 with K1=0.3
versus K2=0.4 when the true marginal rating frequencies
are the same (Table 1). However, sample size of 2547 is required for the same total number of categories and same values for the two Cohen’s kappa coefficient values (K1 and K2) when the true marginal rating frequencies are
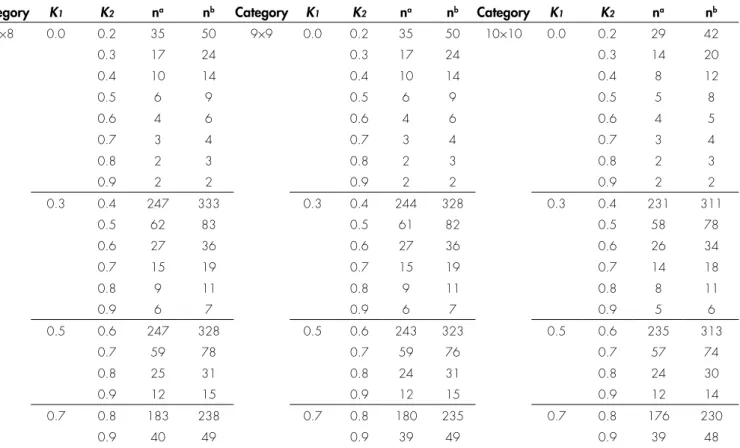
not the same. This represents 9.4 times (2547/272) more than the desired sample size when compare with sample size requirement if the true marginal rating frequencies or proportions are the same. In this case, the proportion (of ratings in agreement by both raters) in each category is pre-specified at a very extreme pattern such as 0.01, 0.01, 0.01, 0.01, 0.01, 0.01 and 0.94 (Table 4). TABLE 2. Sample size calculation for kappa at category 8 to 10 when proportion in each category is assumed at proportionate
Category K1 K2 na nb Category K1 K2 na nb Category K1 K2 na nb
8×8 0.0 0.2 35 50 9×9 0.0 0.2 35 50 10×10 0.0 0.2 29 42
0.3 17 24 0.3 17 24 0.3 14 20
0.4 10 14 0.4 10 14 0.4 8 12
0.5 6 9 0.5 6 9 0.5 5 8
0.6 4 6 0.6 4 6 0.6 4 5
0.7 3 4 0.7 3 4 0.7 3 4
0.8 2 3 0.8 2 3 0.8 2 3
0.9 2 2 0.9 2 2 0.9 2 2
0.3 0.4 247 333 0.3 0.4 244 328 0.3 0.4 231 311
0.5 62 83 0.5 61 82 0.5 58 78
0.6 27 36 0.6 27 36 0.6 26 34
0.7 15 19 0.7 15 19 0.7 14 18
0.8 9 11 0.8 9 11 0.8 8 11
0.9 6 7 0.9 6 7 0.9 5 6
0.5 0.6 247 328 0.5 0.6 243 323 0.5 0.6 235 313
0.7 59 78 0.7 59 76 0.7 57 74
0.8 25 31 0.8 24 31 0.8 24 30
0.9 12 15 0.9 12 15 0.9 12 14
0.7 0.8 183 238 0.7 0.8 180 235 0.7 0.8 176 230
0.9 40 49 0.9 39 49 0.9 39 48
TABLE 3. Sample size calculation for kappa at category 5 when proportion each category is not assumed at proportionate
Category Frequencies K1 K2 na nb Category Frequencies K1 K2 na nb 5×5 0.1, 0.1,
0.1, 0.1, 0.6
0.0 0.2 121 165 5×5 0.1, 0.1,
0.2, 0.3, 0.3
0.0 0.2 131 175
0.3 54 74 0.3 58 76
0.4 30 41 0.4 32 42
0.5 19 26 0.5 20 26
0.6 13 17 0.6 13 17
0.7 9 12 0.7 10 12
0.8 7 8 0.8 7 8
0.9 5 5 0.9 5 6
0.3 0.4 541 722 0.3 0.4 466 618
0.5 132 175 0.5 113 148
0.6 57 74 0.6 48 62
0.7 30 39 0.7 26 33
0.8 18 22 0.8 16 19
0.9 11 13 0.9 10 11
0.5 0.6 463 612 0.5 0.6 373 492
0.7 109 142 0.7 88 114
0.8 45 56 0.8 36 45
0.9 22 27 0.9 18 22
0.7 0.8 306 396 0.7 0.8 240 311
0.9 66 81 0.9 52 64
0.05, 0.05, 0.05, 0.05,
0.80
0.0 0.2 145 205 0.05, 0.10,
0.20, 0.25, 0.40
0.0 0.2 140 187
0.3 67 94 0.3 62 82
0.4 38 53 0.4 34 45
0.5 24 33 0.5 21 28
0.6 16 22 0.6 14 18
0.7 11 15 0.7 10 13
0.8 8 10 0.8 7 9
0.9 5 7 0.9 5 6
0.3 0.4 894 1,197 0.3 0.4 497 660
0.5 220 292 0.5 121 158
0.6 94 124 0.6 52 67
0.7 50 65 0.7 28 35
0.8 30 37 0.8 17 20
0.9 18 22 0.9 10 12
0.5 0.6 808 1,069 0.5 0.6 397 523
0.7 191 247 0.7 94 121
0.8 78 98 0.8 38 48
0.9 39 46 0.9 19 23
0.7 0.8 539 698 0.7 0.8 254 329
0.9 116 142 0.9 55 67
TABLE 4. Sample size calculation for kappa at category 7 when proportion each category is not assumed at proportionate
Category Frequencies K1 K2 na nb Category Frequencies K1 K2 na nb
7×7 0.01, 0.01, 0.01, 0.01, 0.01, 0.01,
0.94
0.0 0.2 205 324 7×7 0.1, 0.1,
0.1, 0.1, 0.1, 0.2, 0.3
0.0 0.2 116 155
0.3 98 159 0.3 51 68
0.4 56 92 0.4 28 37
0.5 36 58 0.5 18 23
0.6 24 38 0.6 12 15
0.7 16 25 0.7 8 11
0.8 11 16 0.8 6 7
0.9 7 9 0.9 4 5
0.3 0.4 2,547 3,426 0.3 0.4 422 560
0.5 630 845 0.5 102 135
0.6 271 359 0.6 44 57
0.7 144 187 0.7 24 30
0.8 85 106 0.8 14 17
0.9 51 61 0.9 9 10
0.5 0.6 2,457 3,253 0.5 0.6 342 450
0.7 580 753 0.7 81 104
0.8 236 298 0.8 33 42
0.9 116 139 0.9 17 20
0.7 0.8 1,661 2,153 0.7 0.8 221 287
0.9 356 437 0.9 48 59
0.05, 0.05, 0.05, 0.05, 0.05, 0.05,
0.70
0.0 0.2 124 171 0.05, 0.05,
0.10, 0.10, 0.15, 0.25,
0.30
0.0 0.2 130 173
0.3 56 78 0.3 57 75
0.4 32 44 0.4 32 41
0.5 20 27 0.5 20 25
0.6 13 18 0.6 13 17
0.7 9 12 0.7 9 12
0.8 7 8 0.8 7 8
0.9 5 6 0.9 5 6
0.3 0.4 645 862 0.3 0.4 454 602
0.5 158 210 0.5 110 144
0.6 68 89 0.6 47 61
0.7 36 47 0.7 25 32
0.8 22 27 0.8 15 18
0.9 13 16 0.9 9 11
0.5 0.6 568 751 0.5 0.6 360 475
0.7 134 174 0.7 85 110
0.8 55 69 0.8 35 44
0.9 27 33 0.9 18 21
0.7 0.8 377 488 0.7 0.8 230 298
0.9 81 100 0.9 50 61
Taking another example for illustration purposes, it is found that a minimum required sample size of 422 (i.e. 422/272 = 1.6 times more than the minimum required sample size when compare with sample size requirement if the true marginal rating frequencies or proportions are the same) is required also for the same total number of categories and same values for the two Cohen’s kappa coefficient values when the proportions in each category are pre-specified as 0.1, 0.1, 0.1, 0.1, 0.1, 0.2 and 0.3. Based on all comparisons between Table 1, Table 3 and Table 4 (only for K=5 and K=7), majority of the ratios (“sample size required when the true marginal rating frequencies is not the same” divided by “sample size required when the true marginal rating frequencies is the same”) are less than 2. All these findings have been tabulated to produce a guide from which the minimum required sample sizes for conducting Cohen’s kappa agreement test can be easily determined based on the pre-specified assumptions and notations.
DISCUSSION
The sample size calculations presented in the tables are meant to assist researchers in determining the minimum sample sizes required for conducting Cohen’s kappa agreement test. The agreement can be tested for nominal and ordinal variable. Although weighted kappa that was introduced by Fleiss is more suitable for ordinal scale, but it is still allowable to measure an agreement for ordinal scale using Cohen’s kappa [14]. The following guide provides detailed instructions on how to use these tables for determining the minimum sample sizes required for Cohen’s kappa agreement test. Ideally in most research studies, the values of power and alpha are pre-specified at 80.0% and 0.05 respectively. Hence, researchers will have to make a prior decision on the difference between the two Cohen’s kappa coefficient values (K1 and K2)
and the estimated proportions or frequencies (of ratings in agreement by both raters) in each category which shall illustrate the level of an agreement.
Researchers usually denote the value of Cohen’s kappa coefficient to be equal to zero for K1 when
researchers intend to test the level of agreement (for both inter-rater and intra-rater) is significantly far from zero. In other words, researchers can reasonably assume that there is no agreement between both ratings (whether inter-rater or inter-rater) in the first place. This assumption is usually preferred by researchers since it will necessitate a smaller sample size. A similar pattern was also observed in most other statistical analyses where smaller sample size is required when to test a significantly far from zero [15].
On the other hand, it may however sometimes be necessary to pre-specify that the value of Cohen’s kappa coefficient to be more than zero for K1, in order to be able
to detect a higher degree of agreement between inter-rater
and/or intra-rater observations. For instance, researchers may pre-specify the value of Cohen’s kappa coefficient to be 0.3 for K1. In this scenario, researcher aims to detect
a significantly (p-value<0.05) higher level of agreement (i.e. Cohen’s kappa coefficient of more than 0.3) from the minimum value of Cohen’s kappa coefficient of 0.3. A value of Cohen’s kappa coefficient such as 0.4 (say for K2) shall indicate a higher than ordinary degree of
agreement [16].
Another well-known factor under consideration which can influence the minimum sample size requirement is the difference between the values of the two Cohen’s kappa coefficient (K1 and K2). It has already been understood
that a larger sample size will be required for detecting a smaller difference between them (in other words, a smaller effect size) [17-18]. Some of the sample size calculations have shown that a minimum sample size as small as two is required, which is due to the large difference between the values of the two Cohen’s kappa coefficient in both K1 and K2.
For example, in the ‘5-by-5’ contingency table which consists of the proportion in each category to be directly proportional to one another, it is found that the minimum sample size required can be as small as two (i.e. power and alpha are pre-specified as 80.0% and 0.05 respectively) when the study aimed to detect a very large difference between the two values of Cohen’s kappa coefficient (for example, K1=0.0 vs K2=0.9) (Table 1).
Even though the sample size calculation is valid; however, a very small sample size such as two is not justifiable because it will not be able to serve its purpose. If, for any reasons, the researchers would like to detect a higher degree of agreement; then we recommend pre-specifying the value of Cohen’s kappa coefficient to be either 0.3 or 0.5 for K1 instead of zero.
Based on the same scenario described above, a minimum sample size of 7 or 14 will be required (for both K1=0.3 vs K2=0.9 or K1=0.5 vs K2=0.9, respectively).
Besides that, to pre-specify a value of Cohen’s kappa coefficient to be as high as 0.9 for K2 can also incur a
risk. This risk can arise because after having completed the research study, the results obtained from the study may not be able to achieve a degree of interrater agreement as high as that pre-determined by the researchers. Therefore, researchers may consider aiming to detect a lower value of Cohen’s kappa coefficient such as 0.8 for K2 in which
will require a minimum sample size of 11 and 28 for both K1=0.3 vs K2=0.8 and K1=0.5 vs K2=0.8, respectively.
We recommend that the minimum sample size required for conducting a Cohen’s kappa agreement test is between 11 and 28.
(of ratings in agreement by both raters) in each category to be directly proportional to one another. Therefore, we have further explored many other possible sample size requirements by having different proportions (of ratings in agreement by both raters) in each category and then examining the impact of this on minimum sample size requirements. This includes the situation in which the proportions (of ratings in agreement by both raters) in each category are not directly proportional to one another.
We have found that, based on a variation of proportions (of ratings in agreement by both raters) in each category that we tested, the sample size required can be as high as two to ten times more than that required if the proportions in each category are directly proportional to one another. However, even though such a proportion (of ratings in agreement by both raters) can rarely occur; there is still a possibility that it can actually happen. Since majority of the ratios (“sample size required when the true marginal rating frequencies is not the same” divided by “sample size required when the true marginal rating frequencies is the same”) are less than 2 and hence, in order to accommodate such unusual proportions (of ratings in agreement by both raters), we shall now recommend to multiply the minimum sample size required by two based on the assumption when the response of an agreement is proportional to one another. Nonetheless, the initial determination of minimum sample size (when the proportions in each category are assumed to be proportional to one another) will always serve as a useful guide because it shall provide a fundamental basis for the estimation of the minimum required sample size [19-20].
An example of a statement for determination of a recommended minimum sample size is as follows: “The study aims to determine test-retest reliability for a particular questionnaire containing 27 items with a Likert scale of four. The minimum value for the Cohen’s kappa coefficient to be expected by researchers is 0.4 for every item (K2=0.4) when there are assumed no agreement for the
test-retest at the first place (K1=0). When the power and
alpha are pre-specified at 80.0% and 0.05 respectively, a minimum sample of 18 respondents are required for the detection of a minimum value of kappa coefficient of 0.4 while holding an assumption that the proportion of ratings in agreement by both raters in each category is assumed to be directly proportional to one another (Table 1). However, it is also possible for the researchers to multiply the minimum sample size by two to accommodate other proportions in each category, which may not be proportional to one another. Hence, the required sample size is 36 (i.e. 18 x 2).
Summary of this paper is now presented as a table of minimum sample sizes required for detecting a difference between two values of Cohen’s kappa to assist the researchers (especially those who are not statisticians) in estimating a minimum sample size required for conducting
a Cohen’s kappa agreement test. However, there are still some initial assumptions pertaining to the proportions (of ratings in agreement by both raters) that need to be made. Therefore, we recommend for all initial determination of minimum sample size requirements in these studies, the proportions (of ratings on agreement by both raters) in each category are assumed to be directly almost proportional to one another. In the cases when researchers assume that the response of an agreement is not proportional to one another, then the minimum sample size required will have to be multiplied by two.
Besides, researchers need to be careful when deciding the coefficient of kappa in both K1 and K2. The
determination of K1 and K2 should not be set with intention
to produce smaller sample size such as less than ten. Instead, the determination of K1 and K2 should be based
on reasonable estimates in which can be guided by pilot study and literatures. The minimum required sample size is proposed from more than 10 to less than 30. Apart from that, we calculated the sample size calculation based on two-tailed test, this yields more sample compare with a one-tailed test.
In addition, the basis of calculation for minimum required sample size in this paper can also be suitably adapted for conducting a weighted kappa test. The minimum required sample size for conducting a weighted kappa test is always smaller than the estimated sample size required for conducting kappa agreement test. The weighted kappa test will take into consideration the difference in the response from within the same scale (e.g: an ordinal scale from a likert scale) and hence, it is more sensitive in detecting an agreement comparing with the common kappa statistic [21]. Nevertherless, critics have been made regarding Cohen’s kappa [22]. Future studies can be done to discuss sample size guideline for another alternative for an agreement test such as Krippendorff’s alpha [23].
Acknowledgement
All authors would like to thank to Director General, Ministry of Health for the grant of permission to publish this manuscript and also to Mr John Hon Yoon Khee and Dr Lee Keng Yee for their effort in proofreading this manuscript. We also would like to thank Ms Nur Khairul Bariyyah for helping to format the manuscript and subsequently submit the paper for publication.
REFERENCES
1. Cohen JA. Coefficient of agreement for nominal scales. Educational and Psychological Measurement 1960;20:37-46.
H: Reliability and validity of the revised Summary of Diabetes Self-Care Activities (SDSCA) for Malaysian children and adolescents. Malysian Family Physician 2012, 7: 10–20.
3. Yunus A, Seet W, Mohamad Adam B, Haniff J. Validation of the Malay version of Berlin questionnaire to identify Malaysian patients for obstructive sleep apnea. Malays Fam Physician. 2013;8:5–11. 4. Omar K, Bujang MA, Mohd Daud TI, Abdul Rahman FN, Loh SF, Haniff J, Kamarudin R, Ismail F, Tan S. Validation of the Malay Version of Adolescent Coping Scale. IMJ 2011; 18(4): 288-92. 5. Tan, S.M., S.F. Loh, M.A. Bujang, J. Haniff, A. Rahman, F. Nazri,
F. Ismail, K. Omar, M. Daud and T. Iryani, 2013. Validation of the Malay Version of Children’s Depression Inventory. International Medical Journal, 20(2).
6. Kottner J, Audigé L, Brorson S, et al. Guidelines for Reporting Reliability and Agreement Studies (GRRAS) were Proposed. J Clin Epidemiol. 2011;64(1):96-106.
7. Viera AJ, Garrett JM. Understanding Interobserver Agreement: The Kappa Statistic. Fam Med. 2005;37(5):360-3.
8. Landis JR, Koch GG. The Measurement of Observer Agreement for Categorical Data. Biometrics 1977;33:159-74.
9. Flack VF, Afifi AA, Lachenbruch PA, Schouten HJA. Sample size determinations for the two rater kappa statistic. Psychometrika 1988;53:321–5
10. Tractenberg RE, Yumoto F, Jin S, Morris JC. Sample size requirements for training to a kappa agreement criterion on Clinical Dementia Ratings. Alzheimer Dis Assoc Disord. 2010;24(3):264–8.
11. Cantor AB. Sample-Size Calculations for Cohen’s Kappa. Psychological Method 1996;l(2):150-3.
12. Sim J, Wright CC. The Kappa Statistic in Reliability Studies: Use, Interpretation, and Sample Size Requirements. Physical Therapy
2005;85(3):257-68.
13. PASS 11, Power Analysis & Sample Size User Guide 3. NCSS Hintze, J. Kaysville, Utah.
14. Fleiss, J. L. and Cohen, J. [1973]. The equivalence of weighted kappa and the intraclass correlation coefficient as measures of reliability. Educational and Psychological Measurement 33, 613-9 15. Bujang MA, Baharum N. Sample Size Guideline for Correlation
Analysis. World Journal of Social Science Research 2016;3(1):37-46. 16. Landis JR, Koch GG. The measurement of observer agreement for
categorical data. Biometrics 1977;33:159-74.
17. Cohen J. A power primer. Psychol Bull. 1992;112(1):155-9. 18. Mohamad Adam Bujang, Tassha Hilda Adnan. Requirements for
minimum sample size for sensitivity and specificity analysis. Journal of Clinical and Diagnostic Research 2016;10:YE01-YE06. 19. Donner A, Eliasziw M. A goodness-fo-fit approach to inference
procedures for the kappa statistic: Confidence interval construction, significance testing and sample size estimation. Statistics in Medicine 1992;11:1511-9.
20. Flack VF, Afifi AA, Lachenbruch PA. Sample size determinations for the two rater kappa statistic. Psychometrika 1988;53:321-5. 21. Domenic VC. Testing the normal approximation and minimal sample
size requirements of weighted kappa when the number of categories is large. Applied Psychology Measurement 1981;5(1):101-4. 22. Hayes AF, Krippendorff K. Answering the call for a standard
reliability measure for coding data. Communication Methods and Measures. 2007;1:77–89.