In industrial- and social-psychological research, the variables of interest are often measured by means of Likert-type questionnaires or scales. The internal validity of the conclusions reached in such research directly depends on the reliability (e.g., internal consistency) and the validity of the questionnaires or scales used. Typically, item-analytic procedures have been used to arrive at sets of internally consistent items and subsequently the validity of these scales was investigated by correlating the total scores on them with criteria of interest. In the case of multi-dimensional scales, both the convergent validity of the respective subscales (i.e., the degree to which the items within a particular subscale measure the same uni-dimensional construct), and their discriminant validity (i.e., the degree to which the items in different subscales measure different rather than the same construct) need to be considered. The analyses to investigate internal consistency, convergent validity and discriminant validity cannot proceed in just any order as the analysis of some of these properties presupposes that particular results have been obtained for the other. For example, in the case of multi-dimensional scales it makes little sense to investigate the internal consistency of the total scale by means of Cronbach’s alpha, as this index assumes uni-dimensionality. Green, Lizzits and Mulaik (1977) have shown that items showing a high coefficient alpha are not necessarily homogenous or uni-dimensional. As pointed out by Cortina (1993), coefficient alpha reflects the internal consistency of a test, that is, the interrelatedness among its items. This quantity is directly related to the ratio of the sum of the inter-item covariances to the total test variance. If there are more than one set of items in which the inter-item covariances are very high within the respective sets but low across the various subsets (so that multi-dimensionality is present), the present ratio (as reflected in alpha) may still be high. A high coefficient alpha therefore does not preclude the possibility of multi-dimensionality.
The purpose of this article is to demonstrate an item selection procedure which firstly maximises the internal consistency of the items retained within each subscale of a multi-dimensional scale, and then simultaneously maximises both the convergent
and discriminant validity of the different subscales through exploratory (rather than confirmatory) factor analysis.
A sequential item selection approach
Anderson and Gerbing (1988) suggested that multi-dimensional scales be developed by, firstly, defining preliminary scales through item-total correlations and/or exploratory factor analysis; secondly, examining the uni-dimensionality of these scales through confirmatory factor analysis; and finally, assessing the reliability of these scales through internal-consistency analyses. More recently, Wille (1996) suggested a sequential approach that starts off with internal-consistency analyses, followed by convergent and discriminant validity analyses. His procedure may be particularly applicable when different subscales (sets of items) have already been formed through some manner of scale development (comparable to the first phase of Anderson & Gerbing’s strategy). This study, while emulating the basic approach espoused by Wille, will incorporate some recent developments in its use of exploratory factor analysis (EFA) for investigating convergent and discriminant validity.
The first aspect of each subscale that is examined and modified in Wille’s stepwise procedure is its internal consistency. In this stepwise procedure, a subscale’s reliability is maximised by removing the least reliable item, as indicated by the expected increase (if any) in alpha for the subscale. The reliability analysis is then repeated, the increase in reliability noted, and the next least reliable item removed. This process is repeated until the removal of none of the remaining items would lead to an increase in the subscale’s alpha. While acknowledging the varying standards of reliability required for different applications, several authors (e.g., Cortina, 1993; Peterson, 1993; Steiner, 2003) have recommended 0,80 as an appropriate level of reliability for research instruments.
Once the reliabilities of the various subscales have been maximised through the sequential deletion of internally inconsistent items, Wille’s (1966) procedure examines and miximises these subscales’ convergent and discriminant validity, using exploratory factor analysis (EFA) in a similar stepwise fashion. The subscales’ discriminant validity is assessed and improved by identifying and
J RAUBENHEIMER
Department of Psychology University of the Free State
ABSTRACT
Wille (1996) proposed an item selection strategy which may be used to maximise, first, the internal consistency and, next, the convergent and discriminant validity of items in multi-dimensional Likert-type questionnaires or scales. In terms of his strategy, the latter aspects of validity are maximised by means of exploratory factor analyses. In this article, it is done by means of Tateneni, Mels, Cudeck and Browne’s (2001) Comprehensive Exploratory Factor Analysis (CEFA) program which implements exploratory factor analysis, but provides the advantages of standard confirmatory factor analysis (e.g., the computation of the standard errors of the rotated factor loadings and measures of “model” fit). The benefits that accrue by using this incremental approach are demonstrated in terms of Allport and Ross’ (1967) Religious Orientation Scale, a widely-used psychological instrument.
OPSOMMING
Wille (1996) het ’n itemseleksiestrategie voorgestel om eerstens die interne konsekwentheid, en tweedens die konvergente en divergente geldigheid van items in multi-dimensionele Likert-tipe vraelyste of skale te maksimeer. Volgens sy strategie word laasgenoemde aspekte van geldigheid deur middel van eksploratiewe faktorontledings gemaksimeer. In hierdie artikel, sal dit gedoen word deur Tateneni, Mels, Cudeck en Browne (2001) se program vir Omvattende Eksploratiewe Faktorontleding (CEFA) te gebruik, wat eksploratiewe faktorontleding aanwend, maar ook die voordele van gewone, bevestigende faktorontleding (bv., die berekening van die standaardfoute van die geroteerde faktorbeladings en indekse van modelpassing) bied. Die voordele wat spruit uit die toepassing van hierdie inkrementele benadering word gedemonstreer aan die hand van Allport en Ross (1967) se Religious Orientation Scale, ’n gewilde sielkundige meetintrument.
AN ITEM SELECTION PROCEDURE TO MAXIMISE
SCALE RELIABILITY AND VALIDITY
Requests for copies should be addressed to: J Raubenheimer, Department of Psychology, University of the Free State, PO Box 339, Bloemfontein, 9300
removing, one by one, the items that load significantly on more than one factor. At the same time, the subscales’ convergent validity is assessed and improved by identifying and removing, one by one, those items which fail to load significantly on any factor. These two criteria are evaluated simultaneously, and at each step the item which violates these requirements of discriminant and/or convergent validity to the greatest extent is removed, until none of the remaining items violate either form of validity. In applying this strategy, the test constructor should ensure that the items retained do not only satisfy these psychometric criteria, but that their content is commensurate with the theoretical construct(s) they are supposed to measure.
Browne (2001, p. 113) noted that many researchers use confirmatory factor analytic (CFA) methods in an exploratory fashion, carrying out numerous modifications (whether guided by modification indices or other criteria) in an attempt to improve fit. Thompson (1997) also found that researchers using CFA often neglect to examine the entire factor pattern and structure – a practice that could lead to the exclusion of important information relevant to the item analysis of a scale. In this context, EFA is more appropriate for the modification of the model, since the researcher has direct access to the total pattern of loadings, and can detect misspecified items on the basis of factor loadings, instead of modification indices. However, CFA is appealing because standard errors can be computed in such analyses, whereas standard statistical packages do not allow for their computation in the case of EFA. The first program to make this facility available in the context of EFA is the Comprehensive Exploratory Factor Analysis (CEFA) program of Tateneni, Mels, Cudeck and Browne (2001). This program can conduct a number of rotations not available in common statistical packages (Browne, 2001), and gives output such as standard errors of the rotated factor loadings, and confidence intervals (CIs) for the loadings themselves. The fit of the factor model can also be assessed with measures of fit (as with CFAs) supplied by the program. This allows CEFA to be used in a confirmatory mode. CEFA thus offers all the advantages of CFA, but still within in the context of EFA.
Wille’s (1996) study predates the publication of the CEFA program. Thus, while Wille used conventional EFA, the present study will apply CEFA to examine the convergent and discriminant validity of the subscales involved. Modifications of the subscales will be made on the basis of an examination of the standard errors of the rotated factor loadings and the CIs of the rotated factor loadings themselves, still in keeping with the cut-off criteria provided by Wille (1996). In all instances, the Maximum Wishart Likelihood (MWL) discrepancy function will be used, together with an Oblique Quartimax rotation. Although Likert-scale data is typically seen as being ordinal (Bollen, 1989, p. 433), the analysis of the subscales used in this study will nevertheless be conducted with the MWL fitting function, as alternatives more suitable to ordinal data such as Generally Weighted Least Squares (WLS) require extremely large sample sizes – in the order of thousands (Rigdon & Ferguson, 1991). Given the small sample size used in this study, WLS was considered not to be suitable for obtaining appropriate results. Furthermore, studies have shown that the MWL fitting function, while not ideal, can still be used under some (but not all) of the conditions associated with both ordinal data and non-normality (Bartholomew, 1983; Hu, Bentler & Kano, 1992). It has also been shown that, given certain caveats, Likert-scale data do not necessarily underperform in analyses intended for continuous data, nor is the interval assumption for these data that untenable (Gaito, 1980; Kenny, 1979, p. 253; Rasmussen, 1989; Velleman & Wilkinson, 1993). Moreover, the analysis of Likert-scale data with four or more categories as if these were continuous has even been recommended for structural equation modelling studies by some researchers (Bentler & Chou, 1987, p. 88; Jöreskog & Yang, 1996, p. 80).
With CFA, the number of factors to be extracted has to be specified a priori. The same is true for CEFA. Normally, it would be advisable to use the number of factors generally recommended
in the literature, but a scree plot (Cattell, 1978, pp. 60-62, 76-86; Gorsuch, 1983, pp. 165-167) may be used to confirm that number, or to determine the appropriate number of factors if a new scale is being developed. However, caution should be exercised when an established scale (such as the scale to be used in this study) is under examination. Here theory preferably should guide the decision on the number of desired factors, as the scree plot assumes that all the items are loading properly on their intended factors. Any deviant items, which will be removed in the trimming process demonstrated here, may cause a misleading indication of the number of factors in an initial scree plot. Once these items have been removed, a more appropriate indication of the “true” number of factors may emerge.
Lastly, a limit will be set to this maximisation process, since the number of items per factor is crucial. Specifically, if a scale were to measure only one factor, it would require at least four items to be properly identified. However, most scales in use measure more than just one factor. Scales with more than one factor may be identified with as little as two items per factor, although these should be seen as the exception. The usual case is that a minimum of three items must load significantly on each factor in a multi-dimensional scale, for all of the subscales to be successfully identified. The more items there are per factor, the more likely it is that the factor will replicate (Little, Lindenberger & Nesselroade, 1999; Velicer & Fava, 1998). It is thus recommended that absolutely no fewer than three items per factor be adhered to throughout. If a scale is being developed, and the items do not exhibit sufficient reliability and/or validity, additional items should be generated. In practice, a somewhat larger number of items is typically required for achieving acceptable reliability, particularly in the case of measures of typical rather than maximal performance.
METHOD
The scale to be investigated
The above-mentioned approach will be demonstrated by analysing Allport and Ross’ (1967) Religious Orientation Scale (ROS). Based on extensive prior work done by Allport and his associates, this scale was intended to differentiate between those individuals who have an intrinsic and those who have an extrinsic attitude toward religion. Leak (1993, p. 315) is of the opinion that the ROS is one of “the most popular and important measures in the psychology of religion,” and Hall, Tisdale and Brokaw (1994, p. 396) note that “there is considerable agreement that Allport’s ... concepts of Intrinsic ... and Extrinsic ... religiousness have been the most widely researched dimensions of religiousness in the empirical study of religiosity.” Kirkpatrick and Hood (1990, p. 442) also noted that Allport and Ross’ 1967 article was “probably the most frequently cited reference” in religious research, and that it provided the “backbone of empirical research in the psychology of religion.”
The ROS consists of 20 positively formulated items, the first nine of which are intended to measure the intrinsic religious orientation, and the eleven remaining items to measure the extrinsic religious orientation. The ROS, by nature of the different constructs measured by the two subscales, does not recommend the computation of a total score.
Several researchers have suggested revisions for the ROS. Changes recommended by Gorsuch and McPherson (1989) and Genia (1993) typically centred around dropping several of the items, and subdividing the remaining items into three, instead of the traditional two subscales. However, in these studies, the items were dropped simultaneously, and as will be shown in this study, dropping items one at a time in a stepwise process may lead to changes in the way the remaining items load on their respective factors.
Scores on the ROS do seem to display a fair degree of reliability. Although Allport and Ross (1967) did not report reliabilities for the ROS, subsequent reliabilities reported in the literature range from 0,67 to 0,93 (Donahue, 1985b, p. 418; Trimble, 1997, p. 976).
That the ROS correlates well with other measures of religious faith in general, and Christian faith in particular, has been amply documented (Bassett et al., 1991; Donahue, 1985a). The ROS has also stood up reasonably well to factor analytic studies. Although some researchers did find three factors (e.g., Genia, 1993; Gorsuch & McPherson, 1989; Kirkpatrick & Hood, 1990), most studies have confirmed the basic two-factor structure of the ROS (Donahue, 1985a). Even Kirkpatrick and Hood (1990, p. 446) made mention of the fact that their three-factor structure was not replicated very well by other researchers. Furthermore, Donahue found the average correlation between the two subscales across 28 studies to be -0,20. This correlation is relatively low, but still in the expected direction, and it would seem to indicate that the ROS does discriminate between the two related (but not equivalent) constructs of intrinsicness and extrinsicness.
Data set used
The data on which the analyses in this study are based were obtained from 369 White Christian students and young working people in Bloemfontein who completed a battery of questionnaires in 2001 as part of the present author’s doctoral research (Raubenheimer, 2002) into the relationship between Christian faith and romantic love.
A comparison between different sequences of maximising reliability and validity
The 20 items of the ROS (nine for Intrinsic and eleven for Extrinsic) were analysed according to two different sequences. In the first sequence, the two phases of Wille’s (1996) strategy were followed, whereas in the second, this order was reversed. In keeping with the first phase of Wille’s (1996) strategy, the reliability of the two subscales was determined with SPSS, and items whose absence would lead to an increase in reliability were removed, one by one, with the single item which would lead to the highest increase in reliability always being removed at any particular step. The items which remained after that point had been reached where no increase in reliability could be brought about through the removal of any of the remaining items, formed the item set subjected to Tateneni et al.’s (2001) CEFA program. In the second sequence, all the ROS items (nine for Intrinsic and eleven for Extrinsic) were used for the CEFA analyses and reliability analyses were then performed on the remaining sets of items.
In keeping with theoretical considerations (but also confirmed by a scree test), two factors were specified in both sequences for the CEFA analyses. Again, after each run, the item that, in the opinion of this researcher, violated the assumptions mentioned above to the greatest degree, was removed, and the remaining items re-analysed, until no items remained which violated either of the required assumptions.
Wille’s (1996, pp. 25-26) recommendations of a factor loading of =|0,40| (on the item’s intended factor) for convergent validity – a value also noted by other researchers (Anderson & Gerbing, 1988, p. 189; Gorsuch, 1997, p. 545; Velicer & Fava, 1998, p. 234), and of
£|0,25| (on all factors other than the item’s intended factor) for discriminant validity will be followed here. Although the CEFA program provides a good selection from the plethora of fit indices in existence, for simplification the CEFA results will include only one measure of fit commonly reported in CFA studies – the Root Mean Square Error of Approximation (RMSEA) (Steiger, 1990; Steiger & Lind, 1980). The proper interpretation of the RMSEA scores has evoked much debate, but in brief it should be noted that its CIs provide a better assessment of the overall fit of a model than a single point index (MacCullum, Browne & Sugawara, 1996). In accordance with Browne and Cudeck (1992, p. 239), Fabrigar, Wegener, MacCallum and Strahan (1999, p. 280), MacCallum et al. (1996, p. 134) and Steiger (1990), the RMSEA was to be interpreted as follows: Values of zero indicate perfect fit between the model and the data, values below 0,05 indicate good fit, values between 0,05 and 0,08 indicate fair fit, values between 0,08 and 0,1 mediocre fit, and values above 0,1 indicate poor fit.
RESULTS
Sequential removal of items to maximise reliability and validity in this order
In Table 1 it can be seen that it was necessary to eliminate only a few items to maximise the reliabilities of the ROS subscales in the first sequence. Only two items were removed from the Intrinsic subscale, and one from the Extrinsic subscale, before the respective reliabilities peaked. It is also interesting to note that the increase in reliability for the Intrinsic subscale was quite marked, although experience has shown that normally such increases are not as spectacular.
TABLE1
INCREASE INRELIABILITY AFTERREMOVAL OFUNRELIABLE ITEMS
Step Intrinsic Extrinsic
1 Initial a 0,6652 0,7477
2 Item removed Intrinsic6 Extrinsic1 Adjusted a 0,7352 0,7586
3 Item removed Intrinsic4 Adjusted a 0,7410
TABLE2
STEPWISECEFA RESULTS WITHPRIORREMOVAL OFUNRELIABLEITEMS
Step Item removed Aberrant loading(s) RMSEA after removal
Lower CI Point Upper CI
1 Initial CEFA of ROS with 3 unreliable 0,065 0,075 0,084 items removed
2 Extrinsic5 Intrinsic = -0,280, Extrinsic = 0,345 0,065 0,075 0,085
3 Extrinsic3 Intrinsic = 0,314 0,052 0,064 0,075
4 Extrinsic2 Extrinsic = 0,367 0,053 0,066 0,078
Only the point estimate of the aberrant loadings is given
An examination of Table 3 reveals that the items of the two ROS subscales now measure their intended factors exclusively and strongly, in the sense that the items load well on their intended factors, and do not load on the other factor. Also, the reliability of the Extrinsic subscale decreased slightly, although the decrease (0,0046) is not large, and may possibly be attributed to the shortening of the subscale. This slight decrease in reliability may be seen as a necessary sacrifice for the increased validity of the scale. The inter-scale correlation between the two factors increased from –0,14 to –0,32, which is within the range reported in the literature Donahue (1985b). Furthermore, this is in line with the nature and relationship of the ROS constructs, and may be ascribed to the better delineation of the constructs through the maximisation of the discriminant validity of the two subscales.
TABLE3
ROTATEDCEFA FACTORMATRIX OF THETRIMMEDROS
Item Factor loadings
Intrinsic Extrinsic
a 0,7410 0,7540
Intrinsic1 0,613 0,023
Intrinsic2 0,571 -0,044
Intrinsic3 0,700 -0,013
Intrinsic5 0,474 -0,183
Intrinsic7 0,402 -0,090
Intrinsic8 0,511 0,070
Intrinsic9 0,517 0,054
Extrinsic4 -0,081 0,550
Extrinsic6 0,113 0,523
Extrinsic7 -0,149 0,481
Extrinsic8 -0,072 0,622
Extrinsic9 0,040 0,741
Extrinsic10 -0,159 0,506
Extrinsic11 0,192 0,492
Sequential removal of items to maximise validity and reliability in this order
What remains to be shown are the benefits of removing the unreliable items from the scale prior to conducting the factor analyses intended to maximise the convergent and discriminant validity of the subscales. This is demonstrated in the results for the second sequence, in which the CEFA analyses were started with all 20 of the ROS items.
TABLE4
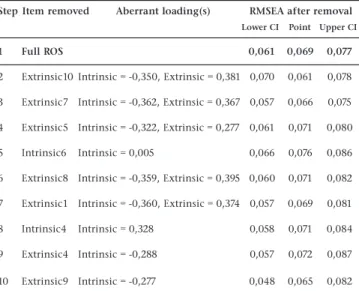
STEPWISECEFA RESULTS WITHOUTPRIORREMOVAL OFUNRELIABLEITEMS
Step Item removed Aberrant loading(s) RMSEA after removal
Lower CI Point Upper CI
1 Full ROS 0,061 0,069 0,077
2 Extrinsic10 Intrinsic = -0,350, Extrinsic = 0,381 0,070 0,061 0,078
3 Extrinsic7 Intrinsic = -0,362, Extrinsic = 0,367 0,057 0,066 0,075
4 Extrinsic5 Intrinsic = -0,322, Extrinsic = 0,277 0,061 0,071 0,080
5 Intrinsic6 Intrinsic = 0,005 0,066 0,076 0,086
6 Extrinsic8 Intrinsic = -0,359, Extrinsic = 0,395 0,060 0,071 0,082
7 Extrinsic1 Intrinsic = -0,360, Extrinsic = 0,374 0,057 0,069 0,081
8 Intrinsic4 Intrinsic = 0,328 0,058 0,071 0,084
9 Extrinsic4 Intrinsic = -0,288 0,057 0,072 0,087
10 Extrinsic9 Intrinsic = -0,277 0,048 0,065 0,082
Table 4 shows the results of a stepwise CEFA conducted without any prior removal of items to maximise reliability. From this table, it can clearly be seen that the presence of the unreliable items in the scale adversely affected the CEFA trimming process. Some items which were retained in the first sequence were removed in the second (when no prior removal of unreliable items took place). Also, in the second sequence, more items had to be removed to maximise both convergent and discriminant validity (as indicated by high loadings on own factors, and low loadings on other factors). All of these additional items were removed from the Extrinsic subscale (i.e., the trimmed versions of the Intrinsic subscale developed under both sequences were the same). Furthermore, the reliability of the Extrinsic scale dropped from 0,7540 in the first sequence (Table 3) to 0,6513 in the second (Table 5). It is thus clear that not removing the unreliable items first may result in a smaller, different, and less reliable scale. This different end product is shown in Table 5. An attempt to maximise the reliabilities in Table 5 through the removal of any of the remaining items (as the final step in the second sequence) was unsuccessful.
TABLE5
ROTATEDCEFA FACTORMATRIX OF THETRIMMEDROS
WITHOUTPRIORREMOVAL OFUNRELIABLEITEMS
Item Factor loadings
Intrinsic Extrinsic
a 0,7410 0,6513
Intrinsic 1 0,610 0,000
Intrinsic 2 0,588 0,026
Intrinsic 3 0,697 0,006
Intrinsic 5 0,567 -0,087
Intrinsic 7 0,418 0,106
Intrinsic 8 0,490 -0,010
Intrinsic 9 0,495 0,037
Extrinsic 2 0,040 0,565
Extrinsic 3 0,050 0,717
Extrinsic 6 -0,156 0,446
One thing which may seem to favour the second sequence is that its RMSEA values may seem to be slightly better than those of the first sequence, with the point estimate of the RMSEA being 0,065 in the second sequence (Table 4) as opposed to 0,666 in the first (Table 2). However, the span of the RMSEA’s CIs also plays an important role in assessing model fit. The second sequence has a far wider range in its CIs than the first, and this actually indicates poorer model fit than only the 0,001 difference in point estimate.
Unlike with the first sequence, the inter-scale correlation between the two factors weakened to 0,056 with the second sequence. Given the nature and theoretical relationship of the constructs, this weak correlation may also seem to be too artificial to be plausible.
DISCUSSION
In this study, the coefficients alpha and an index of model fit for the two subscales of the ROS which were trimmed by Tateneni et al.’s (2001) CEFA program (to maximise convergent and discriminant validity), were obtained with and without the removal of poorly reliable items prior to trimming. The eventual coefficient alpha for the Extrinsic subscale was 0,75 in the sequence requiring prior removal as opposed to 0,65 in the sequence without such removal. However, in both sequences the eventual coefficient alpha was the same (0,74) in the case of the Intrinsic subscale. Whether the prior removal of items by the present procedure will necessarily improve the reliability of the scales involved, is something that should be investigated empirically for the scales at hand. Even in this study, this approach benefited the reliability of one scale, but not that of the other. Whereas the index of model fit was about the same in both sequences, it showed a tighter confidence interval when poorly reliable items had been removed prior to the CEFA analysis.
The reliabilities found for the trimmed ROS subscales, although improved, still fall short of the recommended 0,80, but are at least above 0,70. Also, they compare well with values reported in the literature for the ROS, and highlight the problem of the less-than-desirable reliabilities of many scales routinely used in social research. (The ROS, for example, is the most-used scale in the psychological study of religion, with reliabilities of less than 0,70 often being reported.) Although the present method may weed out unreliable items, the only sure-fire way to increase the reliability of a scale would be to generate additional items, in which case the testing for convergent and discriminant validity would also have to be repeated.
The ROS was trimmed so as to provide two subscales that were quite reliable (a > 0,74) and showed adequate convergent and discriminant validity. In a stepwise process, six items were removed between the reliability analyses and the CEFAs. The trimmed version developed in this study consisted of the following items: Intrinsic: 1-3, 5, 7-9; Extrinsic: 4, 6-11. There were thus seven items for each subscale. Since there was no prior shortened version with which to compare this trimmed ROS, the success of the trimming process could not be evaluated in this respect. Although the trimmed version was applicable to this data set, its generalisability can only be answered with further testing on new samples.
It should be noted that the process of selecting the item to be removed in each round of the CEFA trimming process is made subjectively. Although one might quite easily write a computer program that can weigh up the different items according to the specified criteria, it might be best to force the researcher to actively examine the scale at each turn, as this brings the researcher much closer to the data, and thus to a better understanding of the nature of the scale than automation would. It might happen that, upon examination of the item loadings, different researchers might at some stage recommend different
items for removal, although the experience of this researcher has been that the end result remains relatively similar when two items are very close contenders for removal. The only circumstances under which this might not be the case is when the limit of three items per factor is being approached and stability in terms of convergent and discriminant validity has not yet been achieved.
Finally, it should be reiterated that the above procedure may be most useful when subsets of items or subscales have already been arrived at through some or other scale development process. Should one start out with a larger set of items prior to any screening process or dimensionality analysis, Anderson and Gerbing’s (1988) proposal to first arrive at preliminary scales through factor analytic methods would have to be considered. However, contrary to their recommendations, the present research demonstrates the merits of exploratory factor analysis, particularly comprehensive exploratory factor analysis, for investigating and maximising both convergent and discriminant validity.
REFERENCES
Allport, G. W. & Ross, J. M. (1967). Personal religious orientation and prejudice. Journal of Personality and Social Psychology, 5
(4), 432-443.
Anderson, J. C. & Gerbing, D. W. (1988). An updated paradigm for scale development incorporating unidemensionality and its assessment.Journal of Marketing Research, 25, 186-192. Bartholomew, D. J. (1983). Latent variable models for ordered
categorical data. Journal of Econometrics, 22, 229-243. Bassett, R. L., Camplin, W., Humphrey, D., Dorr, C., Biggs, S.,
Distaffen, R., Doxtator, I., Flaherty, M., Poage, R. & Thompson, H. (1991). Measuring Christian maturity: A comparison of several scales. Journal of Psychology and Theology, 19(1), 84-93.
Bentler, P. M. & Chou, C. P. (1987). Practical issues in structural modelling.Sociological Methods and Research, 16(1), 78-117. Bollen, K. A. (1989). Structural equations with latent variables.
New York: Wiley & Sons.
Browne, M. W. (2001). An overview of analytic rotation in exploratory factor analysis. Multivariate Behavioral Research,
36, 111-150.
Browne, M. W. & Cudeck, R. (1992). Alternative ways of assessing model fit. Sociological Methods and Research, 21(2), 230-258. Cattell, R. B. (1978). The scientific use of factor analysis in
behavioral and life sciences. New York: Plenum Press. Cortina, J. M. (1993). What is coefficient alpha? An examination
of theory and applications. Journal of Applied Psychology, 78, 98-104.
Donahue, M. J. (1985a). Intrinsic and extrinsic religiousness: review and meta-analysis. Journal of Personality and Social Psychology, 48(2), 400-419.
Donahue, M. J. (1985b). Intrinsic and extrinsic religiousness: The empirical research. Journal for the Scientific Study of Religion, 24(4), 418-423.
Fabrigar, L. R., Wegener, D. T., MacCallum, R. C. & Strahan, E. J. (1999). Evaluating the use of exploratory factor analysis in psychological research. Psychological Methods, 4
(3), 272-299.
Gaito, J. (1980). Measurement scales and statistics: Resurgence of an old misconception. Psychological Bulletin, 87 (3), 564-567.
Genia, V. (1993). A psychometric evaluation of the Allport-Ross I/E scales in a religiously heterogeneous sample. Journal for the Scientific Study of Religion, 32(3), 284-290.
Gorsuch, R. L. (1983). Factor analysis (2nd ed.). Hillsdale: Lawrence Erlbaum.
Gorsuch, R. L. (1997). Exploratory factor analysis: Its role in item analysis. Journal of Personality Assessment, 68(3), 532-560. Gorsuch, R. L. & McPherson, S. (1989). Intrinsic/Extrinsic
Green, S. B., Lissitz, R. W. & Mulaik, S. A. (1977). Limitations of coefficient alpha as an index of test unidimensionality.
Educational and Psychological Measurement, 37, 827-838. Hall, T. W., Tisdale, T. C. & Brokaw, B. F. (1994). Assessment of
religious dimensions in Christian clients: A review of selected instruments for research and clinical use. Journal of Psychology and Theology, 22(4), 395-421.
Hood, R. W. Jr. (1985). The conceptualization of religious purity in Allport’s typology. Journal for the Scientific Study of Religion, 24(4), 413-417.
Hu, L., Bentler, P. M. & Kano, Y. (1992). Can test statistics in covariance structure analysis be trusted? Psychological Bulletin, 112, 351-362.
Jöreskog, K. G. & Yang, F. (1996). Nonlinear structural equation models: The Kenny-Judd model with interaction effects. In G. A. Marcoulides and R. E. Schmacker (eds). Advanced structural equation modeling: Issues and techniques(pp. 57-88). Mahwah: Lawrence Erlbaum.
Kenny, D. A. (1979). Correlation and causality. New York: Wiley & Sons.
Kirkpatrick, L. A., & Hood, R. W. Jr. (1990). Intrinsic-extrinsic religious orientation: The boon or bane of contemporary psychology of religion. Journal for the Scientific Study of Religion, 29(4), 442-462.
Leak, G. K. (1993). Relationship between religious orientation and love styles, sexual attitudes and sexual behaviours.
Journal of Psychology and Theology, 21(4), 315-318.
Little, T. D., Lindenberger, U. & Nesselroade, J. R. (1999). On selecting indicators for multivariate measurement and modeling with latent variables: When “good” indicators are bad and “bad” indicators are good. Psychological Methods, 4
(2), 192-211.
MacCallum, R. C., Browne, M. W. & Sugawara, H. M. (1996). Power analysis and determination of sample size for covariance structure modeling. Psychological Methods, 1(2), 130-149.
Peterson, R. A. (1994). A meta-analysis of Cronbach’s coefficient alpha. Journal of Consumer Research, 21, 381-391.
Rasmussen, J. L. (1989). Analysis of Likert-scale data: A reinterpretation of Gregoire and Driver. Psychological Bulletin, 105(1), 167-170.
Raubenheimer, J. E. (2002). Structural modelling of the interrelationships between Christian faith, religious orientation and love styles. Unpublished doctoral dissertation. Bloemfontein: University of the Free State.
Rigdon, E. E. & Ferguson, C. E. Jr. (1991). The performance of the polychoric correlation coefficient and selected fitting
functions in confirmatory factor analysis with ordinal data.
Journal of Marketing Research, 28(4), 491-497.
Steiger, J. H. (1990). Structural model evaluation and modification: An interval estimation approach. Multivariate Behavioral Research, 25(2), 173-180.
Steiger, J. H. & Lind, J. C. (1980). Statistically-based tests for the number of common factors. Paper presented at the annual meeting of the Psychometric Society, Iowa City, IA. Streiner, D. L. (2003). Starting at the beginning: An introduction
to coefficient alpha and internal consistency. Journal of Personality Assessment, 80(1), 99-103.
Tateneni, K., Mels, G., Cudeck, R. & Browne, M. W. (2001).
Comprehensive Exploratory Factor Analysis (Version 1.03b) [CEFA 1.03].
Thompson, B. (1997). The importance of structural coefficients in structural equation modeling confirmatory factor analysis. Educational and Psychological Measurement, 57(1), 5-19.
Trimble, D. E. (1997). The Religious Orientation Scale: Review and meta-analysis of social desirability effects. Educational and Psychological Measurement, 57(6), 970-986.
Velicer, W. F. & Fava, J. L. (1998). Effects of variable and subject sampling on factor pattern recovery. Psychological Methods, 3
(2), 231-251.
Velleman, P. F. & Wilkinson, L. (1993). Nominal, ordinal, interval and ratio typologies are misleading. The American Statistician, 47(1), 65-72.
Wille, G. W. (1996). A stepwise procedure for the empirical assessment of latent variable models. Unpublished master’s thesis. Port Elizabeth: University of Port Elizabeth.
THE AUTHOR WOULD LIKE TO THANK:
Prof. G.K. Huysamen, who served as promoter for his Doctoral dissertation, and provided invaluable help in the compilation of this article; Dr. Gerhard Mels, Gavin Wille’s promoter, who shared the intricacies of this technique with the author, and provided much feedback during similar analyses performed for the author’s doctoral dissertation; and the editor and an anonymous reviewer, for a number of insightful comments.