Exploring the dynamics of transport in the
Dutch
limes
Received December 24, 2014 Revised March 4, 2015 Accepted April 22, 2015 Published August 18, 2015
Edited by Gerd Graßhoff and Michael Meyer, Excellence Cluster Topoi, Berlin
eTopoi ISSN 2192-2608 http://journal.topoi.org
Except where otherwise noted, content is licensed under a Creative Commons Attribution 3.0 License:
on the role of different modes of transport and the role of the natural environment. Firstly, a palaeogeographic reconstruction is presented encompassing both the natural and the cultural landscape. Transport networks for several modes are then reconstructed by cal-culating least cost paths that incorporate functions from physiological research. These networks are analysed using standard network analytical procedures. Interesting interpre-tations can be inferred from the results of these procedures, including some relating to the different characteristics of the transport modes but notably also the relative important role of stone-built settlements in the networks and the relative lack of control that the Roman forts have over the transport network.
Least cost analysis; network analysis; palaeogeography; Romanlimes; transport reconstruc-tion.
1 Introduction
The archaeological study of Roman transport systems in the Netherlands has traditionally focussed mainly on transport of regional to imperial scales. Examples of well-studied subjects are the Romanlimesroad,1Roman shipping on the Rhine and Meuse2including
interregional transports,3 canal construction,4 Roman harbours5 and other waterfront
installations.6Comparatively little research has been done on transport that occurred on local to intraregional scales. Thus little is known about how transport on these scales was organised and carried out, particularly for a ‘peripheral’ region such as the Dutch river area, which outside the main roads and rivers offered major environmental constraints for the type of transport that is known from Roman Italy and Gaul.7This lack of knowledge is further increased by the limited nature of the archaeological evidence for transport, including the likelihood that most local land-based transport connections are mere routes with very low archaeological visibility, rather than constructed roads.8
This research was performed within the framework of the ‘Finding the limits of thelimes’ project, funded by the Netherlands Organisation for Scientific Research (NWO, project nr. 276-61-005) through the VIDI Innovational Research Incentives Scheme. We would like to thank two anonymous reviewers for their constructive suggestions on improving this paper.
1 E. g. Modderman 1952; Luksen-IJtsma 2010.
2 E. g. Eckoldt 1980; de Weerd 1988; Jansma and Morel 2007.
3 E. g. Pals and Hakbijl 1992, 293–294; Domínguez-Delmás et al. 2014. 4 E. g. Hazenberg 2000.
5 E. g. Morel 1988; Polak and Wynia 1991; Driessen and Besselsen 2013.
6 E. g. Van Dinter 2013, 20, citing other sources; Seinen and Van den Besselaar 2014. 7 E. g. Chevallier 1988.
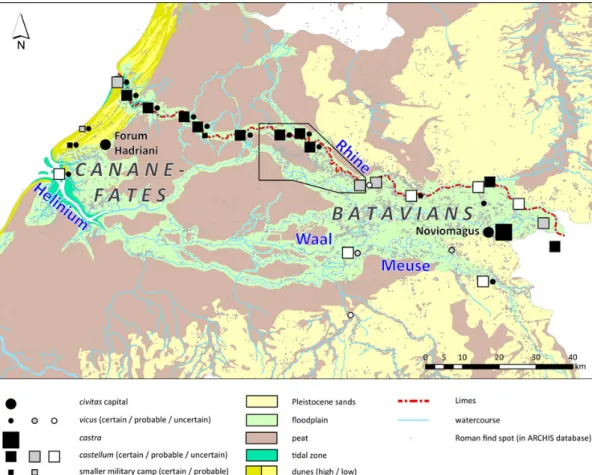
Fig. 1 | Palaeogeographic map of the Dutch river area around AD 100 with the case study area indicated. Physical palaeogeography is taken from P. Vos and de Vries 2013.
Given the limited nature of the archaeological evidence, computational approaches have become increasingly popular to study movement in archaeology,9with its basic com-ponents rather well understood.10 This paper aims to reconstruct and examine Roman
local transport networks using a conceptual model for transport and the application of cumulative cost paths11and network analysis.12 To achieve this, an integrative approach was applied using datasets and research from palaeogeography, physiology, archaeology and computational archaeological approaches.
This paper will present part of a project13 that focusses on the cultural landscape of the Dutch part of the Romanlimesencompassing the Batavian and Cananefatiancivitates
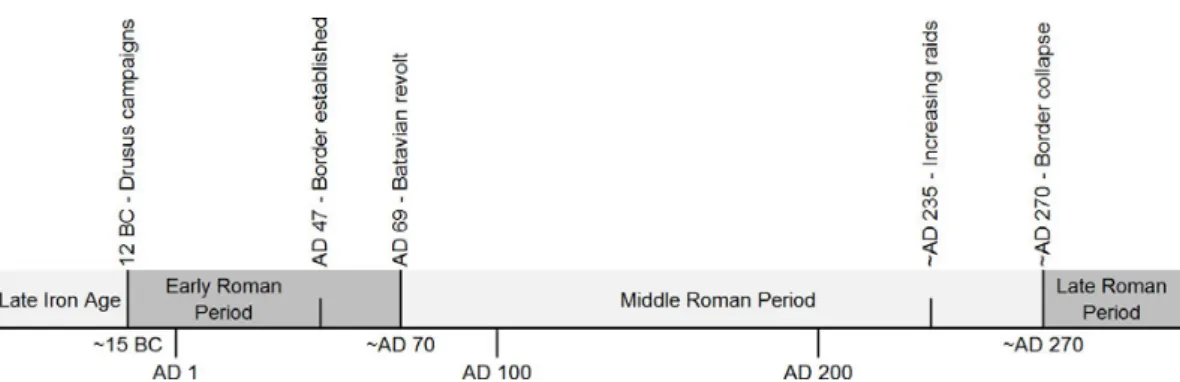
(Fig. 1), and in particular the spatial and economic relations between the local population and the Roman military population that inhabited the area starting from around 15 BC (Fig. 2). The paper will focus on the Kromme Rijn-Hollandse IJssel region within this area (Fig. 1), located immediately to the south of the Rhine which formed the northern border of the Roman Empire. Thelimes was dotted with military forts (castella) during the Roman occupation, including four forts within the current study area. This region is considered an ideal testing ground for reconstructing and examining Roman local
trans-9 E. g. Bell and Lock 2000; Llobera 2000; Bell, Wilson, and Wickham 2002; Fábrega-Álvarez and Parcero-Oubiña 2007; Zakšek et al. 2008; Murrieta-Flores 2014.
10 See e. g. Murrieta-Flores 2010 for an overview of influences on prehistoric movement. 11 Verhagen 2013.
12 Verhagen et al. 2014.
Fig. 2 | Timeline considered in this study, with the relevant archaeological periods and some notable events indicated.
port networks owing to the extensive archaeological studies14and other sources available
for palaeogeographical research.15
2 Methods
2.1 Transport modelling
Modelling transport networks is not straightforward; there are many influencing factors that change the way a transport network materialises. Murrieta-Flores names a number of factors that influence movement on foot, which can generally be subdivided in in-dependent factors (topography, terrain, time, human physical properties, carried loads and access to resources) and social factors (social conceptions or ideas regarding places, geographical knowledge, social networks, territoriality and visibility).16 For our study,
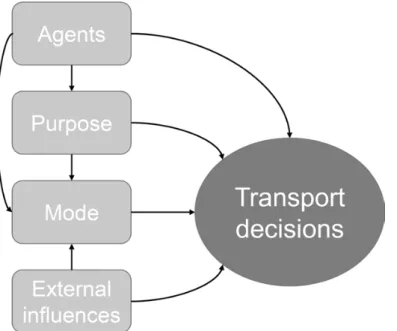
a conceptual model for transport decisions was created (Fig. 3). Important factors that determine the nature of transport and thus transport variability are the agents that are involved, the purpose for which the transport is undertaken and the mode of transport that is used. Besides these inherent elements of transport, external influences play a role as well. They can range from abstract factors such as (imperial) political pressures to very concrete features such as the natural environment. For the purpose of this paper, the dynamics of transport will be examined through two elements of this transport model, namely the mode of transport that is applied and the role of the natural environment.
2.2 Palaeogeography
In order to fully grasp the role of the natural environment on local transport networks, a detailed palaeogeographic map of the study area is required. One of the major diffi-culties in the study area and in the delta landscape of the Netherlands in general is the vast amount of landscape change that has occurred since the Roman period, primarily through river channel migration and avulsion and to some extent also peat extraction and drift-sand activity. Exemplary detailed palaeogeographic work has been performed for the western river area in the Netherlands,17 which also covers the northern edge of the current study area. We reused the methodology applied by Van Dinter to extend this
14 Particular for the Kromme Rijn region is W. Vos 2009; for the larger Bataviancivitasalso Willems 1986; Roymans 2004; Heeren 2009.
Fig. 3 | The conceptual transport model.
palaeogeographic reconstruction to the whole study area. It involves the combination of existing datasets including geomorphological,18 pedological,19 palaeogeographical20
and historical maps, LIDAR elevation data21and local information from archaeological research22 to construct a palaeogeographical map on a scale of 1:50,000 (Fig. 5). This
map represents the landscape in the Middle Roman Period, although the only significant landscape change in this area in comparison with the earlier periods is the river avulsion at Wijk bij Duurstede which marks the onset of the Lek river. Due to its position on the southern edge of the research area this has little influence on the following spatial analysis. During the reconstruction areas of uncertainty were identified, which can be attributed to the presence of urban development, sand or clay extraction sites or areas of natural post-Roman erosion, primarily through river activity. For the purpose of this study the most likely palaeogeographical unit was assigned to each uncertain area based on expert judgement, but through the explicit recognition of uncertainty further studies can also include more elaborate testing of the influence of the natural landscape by applying variation in the interpretation of the uncertain areas.
Fig. 4 | Reconstruction of the landscape around a typical rural settlement (Tiel-Passewaaijse Hogeweg) in the Dutch river area, situated on the levee of an abandoned stream bordering on marshy floodplains. Drawing by Mikko Kriek (VUhbs).
18 Berendsen 1982; Alterra 2008. 19 Alterra 2006.
20 Especially important is the research on the palaeogeographical development of the Rhine-Meuse delta by Cohen et al. 2012.
Fig. 5 | Simplified
palaeogeographical map of the research area during the Middle Roman Period with modern place and river names shown as reference.
Another important aspect of palaeogeography is the cultural landscape, or the land-scape created by man, in this study consisting of the settlements and the connections between peoples. The study area has a rich archaeological research tradition, which allows for a detailed reconstruction of the cultural palaeogeography. This is achieved through a reinterpretation of the existing archaeological evidence, which largely consists of entries in the Dutch national archaeological database23supplemented with data from other
sur-veys.24 The reinterpretation is done by following a standardised set of rules for
assign-ing an interpretation to archaeological finds. For example, through a minimum number of sherds within a radius of a specific distance, along with characteristic evidence for a certain archaeological activity, a find spot can be interpreted e.g. as a settlement, burial place or military site. The reinterpreted settlements are stored in an archaeological site database that also includes information on chronology, uncertainty of interpretation and references. Such a methodology has been applied in previous research,25and was updated
and extended to the current study area (Fig. 6). It must be noted that stone-built settle-ments only appear in the Middle Roman Period, although they may exist as post-built settlements in earlier periods.
2.3 Network reconstruction
A frequently used approach to study movement in archaeology is least cost path (LCP) modelling.26 One of the most important aspects of LCP modelling that makes it useful
for this kind of research is the ability to incorporate information about the natural en-vironment to model routes of movement between places. The cost surfaces required for LCP modelling can be calculated using different approaches,27often using functions from
physiological research on energy expenditure of movement on foot that take into account the effects of slope, and for that reason result in directional LCPs28that may follow
differ-ent routes depending on whether movemdiffer-ent is uphill or downhill. However, since we
23 Archis, https://archis.cultureelerfgoed.nl/.
24 In particular W. Vos 2009, including datasets from Roymans 2004; Nicolay 2007 and unpublished work by Ivo Vossen and Linda Verniers.
25 W. Vos 2009; Van Dinter et al. 2014. 26 E. g. Bell, Wilson, and Wickham 2002. 27 See Herzog 2013 for a discussion.
Fig. 6 | Simplified palaeogeographical map including a diachronic overview of the archaeological site database. Note that the sites identified as stone-built settlements in the database may appear in all archaeological periods, but prior to the Middle Roman Period are actually regular post-built settlements.
only find very small elevation differences in the study area29 the main cost component
that we need to take into account is the terrain surface. In the 1970s an American research group did extensive testing on the role of terrain surface on energy expenditure during movement while carrying varying loads,30 making it the most useful method to apply
given our research focus on transport across a differentiated landscape. The cost function from this research is adapted to calculate velocity (V in m/s) over a terrain surface with a certain cost coefficient () by a subject of a certain weight (W in kg) carrying a load (L in kg) while maintaining a constant metabolic rate (M in W) suited to travel large distances:
V =
s
M −1.5 W −2 ( W +L ) L W
2
1.5 η ( W +L )
Terrain coefficients were taken from Soule and Goldman31 and adapted to fit the
environmental units identified in the research area (Table 1). For this study, a constant subject weight of 60 kg and a constant metabolic rate of 340 W32were used. The effects of load and terrain surface on the velocity are given in Figs. 7 and 8.
It is more difficult to model movement of vehicles such as mule carts. Research on the movement of vehicles has so far only considered the effects of slope,33 or has only been performed for hand carts34and thus does not include animal traction. Estimates of average
mule cart speed over long distances35have therefore been used to set the travelling time
on paved roads. Furthermore, the terrain coefficients were modified (Table 1) to reflect the greater effort required to move a wheeled vehicle through difficult terrain compared to walking, because of rolling resistance, momentum loss due to terrain undulations and efficiency loss due to the movement of the centre of gravity on uneven terrain.36Another
uncertain factor which is difficult to account for is the effect of the terrain surface on the locomotion of traction animals.
29 The research area is generally flat and gradually sloping westward, covering an elevation difference of approximately three metres.
30 Soule and Goldman 1972; Pandolf, Givoni, and Goldman 1976. 31 Soule and Goldman 1972, 708.
32 The average metabolic rate that a person of 60 kg maintains while walking normally; Pandolf, Givoni, and Goldman 1976.
33 Herzog 2013, 377–378. 34 Haisman and Goldman 1974.
Fig. 7 | Load versus velocity with terrain coefficient set at 1.
Fig. 8 | Terrain coefficient versus velocity with load set at 0.
Using the aforementioned cost function and variables and after introducing a random noise factor to promote concentration of paths and avoid countless parallel paths,37cost surfaces were created for the following scenarios: walking without load (W0); walking with a load of 20 kg (W20); walking with a load of 40 kg (W40), which is meant to represent the maximum that an average person can achieve when absolutely necessary; and mule cart transport (MC). LCPs were then calculated between all possible sources and destinations in the archaeological site database of the research area, to arrive at a cumulative cost path map of the region (Fig. 8).38 Simultaneously, every route that was
37 See Verhagen 2013, 385–386.
Surface terrain Walking coefficient
Mule cart coefficient
Water 20 134
Military road 1 1 High levee 1.1 1.7 Moderately high levee 1.1 1.7 Low levee 1.1 1.7 Residual gully 1.5 4.5 High floodplain 1.5 4.5 Low floodplain 1.8 6.6 Fen woodlands 1.8 6.6 Reed and sedge fields 1.8 6.6 Cover sands 1.2 4.5
High pleistocene sands 1.5 2.4 Tab. 1 | Terrain coefficients.
created during the LCP modelling was saved to a database storing its source, destination, length and travel time, in order to be used for network analysis.
2.4 Network analysis
The use of network analysis techniques in LCP modelling has only recently been ex-plored.39 Since there is no directionality in this case study and other possibly important
factors such as population size and production/consumption in settlements are not yet in-corporated, the route network could be analysed using techniques for simple node-based networks with unweighted and undirected edges. Among the measurements investigated are global network measurements such as number of connected components, clustering coefficient, network centralisation, characteristic path length, average degree, network density and network heterogeneity, and the local measurements of closeness centrality, betweenness centrality and neighbourhood connectivity.40
An analysis of a completely connected network is pointless, as there would be no difference between the different networks. Therefore, the amount of edges, i. e. the routes between sites, was reduced to include only those that can be travelled within 20 minutes. This critical point was chosen as most networks in this study show major fracturing at lower cut-off points. Although choosing a critical point is arbitrary, it can be partly justified by studies on human navigation and wayfinding which argue that a route towards a destination often consists of a number of smaller routes between known landmarks that the traveller is familiar with and that are part of his so-called cognitive map.41Given the low relief and assumed significant amount of deforestation in the Roman Period, other settlements may have functioned as important landmarks while travelling. One aspect that is not taken into account but should be explored in further studies is a similar role for burial sites in the cognitive map, as archaeological research has shown that cemeteries dating to the Roman period are often situated alongside prehistoric burial sites, indicating that prehistoric and contemporary burial sites were recognised and consciously incorpo-rated in the Roman cultural landscape.42
39 Verhagen et al. 2014.
40 All network analyses were performed using theNetwork Analyzerplugin in Cytoscape 3.1.0. 41 Murrieta-Flores 2010, 260–261.
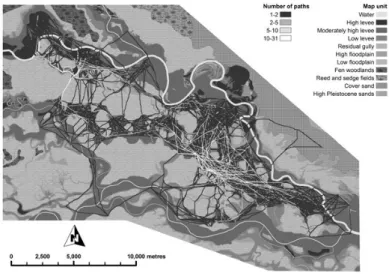
Through the combination of LCPs between all sites in the archaeological database, a cumulative cost path map was created (Fig. 9), which gives some indications of the main transport corridors. As can be expected from the cost map inputs, most transport move-ments occur on the high levees that are positioned centrally in the study area. The shape of the different networks based on the mode of transportation can be compared visually. However, through the application of network analysis additional information on the structures of the various networks can be obtained.
Fig. 9 | Cumulative cost path map of mule cart transport between all sites in the archaeological site database.
A number of global network measurements were calculated for the twelve networks, representing four different modes across three different time slices (Table 2). The termi-nology used will be shortly explained here:44
• Firstly, the number of nodes represents the number of unique sources and destina-tions of routes in the network, which equals the number of sites known from that period in the archaeological site database.
• The number of connected components is the number of groups of nodes (i. e. con-taining at least two nodes) which are not connected to other groups of nodes. A completely connected network would thus have only one connected component. The networks analysed in this study often consist of one very large component and a number of minor components located around the edges of the research area. In addition, a number of isolated nodes can exist, which are not connected to any other node and are therefore not counted as part of the number of connected components.
43 It must be noted that the dataset on Late Iron Age sites is incomplete, as it only includes sites that were also continuous into at least the Early Roman Period. Any comparison between Late Iron Age networks and other networks must therefore be made with caution.
• The average clustering coefficient is an average of the measurements of the extent to which the neighbours of a node in the network are also neighbours themselves. • Network centralisation is a measurement of how central its most central node is in
comparison to all other nodes. A decentralised network will therefore have a low network centralisation.
• The characteristic path length, also known as the average shortest path length, is the average of all path lengths (number of edges) between any two connected nodes. • The average degree is the average of the number of neighbours each node has. • The network density is a normalised version of the average degree, so that network
density is highest (equal to 1) when the network is completely connected and lowest (equal to 0) when all nodes are isolated.
• Network heterogeneity represents the tendency of a network to contain a few highly connected (hub) nodes, while the majority of nodes have very few connections. A more inhomogeneous network thus contains fewer hub nodes and more nodes with a relatively equal amount of connections.
Time p erio d Mo de Numb er of no des Numb er of conne cte d comp onents A ver age
clustering coefficient
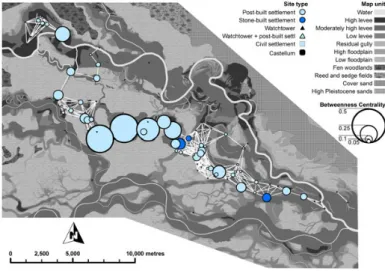
Fig. 10 | Betweenness centrality measurements of all sites in the Late Iron Age mule cart network.
Fig. 11 | Betweenness centrality measurements of all sites in the Early Roman mule cart network.
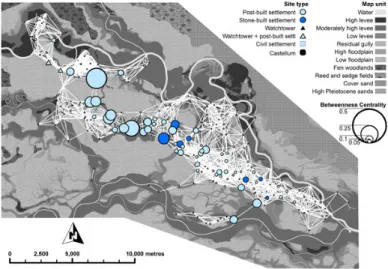
Fig. 13 | Betweenness centrality measurements of all sites in the Middle Roman network of walking without a load.
Fig. 14 | Betweenness centrality measurements of all sites in the Middle Roman network of walking with a load of 20 kg.
Fig. 16 | Neighbourhood connectivity measurements of all sites in the Middle Roman mule cart network.
4 Discussion
4.1 Global network measurements
Some interesting patterns can be inferred from the comparison of global network mea-surements (Table 2) of the transport networks based on modes (shortened here to W0, W20, W40 and MC) and time periods. Such patterns can perhaps be attributed to different inherent properties of the transport mode involved, which could have played a role in the decision-making process of transport agents in the past. Chronological trends can also be attributed to developments in the transport systems, societal structure or other factors that might influence the transport network from the Late Iron Age through the Early and Middle Roman Period. However, such archaeological interpretations must be treated with caution, as there will almost inevitably be other factors influencing the results, such as incomplete datasets, uncertain interpretations and dating of archaeological sites or uncertainties in the palaeogeographical mapping.
Roman Period through the Middle Roman Period, new sites appear primarily within the existing network, thereby increasing interconnectedness. This is reflected in the sharp increase in the average degree and slight increase in the average clustering coefficient, while the characteristic path length with the exception of the W40-networks declines slightly. This may be interpreted archaeologically as the result of population growth and increased settlement density, which allow for more complex and more extensive social interactions.
4.2 Local network measurements
The networks can also be compared in some more detail. One interesting local network measurement is betweenness centrality, which is plotted in Figs. 10–15. In all networks an elongated group of sites forms a dense and often interconnected network on the central levee in the study area. A significant northern group is connected to the main compo-nent over a small crevasse splay that acts as a slightly elevated and traversable levee in a floodplain that is otherwise less attractive to transport. The sites directly on the edges of this corridor have a high betweenness centrality as long as this connection is intact. This northern group however disconnects in the W20- and W40-networks. This creates an isolated component with a number of sites of very high betweenness centrality within their own component that are otherwise not important as part of the larger network. More interestingly, no connection is made in any of the networks between this northern group and the sites towards the east across the levees of the Rhine.
A small number of sites with high betweenness centrality can be observed in the heart of the research area, connecting the western and northern groups of sites with the large concentration of sites in the eastern half of the research area. The high betweenness centrality of these central sites indicate that they likely controlled much of the east-west directed transport movements in the study area.
A further interesting observation is the low betweenness centrality of the four forts and the civil settlements associated with these military sites, which may indicate that these sites were not important in local transport networks. This can partly be attributed to edge effects, as one of these sites is located in the south-eastern extremity of the study area and all are bordering the Rhine, which is a relative extremity since very few sites are known from the northern bank. However, the network reconstructions show that transport is most likely to have occurred on the central levee crossing the research area, rather than on the levees of the Rhine itself, and thus local transport does not appear to need the constructed military road which runs roughly parallel to the Rhine. It must be noted that these reconstructions as of yet do not include weighting of the transport connections, as the greater population size and consumption will certainly have intensified transport from and to these sites.
To further clarify the relation between the archaeological evidence of roads, which primarily concentrates around the militarylimesroad, and the transport network recon-structions, a comparison with the archaeological evidence can be made. Based on ar-chaeological evidence and interpretations a number of road reconstructions have been published,45which have been combined and overlain on the Middle Roman MC-network
reconstruction (Fig. 17). It is again evident that most local transport connections are found on the central levee rather than on the levees of the Rhine, where the militarylimesroad is located. It can therefore be argued that this road has little importance for local land-based transport connections, but will have primarily been used for transport between the forts, the guarding of river transport and quick (inter)regional information transfer along the
limes.
Fig. 17 | Roman road reconstruction based on archaeological evidence, overlain on the Middle Roman mule cart network.
5 Conclusion
This paper aimed to reconstruct and examine Roman local transport networks using a multidisciplinary approach, drawing on methods and data from palaeogeography, phys-iology, archaeology and computational archaeological approaches. A palaeogeographical map with an archaeological site database was constructed and LCP networks were cal-culated for various transport modes. These were subsequently analysed using network
extensive social interactions.
Looking at the transport networks in more detail, we can observe disproportionally high betweenness centrality measurements for stone-built settlements. One interpreta-tion might be that their importance for transport networks created more wealth and status for these sites. At the other end of the spectrum, the Roman military forts and civil settlements have very low betweenness centrality measurements, indicating that they only played a minor role in the local transport movements of the research area. A comparison with a road reconstruction based on archaeological evidence also shows that the Roman militarylimes road does not play a major role in the local transport networks, as local transport is mostly concentrated on the central levee rather than on the levees of the Rhine.
References
Alterra 2006
Alterra. Bodemkaart van Nederland 1:50.000. Wageningen: Alterra, Wageningen UR, 2006.
Alterra 2008
Alterra.Geomorfologische Kaart van Nederland 1:50.000. Wageningen: Alterra, Wagenin-gen UR, 2008.
Bell and Lock 2000
T. Bell and G. Lock. “Topographic and Cultural Influences on Walking the Ridgeway in Later Prehistoric Times”. InBeyond the Map. Archaeology and Spatial Technologies. Ed. by G. Lock. Amsterdam: IOS Press, 2000, 85–100.
Bell, Wilson, and Wickham 2002
T. Bell, A.I. Wilson, and A.J. Wickham. “Tracking the Samnites: Landscape and Com-munications Routes in the Sangro Valley, Italy”. American Journal of Archaeology106 (2002), 169–186.
Berendsen 1982
H.J.A. Berendsen.De genese van het landschap in het zuiden van de provincie Utrecht. Utrechtse Geografische Studies 25. Utrecht: Department of Geography, University of Utrecht, 1982.
Chevallier 1988
R. Chevallier.Voyages et déplacements dans l’Empire Romain. Paris: Armand Colin, 1988. Cohen et al. 2012
K.M. Cohen, E. Stouthamer, H.J. Pierik, and A.H. Geurts.Rhine-Meuse Delta Studies’ Digital Basemap for Delta Evolution and Palaeogeography. Utrecht: Department of Physical Geography, Utrecht University, 2012.
Domínguez-Delmás et al. 2014
M. Domínguez-Delmás, M. J. Driessen, I. García-González, N. van Helmond, R. Visser, and E. Jansma. “Long-Distance Oak Supply in Mid-2nd Century AD Revealed: the Case of a Roman Harbour (Voorburg-Arentsburg) in the Netherlands”.Journal of Ar-chaeological Science41 (2014), 642–654.
Driessen and Besselsen 2013
M. J. Driessen and E. Besselsen.Voorburg-Arentsburg: een Romeinse havenstad tussen Rijn en Maas. Themata 7. Amsterdam: University of Amsterdam, 2013.
Eckoldt 1980
M. Eckoldt.Schiffahrt auf kleinen Flüssen Mitteleuropas in Römerzeit und Mittelalter. Schriften des Deutschen Schiffahrtsmuseums 14. Oldenburg: Stalling Verlag, 1980.
Fábrega-Álvarez and Parcero-Oubiña 2007
P. Fábrega-Álvarez and C. Parcero-Oubiña. “Proposals for an Archaeological Analysis of Pathways and Movement”.Archeologia e Calcolatori18 (2007), 121–140.
Haisman and Goldman 1974
het Cultureel Erfgoed, 2009.
Herzog 2013
I. Herzog. “Theory and Practice of Cost Functions”. InFusion of Cultures. Proceedings of the 38th Annual Conference on Computer Applications and Quantitative Methods in Archaeol-ogy, Granada, Spain, April 2010. Ed. by F. Contreras, M. Farjas, and F.J Melero. Oxford: Archaeopress, 2013, 375–382.
Jansen and de Kort 2004
B. Jansen and J.W. de Kort.Toelichting limes-kaart Utrecht, provincie Utrecht. RAAP-rapport 1054. Amsterdam: RAAP Archeologisch Adviesbureau, 2004.
Jansma and Morel 2007
E. Jansma and J.M.A.W. Morel. Een Romeinse Rijnaak, gevonden in Utrecht-De Meern. Resultaten van het onderzoek naar de platbodem ’De Meern 1’. Rapportage Archeologische Monumentenzorg 144. Amersfoort: Rijksdienst voor Archeologie, Cultuurlandschap en Monumenten, 2007.
Llobera 2000
M. Llobera. “Understanding Movement: a Pilot Model towards the Sociology of Move-ment”. InBeyond the Map. Archaeology and Spatial Technologies. Ed. by G. Lock. Amster-dam: IOS Press, 2000, 65–84.
Luksen-IJtsma 2010
A. Luksen-IJtsma.De limesweg in West-Nederland. Inventarisatie, analyse en synthese van archeologisch onderzoek naar de Romeinse weg tussen Vechten en Katwijk. Basisrapportage Archeologie Gemeente Utrecht 40. Utrecht: StadsOntwikkeling, Gemeente Utrecht, 2010.
Modderman 1952
P.J.R. Modderman. “Het probleem van de Romeinse wegen in het rivierkleigebied”.
Bijdragen en Mededeelingen van de Vereeniging Gelre52 (1952), 21–28. Morel 1988
J.M.A.W. Morel.De vroeg-Romeinse versterking te Velsen. Amsterdam: University of Am-sterdam, 1988.
Murrieta-Flores 2010
Murrieta-Flores 2014
P.A. Murrieta-Flores. “Developing Computational Approaches for the Study of Move-ment: Assessing the Role of Visibility and Landscape Markers in Terrestrial Navigation during Iberian Late Prehistory”. InComputational Approaches to the Study of Movement in Archaeology. Ed. by S. Polla and P. Verhagen. Berlin: De Gruyter, 2014, 99–131. Nicolay 2007
J.A.W. Nicolay.Armed Batavians. Use and Significance of Weaponry and Horse Gear from Non-military Contexts in the Rhine Delta (50 BC to AD 450). Amsterdam Archaeological Studies 11. Amsterdam: Amsterdam University Press, 2007.
Pals and Hakbijl 1992
J.P. Pals and T. Hakbijl. “Weed and Insect Infestation of a Grain Cargo in a Ship at the Roman Fort of Laurium in Woerden (Province of Zuid-Holland)”. Review of Palaeobotany and Palynology73 (1992), 287–300.
Pandolf, Givoni, and Goldman 1976
K.B. Pandolf, B. Givoni, and R.F. Goldman. “Predicting Energy Expenditure with Loads while Standing or Walking Very Slowly”.Journal of Applied Physiology43 (1976), 577– 581.
Polak and Wynia 1991
M. Polak and S.J. Wynia. “The Roman Forts at Vechten. A Survey of the Excavations 1829–1989”.Oudheidkundige mededelingen van het Rijksmuseum van Oudheden te Leiden
71 (1991), 125–156. Rijkswaterstaat-AGI 2013
Rijkswaterstaat-AGI.Actueel Hoogtebestand Nederland 2. Delft: Rijkswaterstaat-AGI, 2013. Roth 1999
J.P. Roth.The Logistics of the Roman Army at War (264 B.C. – A.D. 235). Columbia Studies in the Classical Tradition 23. Leiden: Brill, 1999.
Roymans 1995
N.G.A.M. Roymans. “The Cultural Biography of Urnfields and the Long-Term History of a Mythical Landscape”.Archaeological Dialogues2 (1995), 2–24.
Roymans 2004
N.G.A.M. Roymans.Ethnic Identity and Imperial Power. The Batavians in the Early Roman Empire. Amsterdam Archaeological Studies 10. Amsterdam: Amsterdam University Press, 2004.
Seinen and Van den Besselaar 2014
P.A. Seinen and J.A. Van den Besselaar. “A Late Roman Quay in the River Meuse near Cuijk, Netherlands”.International Journal of Nautical Archaeology43 (2014), 330–342. Soule and Goldman 1972
R.G. Soule and R.F. Goldman. “Terrain Coefficients for Energy Cost Prediction”. Jour-nal of Applied Physiology32 (1972), 706–708.
Van Dinter 2013
De-Van Es 1994
W.A. Van Es. “Wijk bij Duurstede – De Geer”. InRomeinen, Friezen en Franken in het hart van Nederland. Van Traiectum tot Dorestad, 50 v.C.–900 n.C. Ed. by W.A. van Es and W.A.M Hessing. Amersfoort: Matrijs, 1994, 231–233.
Verhagen 2013
P. Verhagen. “On the Road to Nowhere? Least Cost Paths, Accessibility and the Pre-dictive Modelling Perspective”. InFusion of Cultures. Proceedings of the 38th Annual Con-ference on Computer Applications and Quantitative Methods in Archaeology, Granada, Spain, April 2010. Ed. by F. Contreras, M. Farjas, and F.J Melero. Oxford: Archaeopress, 2013, 383– 389.
Verhagen et al. 2014
P. Verhagen, T. Brughmans, L. Nuninger, and F. Bertoncello. “The Long and Winding Road: Combining Least Cost Paths and Network Analysis Techniques for Settlement Location Analysis and Predictive Modelling”. InCAA2012. Proceedings of the 40th Con-ference in Computer Applications and Quantitative Methods in Archaeology, Southampton, United Kingdom, 26-30 March 2012. Ed. by G. Earl, T. Sly, A. Chrysanthi, P.A. Murrieta-Flores, C. Papadopoulos, I. Romanowska, and D. Wheatley. Amsterdam: Pallas Pub-lications, 2014, 357–366.
P. Vos and de Vries 2013
P.C. Vos and S. de Vries.2e generatie paleogeografische kaarten van Nederland (versie 2.0). Utrecht: Deltares, 2013.
W. Vos 2000
W.K. Vos. Archeologisch onderzoek Houten-Zuid op terrein 8A. ADC Rapport 30. Bun-schoten: ADC, 2000.
W. Vos 2009
W.K. Vos.Bataafs platteland. Het Romeinse nederzettingslandschap in het Nederlandse Kromme-Rijn gebied. Nederlandse Archeologische Rapporten 35. Amersfoort: Rijksdienst voor het Cultureel Erfgoed, 2009.
de Weerd 1988
M.D. de Weerd.Schepen voor Zwammerdam. Bouwwijze en herkomst van enkele vaartuig-typen in West- en Middeneuropa uit de Romeinse tijd en de Middeleeuwen in archeologisch perspectief. Amsterdam: University of Amsterdam, 1988.
Willems 1986
Zakšek et al. 2008
Mark R. Groenhuijzen, MSc VU University Amsterdam Faculty of Humanities
CLUE+ Research Institute for Culture, History and Heritage De Boelelaan 1105
1081HV Amsterdam, The Netherlands [email protected]
Philip Verhagen
Philip Verhagen graduated in Physical Geography at VU University Amsterdam in 1989, and has worked in commercial archaeology between 1992 and 2008 as specialist in GIS and archaeological computing. In 2007 he completed his doctoral thesis on predictive modelling in archaeology at Leiden University. He was awarded a VENI-grant from NWO for post-doctoral research on predictive modelling for the period 2009–2012, and is now working on his new post-doctoral project “Finding the limits of the limes” after receiving a VIDI-grant from NWO, aiming to apply spatial dy-namical modelling to reconstruct and understand the development of the cultural landscape in the Dutch part of the Roman limes.
Dr. Philip Verhagen VU University Amsterdam Faculty of Humanities
CLUE+ Research Institute for Culture, History and Heritage De Boelelaan 1105