IMMUNOPHENOTYPING OF THE INFLAMMATORY RESPONSE OF POTENTIALLY PRECANCEROUS ORAL MUCOSAL LESIONS
Andres David Flores Hidalgo
A thesis submitted to the faculty of the University of North Carolina at Chapel Hill in partial fulfilment of the requirement for the degree of Master of Science in Oral and Maxillofacial
Pathology in the School of Dentistry.
Chapel Hill 2018
Approved by:
Ricardo Padilla
Valerie Murrah
ii 2018
iii ABSTRACT
Andres David Flores Hidalgo: Immunophenotyping the inflammatory response of potentially precancerous oral mucosal lesions
(Under the direction of Ricardo Padilla)
Objective: Identify the type and distribution of CD4+ and CD8+ T-lymphocytes in oral mucosa specimens to potentially distinguish underlying alterations or patterns between oral epithelial dysplasia and oral lichen planus.
Methods: For this pilot study, 15 archival tissue samples received at UNC Oral and Maxillofacial Pathology Laboratory, diagnosed as oral lichen planus, moderate to severe epithelial dysplasia and overlapping equivocal cases between dysplasia and lichen planus were selected. Dual staining with CD4 and CD8 antibodies was carried out on each case. Slides were scanned in the Aperio ScanScope FL (Leica Biosystems, Wetzlar, Germany) and archived. Histomorphometric analysis of the cells that expressed biomarkers of in the epithelium and connective tissue regions was performed.
Results: No differences were found in amount and ratio of CD4+/CD8+ lymphocytes between the three groups analyzed. The intraepithelial CD8+ lymphocyte distribution was strikingly different between lichen planus and moderate to severe epithelial dysplasia.
iv
“My brother is one of my true heroes. Steady and sober where I am impulsive and emotional.” Mark McKinnon
v
ACKNOWLEDGEMENTS
I would first like to thank my thesis advisor Dr. Ricardo Padilla, Program Director and mentor at University of North Carolina at Chapel Hill. The door of Dr. Padilla’s office was always open whenever I had a question regarding research, pathology or anything else. He went above and beyond to help and guide me through this process, sometimes even without asking.
I would also like to thank Dr. Valerie Murrah, Department Chair of Diagnostic Sciences at UNC at Chapel Hill.I am gratefully indebted to her, for her very valuable comments on this thesis project and teachings during my graduate program.
You both gave me a unique and incredible opportunity at UNC, and for that I will be eternally grateful.
I would also like to acknowledge Dr. Yuri Fedoriw, Director of Hematopathology at UNC Hospitals, for his precious support and expertise.
Finally, I must express my very profound gratitude to my family, co-residents and friends, Dr. Alice Curran among them, for providing me with unfailing support and encouragement throughout my years of residency and through the process of developing this project. This accomplishment would not have been possible without them. Thank you.
vi
TABLE OF CONTENTS
LIST OF FIGURES ... ix
LIST OF TABLES ... xi
LIST OF ABBREVIATIONS ... xii
LITERATURE REVIEW ... 1
Biology of Oral Lichen Planus ... 2
T-Cell Migration into the Epithelium ... 3
T-Cell Activation ... 3
Basal Keratinocyte Apoptosis ... 4
Malignant transformation of Oral Lichen Planus ... 5
Oral Lichen Planus vs Epithelial Dysplasia ... 7
Considerations about the Microscopic Diagnosis of Oral Epithelial Dysplasia ... 8
AIMS AND OBJECTIVES ... 11
Objective ...11
MATERIALS AND METHODS... 12
Specimen Selection ...12
Inclusion and Exclusion Criteria ...13
Exclusion Criteria: --- 13
vii
Study Procedures ...14
Analysis of IF Images: --- 14
Formula’s for Co-Expression Percentage Determinations: --- 16
Data Analysis ...17
Statistical Analysis ...17
Analysis of the Distribution of CD8+ T-cells in Lichen Planus vs Epithelial Dysplasia ...17
RESULTS ... 19
Baseline Characteristics ...19
CD4+/CD8+ Ratio in Oral Lichen Planus ...20
CD4+/CD8+ Ratio in Epithelial Dysplasia ...20
Statistical Analysis ...21
Power Analysis: --- 21
Confidence Intervals: --- 22
Confidence Intervals in Lichen Planus vs Epithelial Dysplasia in Zone 1 ...22
Confidence Intervals in the Lichen Planus vs Epithelial Dysplasia in Zone 2 ...23
Analysis of the Distribution of CD8+ T-cells in Lichen Planus vs Epithelial Dysplasia ...24
DISCUSSION ... 25
Phenotype of Inflammatory Cells in Oral Lichen Planus ...25
viii CD4+/CD8+ cell ratio in Oral Lichen Planus vs
Epithelial Dysplasia with Lichenoid Features ...29
CONCLUSIONS ... 32
ix
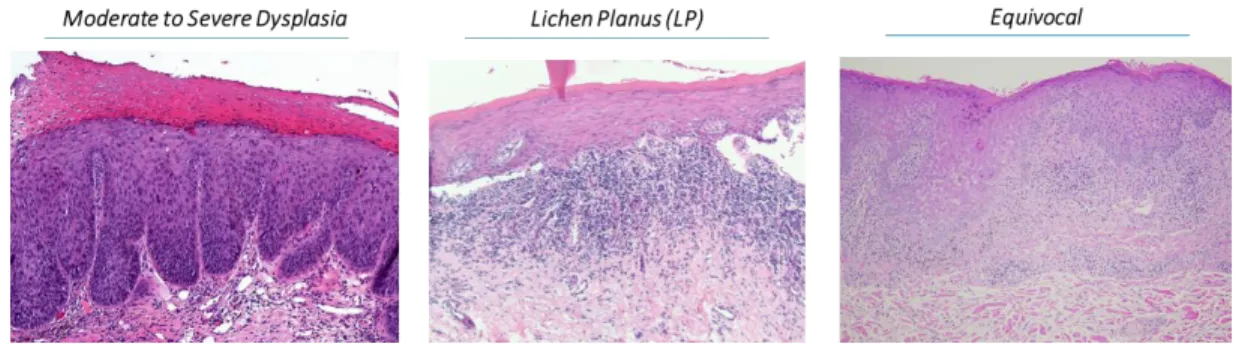
LIST OF FIGURES Figure 1. Examples of cases selected per group
(Stain: Hematoxylin and Eosin) ...12
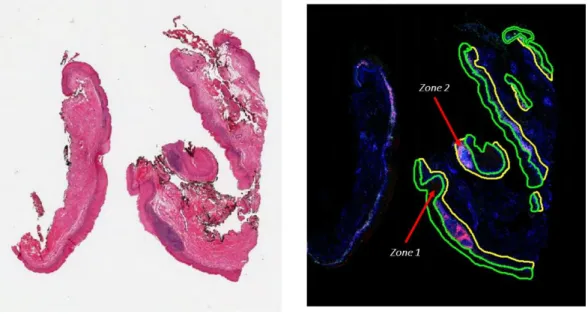
Figure 2. Example of annotations made on IF/IHC slides. ...15
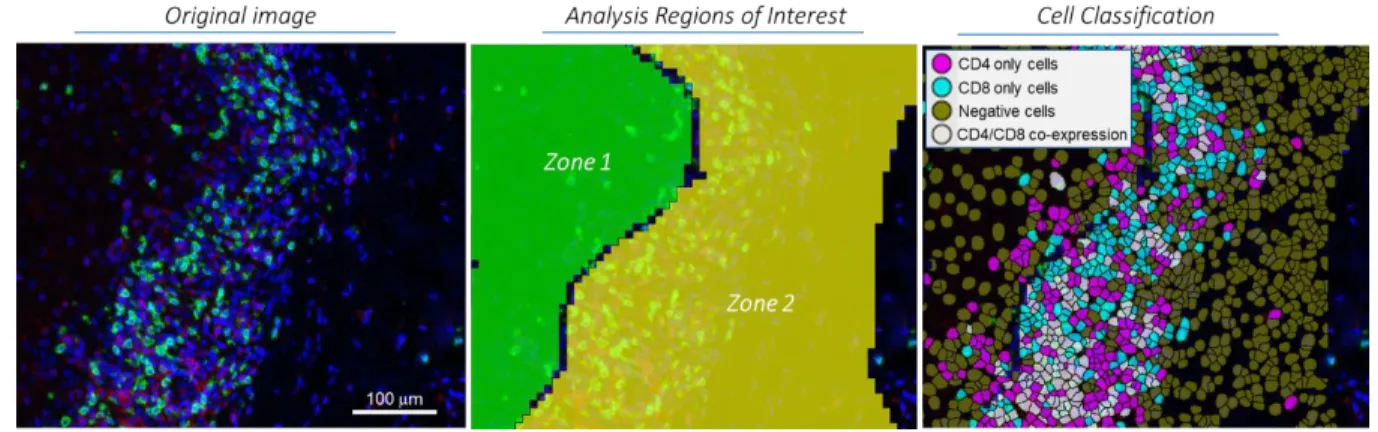
Figure 3. Graphic representation of the Zone analysis and cells classification made by the software
(Zone 1: Epithelium; Zone 2: Connective Tissue) ...16
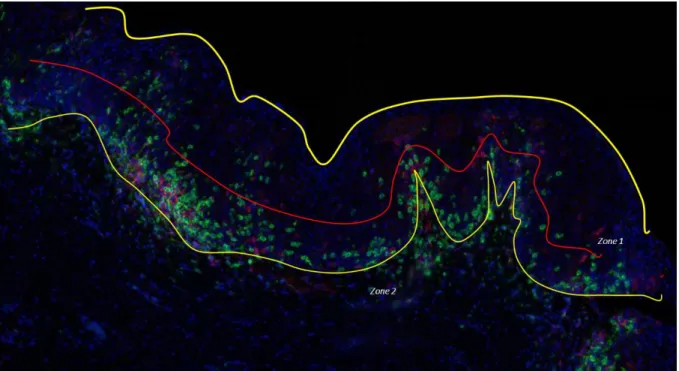
Figure 4. Example of analysis of distribution of CD8+ lymphocytes within epithelium or Zone 1.
The yellow lines mark the epithelial thickness and
the red line the approximate half of the zone analyzed. ...18
Figure 5. Graphic representation of averages of
percentages of cells counted by zone in all the specimens selected. ...20
Figure 6. Overlapping confidence intervals (95%) –
CD4+ and CD8+ cells infiltrating the epithelium (Layer 1) by group. ...23
Figure 7. Overlapping confidence Intervals (95%) – CD4+ and CD8+ cells underlying the epithelium
(connective tissue / Zone 2)...23
Figure 8. Distribution of CD4+ and CD8+ lymphocytes detected by IF/IHC.
Blue – Nuclei stained with Hoechst.
Red – CD4. Green – CD8. Note the scattered CD8+ lymphocytes
infiltrating the lower half of the epithelium (400x magnification). ...26
Figure 9. Presence of CD4+ lymphocytes mainly in the connective tissue
x
Figure 10. Hematoxylin and Eosin tissue section of a sample with
moderate to severe epithelial dysplasia. (Magnification 400X) ... 28
Figure 11. CD4+ and CD8+ cell infiltrate within Zone 1.
Yellow line highlights the epithelium-connective tissue interphase. ...29
Figure 12. Graphic representation of averages of percentages of cells present in
xi
LIST OF TABLES Table 1. Total number and ratio of CD4+ and
CD8+ lymphocytes by zone analyzed. ...19
Table 2. Confidence Intervals (median about percentiles)
calculated per zone analyzed. ...22
Table 3. Distribution of CD8+ cells in the Epithelium in
xii
LIST OF ABBREVIATIONS LP – Lichen planus
OED – Oral epithelial dysplasia
MHC – Major histocompatibility complex
NK cells – Natural killer cells
DNA - Deoxyribonucleic acid
SCC – Squamous cell carcinoma
PCNA – Proliferating cell nuclear antigen
IL – Interleukin
IFN – Interferon
TNF – Tumor necrosis factor
WHO – World Health Organization
LM – Lichenoid mucositis
IF – Immunofluorescence
IHC – Immunohistochemistry
CD4 – Cluster of differentiation 4
1
LITERATURE REVIEW
The oral cavity is lined by mucosa comprised of stratified squamous epithelium and supporting connective tissues. Clinical lesions in the oral mucosa often present as pathognomonic changes, such as geographic tongue or Fordyce granules. Frequently, however, and sometimes as non-specific areas of red, white, ulcerated mucosa, or combination of these that require pathologic examination for diagnosis. The majority of the time, lesions examined histologically by pathologists will exhibit enough features to reach a specific diagnosis. Occasionally, some lesions have similar histologic architectural alterations in the presence of inflammation of different etiologies such as trauma, allergic reactions, autoimmune diseases, and infectious diseases. Some lesions can also show a similar inflammatory response when undergoing malignant transformation. Lichen planus (LP) and oral epithelial dysplasia (OED) are entities with different etiology, treatment and prognosis, but sometimes they can share similar or overlapping histopathologic features as described above (1).
Oral Leukoplakia
Oral leukoplakia is a clinical term used to describe a mucosal lesion that exhibits a white surface that does not rub off and is not diagnosable clinically as a specific disease. Upon histological evaluation, these are usually diagnosed as either hyperkeratosis, epithelial dysplasia, squamous cell carcinoma (SCC), lichen planus, oral hairy leukoplakia, etc. Oral leukoplakia has a worldwide prevalence of 2%, which represents the most common “risk”
2
in the understanding of basic mechanisms involved in malignant transformation and substantial improvements in molecular diagnostics, there is no single marker or panel of markers available yet, that allow for reliable prediction of malignant transformation of leukoplakia for the individual patient. Therefore, it is recommended that all leukoplakias undergo histologic examination for final and precise diagnosis (1).
Biology of Oral Lichen Planus
The initial clinical description of lichen planus is generally attributed to Ferdinand Ritter
von Hebra, who in 1860 termed the condition “lichen ruber planus”(2). He is credited with the first scientific description of the disease on the skin. Lichen planus obtained its name because of the lacy white lines that bear a close resemblance to the symbiont, lichen, a composite organism consisting of a fungus and a photosynthetic partner living together in a symbiotic relationship, seen growing on rocks and trees. However, Ferdinand Ritter von Hebra used the term lichen to denote skin lesions which are characterized by a macular-papular skin eruption. Louis Wickham is acknowledged as the first to describe the characteristic, fine, white or grey lines known as Wickham striae or dots seen on the top of the pruritic papular rash of lichen planus of the skin. Wickham striae are also seen in oral LP. (3,4)
3
The antigen that serves as the trigger and/or driver of the immune responses seen in idiopathic oral lichen planus is unknown. It is likely to be an endogenous peptide or a protein sequence innate to the basal keratinocytes; therefore, LP can be characterized as an autoinflammatory condition(1). It is also likely that the supposed exogenous triggers for oral LP, such as dental materials, flavoring agents, certain drugs, viruses and even trauma serve to expose such self-antigens, or, alter the normal innate peptide sequences so that they are perceived by the immune-surveillance cells as being “foreign” or as antigenic targets(5,7). The immune responses to this, as yet, unidentified antigen develops in three stages: T-cell migration to the epithelium, T-cell activation, and induction of apoptosis of the basal keratinocytes.
T-Cell Migration into the Epithelium
Two hypotheses have been proposed to explain the migration of T-cells into the
epithelium. The “chance encounter” hypothesis suggests that normally circulating, antigen -specific CD8+ cytotoxic T-cells enter the epithelium for routine surveillance and by chance encounter the putative antigen when it is present in the epithelium (8,9). Alternatively, the keratinocytes direct the CD8+ cytotoxic cells to migrate into the epithelium by the release of
cytokines that allow the lymphocytes to “home-in” on the antigen-bearing basal keratinocyte,
the so called “direct migration” hypothesis (10). T-Cell Activation
4
lesions, helper CD4+ T-cells are also activated by antigens associated with Class II MHC presented by the antigen-presenting cells or Langerhans cells, or by the keratinocytes themselves, which are induced to present antigens on their Class II MHC sites (1,11,12). Langerhans cells are increased in number in oral LP lesions and also have up-regulated Class II MHC expressing Langerhans cells and keratinocytes which in turn promote CD4+ T-cell secretion of cytokines interleukin-2 (IL-2) and interferon-ϒ (IFN- ϒ) (9,13). These cytokines and probably others, together with the presentation of an antigen associated with MHC class I on basal keratinocytes, promote cytotoxic CD8+ T-cell induction of apoptosis in keratinocytes (14,15). Hence, it is likely that in oral LP there is a cycle of self-inducting and self-perpetuating T-lymphocyte activation.
Basal Keratinocyte Apoptosis
The apoptosis of the basal keratinocytes that characterizes all forms of LP, is mediated predominantly by hyperactive, cytotoxic CD8+ T-cells(16). It has been previously reported that in patients with cutaneous LP, the T-cells are usually more cytotoxic and active than T-cells present in non-lesional areas of the skin(17,18). Also, it has been shown that the most cytotoxic T-cell clones were CD8+ and the least cytotoxic were CD4+. This finding also indicates that the apoptosis of the basal keratinocytes so characteristic of cutaneous and oral LP is induced by the cytotoxic CD8+ T-lymphocytes activated by a putative basal keratinocyte antigen associated with the MHC class I(5,13,19).
The induction of keratinocyte apoptosis by CD8+ T-cells in LP and oral LP can occur by three established pathways:
1. T-cell secretion of tumor necrosis factor-alpha (TNF-) which binds TNF-α
receptor 1 on the keratinocyte surface.
5
the target cells. Fas-induced apoptosis by the perforin pathway are the two main mechanisms by which cytotoxic T-lymphocytes induce cell death in cells expressing foreign antigens.
3. Infusion of granzyme B by T cells into the keratinocytes. Granzymes are serine proteases that are released from cytoplasmic granules within cytotoxic T-cells and natural killer cells (NK cells). Granzyme B induces apoptosis within virus-infected cells. Cytotoxic T-cells release X perforin, a protein that attacks the target cells by forming a multimeric complex that enters cells through the mannose 6-phosphate receptor. Granzyme B is released to cause apoptosis by various pathways, including the cleaving of caspases (especially caspase-3), which in turn activates caspase-activated DNase and this enzyme degrades DNA, therefore inducing the apoptotic cascade culminating in cell death(6,10,13).
Malignant transformation of Oral Lichen Planus
6
A currently favored explanation for the transformation of oral LP into SCC is that the inflammatory infiltrate underlying the surface epithelium is affected by the release of cytokines associated with oxidative stress, which, in turn, activate transcription factors in the epithelial cells with premalignant potential (6,29). A variety of scenarios may lead to a clinical and histologic presentation of lichenoid mucositis (LM), including local or systemic allergy, immune-related disease including LP, chronic ulcerative stomatitis and dysplastic oral lesions (30). One point not yet determined is whether the proposed mechanism for transformation could be applied to all etiologies of lichenoid lesions or whether it applies only to classic/idiopathic oral LP (31). In the case of dysplastic oral lesions eliciting a lichenoid response, if this model is applicable, it would seem that the lichenoid response in an already premalignant lesion could exacerbate and accelerate the progression to SCC. To date, it is unclear whether oral LP is an independent risk factor for malignant transformation.
Numerous studies have also investigated various mechanisms involved in carcinogenesis including P53 mutation, PCNA mutation, loss of heterozygosity at the tumor suppressor gene loci, and cytogenetic abnormalities (32–35). None of the data shows convincing or consistent findings about the premalignant potential of oral lichen planus. The inflammatory infiltrate associated with oral lichen planus has been proposed to be a mechanism for malignant transformation (36). This proposal has some merits as other chronic inflammatory diseases have also been linked to cancerous transformation such as colon cancer in long-standing inflammatory bowel disease precipitated by intestinal microflora, and
Barret’s esophagitis (37). Conversely, other data suggests that inflammatory and immune systems may inhibit tumorigenesis (38).
7
subjacent to the basal keratinocytes (30,39,40). This inflammatory infiltrate may be there in an attempt to inhibit tumorigenesis progression.
Oral Lichen Planus vs Epithelial Dysplasia
Various disorders may present with clinical and histopathologic features similar to oral LP (41,42). Although oral epithelial dysplasia usually presents as a solitary lesion with variable proportions of white and red color change and ulceration, multifocal presentation is well recognized as seen, for example, in patients with advanced tobacco-related mucosal injury and proliferative verrucous leukoplakia (43).
Oral epithelial dysplasia is usually associated with a band-like chronic inflammatory cell infiltrate in the superficial lamina propria which, when viewed with low-magnification microscopy, may offer substantial histopathological mimicry of LP(29). In 1985, the term
“lichenoid dysplasia” was introduced to differentiate cases of epithelial dysplasia exhibiting lichenoid inflammation from oral lichen planus(44). This term was eventually discontinued and due to the ambiguity generated when rendering a straightforward diagnosis. Considerable clinical and histologic overlap has been found between LP and OED of the oral cavity, especially with the entity called proliferative verrucous leukoplakia, raising the question of whether the cases of oral LP that purportedly transform to SCC in fact represent undetected premalignant lesions with a nonspecific inflammatory response that mimics oral LP (37,45). The incidence of lichenoid features in OED and OSCC has been investigated by Fitzpatrick et al. (2014)(25), in which lichenoid features were found, at least focally, in 29% of 352 dysplasia or SCC cases. In the cases that showed lichenoid features, band-like inflammatory cell infiltration, of mostly lymphocytes, and basal keratinocyte degeneration were the most frequent features encountered, accounting for 74% and 30% of the lichenoid features, respectively(29).
8
identification of disturbance in the maturation pattern in cases of dysplasia, and their absence in LP(25). However, discrimination of mild epithelial dysplasia, with chronic interface mucositis, from LP, with reactive cellular atypia, can be challenging, requiring subjective assessment of ostensibly objective morphologic features(39,46). The WHO 2017 criteria do not address a way to distinguish or exclude OED from oral LP diagnosis(47).
Little has been written concerning the frequency of individual lichenoid characteristic in dysplastic lesions, although Krutchkoff and Eisenberg(44) argued that the presence of liquefactive degeneration of the basal membrane of the epithelium was rarely noted in dysplastic lesions and may serve to differentiate such lesions from non-dysplastic LM. Nonetheless, they also warned that this was not always the case and that the presence of atypical features should overrule any lichenoid feature that might be coincident (29).
Considerations about the Microscopic Diagnosis of Oral Epithelial Dysplasia
9
The diagnosis of epithelial dysplasia is often predicated on a combination of architectural and cellular abnormalities. Cellular abnormalities include proliferation of immature or atypical-appearing keratinocytes in the basal and parabasal areas of the oral epithelium as well as nuclear pleomorphism, high nuclear-to-cytoplasm ratio, increased mitotic activity, and hyperchromatism in individual cells (52). Architectural abnormalities include irregular epithelial stratification, elongated rete ridges extending into the submucosa (43), and loss of normal maturation, characterized by increased cellular density in the superficial epithelium, crowding of cells, and loss of polarity especially in the basal zone(30). The diagnostic dilemma between lichen planus and epithelial dysplasia appears to have more implications than the overlapping histopathologic features that can make the diagnosis difficult for the pathologist. Absence of broad consensus regarding the diagnostic criteria has been identified as the major obstacle to assuring the validity of studies investigating the potential of oral LP to undergo malignant transformation. This lack of diagnostic criteria becomes a problem for pathologists when evaluating cases with overlapping features between LP and OED, especially because the management of these condition is significantly different. A patient diagnosed with symptomatic LP will often be prescribed steroids or immunomodulators that will inhibit the inflammatory reaction targeting the superficial oral mucosa. In contrast, when a diagnosis of OED is made, a surgical resection of the lesion and close clinical follow-up is recommended as well as avoidance of topical steroids or other medications that may suppress the immunosurveillance of the area.
10
11
AIMS AND OBJECTIVES Objective
Identify the type and distribution of CD4+ and CD8+ T-cells in oral mucosa specimens to potentially distinguish underlying alterations or patterns between oral epithelial dysplasia and oral lichen planus.
Null Hypothesis: there are no statistical significant differences between the presence and distribution of subtypes of T-lymphocytes in the inflammatory response in oral lichen planus and epithelial dysplasia.
Alternate hypothesis: there are statistical significant differences between the presence and distribution of different subtypes of T-cells in the inflammatory response in oral lichen planus and epithelial dysplasia.
12
MATERIALS AND METHODS
This study protocol was registered, reviewed and approved by the University of North Carolina at Chapel Hill Institutional Review Board under the number 16-5988. All study procedures were performed in accordance with the Declaration of Helsinki and Research Committee Regulations. The study was designed as a pilot retrospective study. The population or sample consisted of archival tissue samples from the UNC Oral and Maxillofacial Pathology Laboratory. For this pilot study, 5 cases of each group were selected for testing. Specimen Selection
Oral tissue samples received between July 1, 2005 to January 31, 2016, at the UNC at Chapel Hill Oral and Maxillofacial Pathology Laboratory that were diagnosed with Oral Lichen Planus or Epithelial Dysplasia were collected. A third group of specimens was selected composed of equivocal cases those with overlapping features between LP and OED (Figure 1). Biopsy accession files and medical records from samples were reviewed for case selection.
13 Inclusion and Exclusion Criteria
Inclusion Criteria:
For inclusion in the study, the specimens selected met the following criteria:
1. Cases had sufficient tissue for additional analysis.
2. Lichen planus samples were from the buccal mucosa only.
3. Epithelial dysplasia samples were from tongue, buccal mucosa or floor of mouth:
i. Moderate to severe epithelial dysplasia: cytological and architectural premalignant changes limited to the lower two thirds of the total thickness of the epithelium.
ii. A lichenoid inflammatory reaction in the upper connective tissue. 4. Equivocal cases with overlapping features, were from buccal mucosa and lateral tongue.
5. Samples were from subjects over 21 years of age.
Exclusion Criteria:
Any of the following was regarded as a criterion for exclusion from the study:
1. Tissue samples from subjects with previous history of cancer of any type.
2. Patients with documented prior history of treatment with steroids prior to the biopsy date
3. History of underlying immunosuppression from any cause. 4. Subjects under 21 years of age
14 Data Collection and Processing
The hematoxylin and eosin slides were reviewed and the diagnosis confirmed by two board-certified oral and maxillofacial pathologists (RP, VM). After the final case selection, the paraffin blocks were selected and two unstained slides sectioned for immunofluorescence (IF) and immunohistochemistry (IHC) studies.
Study Procedures
Dual IF was carried out on the Bond fully-automated slide staining system (Leica Microsystems Inc., Norwell MA). CD4 and CD8 antibodies (catalog numbers NCL-L-CD4-368 and NCL-L-CD8-4B11, respectively) were purchased from Leica Biosystems. Slides were deparaffinized in Bond dewax solution (AR9222), hydrated in Bond wash solution (AR9590) and sequentially stained for CD4 and CD8. Specifically, antigen retrieval for CD4 was performed for 20 min at 1000C in Bond-epitope retrieval solution 2 pH 9.0 (AR9640). After
pretreatment, slides were incubated for 30 min with CD4 antibody (1:200) followed with Bond polymer (DS9390) and TSA Cy5 (PerkinElmer, Boston, MA). After completion of CD4 staining, a second round of antigen retrieval was performed for 10 min at 1000C in Bond-epitope
retrieval solution 2 pH 9.0. Slides were then incubated with the CD8 antibody (1:200, 30 min) which was detected with Alexa488 labeled goat anti-mouse secondary antibody (Invitrogen, Carlsbad, CA). Nuclei were stained with Hoechst 33258 (Invitrogen, Carlsbad, CA). The stained slides were mounted with ProLong Gold antifade reagent (Molecular Probes, Inc. Eugene, OR 97402).
Analysis of IF Images:
15
Figure 2. Example of annotations made on IF/IHC slides.
For all eSlides, Aperio ImageScope (Aperio ImageScope Version 12.3.2.8013; Leica Biosystems, Wetzlar, Germany) software was used to highlight two regions named Epithelium or Zone 1 and Connective Tissue or Layer 2. Images were annotated by the investigators based on H&E staining (Figure 2). The criteria utilized for the annotation regions were as follows:
1. The epithelial section was outlined following the contour of the basement membrane, involving all the layers of the epithelium and including inflammatory cells infiltrating through the basement membrane, extending to the surface of the stratum corneum. 2. The connective tissue section involved included encircling the area immediately
subjacent to the basement membrane.
3. Any cells with double expression for CD4 and CD8 were excluded from analysis.
16
regions. Briefly, nuclei were digitally detected by the presence of Hoechst stain (nuclear counterstain). From these nuclei, a cell simulation was performed – cell margins were grown out from nuclear boundaries (Figure 3). For this data set, positivity thresholds for CD4 and CD8 were determined by measuring the average staining intensities both inside and outside simulated cells. Measurements were made from a total of six regions from an algorithm training set that contained three of the sixteen images (15 cases of all three groups and control). The training set images were chosen to encompass the full range of staining intensities present in the entire analysis data set (images with high, medium, low or negative staining for CD4 and CD8). Once thresholds were set, the algorithm evaluated each cell individually for the presence of CD4 and CD8. Cells that were negative for both markers or positive for CD4, CD8 and both CD4 and CD8 were enumerated by the algorithm. Microsoft Excel 2013 was used to determine the percentage of cells that co-express each marker.
Figure 3. Graphic representation of the region analysis and cells classification made by the software (Zone 1: Epithelium; Zone 2: Connective Tissue)
Formula’s for Co-Expression Percentage Determinations: % of CD4+ cells = (# CD4+ cells/Total cells) *100
% of CD8+ cells = (# CD8+ cells/Total cells) *100
17
% CD8+ cells that co-express CD4 = (# of cells that co-express CD4 and CD8/#CD8+ cells)*100
Data Analysis
A statistical software package (IBM Corp. Released 2013. IBM SPSS Statistics for Windows, Version 22.0. Armonk, NY: IBM Corp) was used to calculate confidence intervals (CI) in order to stablish an estimated difference between cell populations by layer analyzed.
Statistical Analysis
Confidence intervals and power statistical analysis were conducted on the preliminary data to establish significant different and the necessary sample to stablish a statistical significant difference. All data was entered into SPSS software (IBM Corp. Released 2013. IBM SPSS Statistics for Windows, Version 22.0. Armonk, NY: IBM Corp). Mean, standard deviation and 95% confidence intervals were computed for all continuous variables.
Analysis of the Distribution of CD8+ T-cells in Lichen Planus vs Epithelial Dysplasia
18
Figure 4. Example of analysis of distribution of CD8+ lymphocytes within epithelium or Zone 1. The yellow lines mark the epithelial thickness and the red line the approximate half of the region analyzed.
The investigator then separated all the specimens with the following criteria:
1. All the tissue sections with the majority of CD8+ cells concentrated in the basal layer of the epithelium were classified as Group A.
2. The specimens with the majority of CD8+ cells scattered through the thickness of the epithelium, and mostly found in the upper half the Zone 1 were classified as Group B.
19 RESULTS Baseline Characteristics
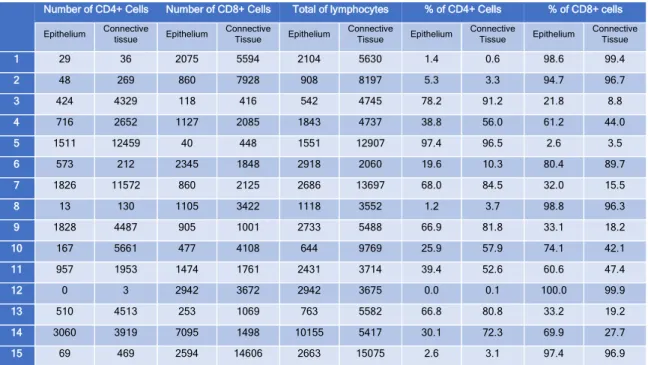
The total number of cells and ratio of CD4+ and CD8+ T-cells by category in all tissue sections are summarized in Table 1. All the cells that the software identified on IHC and IF as double positive for CD4 and CD8 antibodies were excluded from the analysis to prevent false positive due to overlapping positivity of adjacent cells. Although the presence of double positive CD4/CD8 T-cells in internal organs and peripheral tissue has been reported, flow cytometry seems to be the best way to identify them (53). Also, the published data is still controversial and currently little is known about their function and development.
Number of CD4+ Cells Number of CD8+ Cells Total of lymphocytes % of CD4+ Cells % of CD8+ cells
Epithelium Connective
tissue Epithelium
Connective
Tissue Epithelium
Connective
Tissue Epithelium
Connective
Tissue Epithelium
Connective Tissue
1 29 36 2075 5594 2104 5630 1.4 0.6 98.6 99.4
2 48 269 860 7928 908 8197 5.3 3.3 94.7 96.7
3 424 4329 118 416 542 4745 78.2 91.2 21.8 8.8
4 716 2652 1127 2085 1843 4737 38.8 56.0 61.2 44.0
5 1511 12459 40 448 1551 12907 97.4 96.5 2.6 3.5
6 573 212 2345 1848 2918 2060 19.6 10.3 80.4 89.7
7 1826 11572 860 2125 2686 13697 68.0 84.5 32.0 15.5
8 13 130 1105 3422 1118 3552 1.2 3.7 98.8 96.3
9 1828 4487 905 1001 2733 5488 66.9 81.8 33.1 18.2
10 167 5661 477 4108 644 9769 25.9 57.9 74.1 42.1
11 957 1953 1474 1761 2431 3714 39.4 52.6 60.6 47.4
12 0 3 2942 3672 2942 3675 0.0 0.1 100.0 99.9
13 510 4513 253 1069 763 5582 66.8 80.8 33.2 19.2
14 3060 3919 7095 1498 10155 5417 30.1 72.3 69.9 27.7
15 69 469 2594 14606 2663 15075 2.6 3.1 97.4 96.9
Table 1. Total number and ratio of CD4+ and CD8+ lymphocytes by zone analyzed.
20
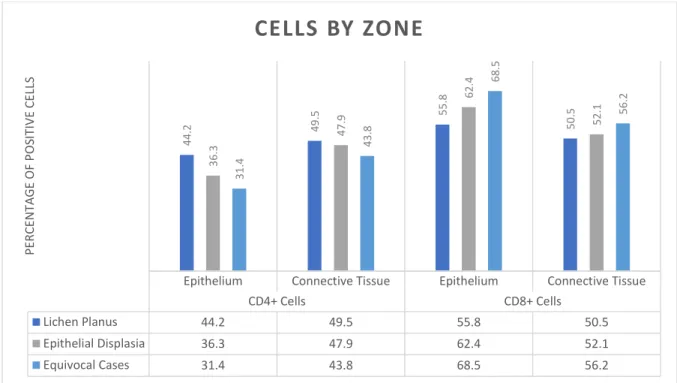
Figure 5. Graphic representation of averages of percentages of cells counted by zone in all the specimens selected.
CD4+/CD8+ Ratio in Oral Lichen Planus Zone 1:
The average number of CD4+ cells infiltrating the epithelium in all cases of LP was 545.6 cells, representing 44.2% of all CD4+ and CD8+ cells quantified in Zone 1. The average number of CD8+ cells was 844, accounting for 55.8%. The average ratio of CD4+/CD8+ cells infiltrating the epithelium in all cases of confirmed LP was 2:3 respectively.
Zone 2:
Regarding the cells present in the lichenoid infiltrate in Zone 2, the average amount of CD4+ cells in the connective tissue was 3949, accounting for 49.5% of all purely positive CD4+/CD8+ cells quantified. The average amount of CD8+ cells was 3294.2 representing 50.5% of cells quantified. The ratio of CD4+/CD8+ cells in the Zone 2 was 1:2 respectively. CD4+/CD8+ Ratio in Epithelial Dysplasia
Zone 1:
Epithelium Connective Tissue Epithelium Connective Tissue
CD4+ Cells CD8+ Cells
Lichen Planus 44.2 49.5 55.8 50.5
Epithelial Displasia 36.3 47.9 62.4 52.1
Equivocal Cases 31.4 43.8 68.5 56.2
44.2 49.5 55.8 50.5 36.3 47.9 62.4 52.1 31.4 43.8 68.5 56.2 PE R CE N TA G E O F P O SIT IV E CE LL S
21
The average amount of CD4+ T-lymphocytes encountered in all cases with confirmed moderate to severe epithelial dysplasia was 881.4 which represents 36.3% of all cells. The average of CD8+ cells was 1138.4, accounting for 62.4%. This constitutes a CD4+/CD8+ ratio of 1:2 respectively.
Zone 2:
The average of CD4+ T-lymphocytes present in the underlying lichenoid infiltrate in all confirmed OED was 4412.4 which represents 62.4% of all immunoreactive T-cells. The CD8+ cell average in Zone 2 was 2500.8 which represents a 52.1% of all CD4+/CD8+ cells, resulting in a 2:1 ratio.
Statistical Analysis
For the most part, the CD4+/CD8+ T-cell ratio was very similar for both oral lichen planus and epithelial dysplasia. However, a slight increase of cytotoxic CD8+ T-cells was encountered in Zone 1 and 2 in the OED group.
Power Analysis:
With the use of a statistical software package (IBM Corp. Released 2013. IBM SPSS Statistics for Windows, Version 22.0. Armonk, NY: IBM Corp), statistical power was calculated to detect the significance that could be achieved for the given sample size, and plausible population parameters for the statistical model judged appropriate for the research questions. The standard deviation of CD4+ cells found infiltrating Zone 1 for the combination of LP and OED groups, was 739.4; for CD8+ cells was 764.3. It was calculated that a sample size of 76 specimens would be necessary to significantly demonstrate a difference in the increase of CD8+ cells infiltrating and underlying epithelial dysplasia when compared to lichen planus confirmed specimens.
22 Confidence Intervals:
Confidence intervals (CI) were performed to identify a plausible range of the true population value by accounting for distributional assumptions. Confidence level was set at 95%. Medians about percentiles per zone analyzed can be seen in Table II.
Quantiles
CD4+ T-cells
Lichen Planus - Zone 1 (Epithelium)
Level Quantile 95% Confidence Limits Distribution Free
50% Median 424 29 1511
Lichen Planus - Zone 2 (Connective Tissue)
50% Median 2652 36 12459
Epithelial Dysplasia - Zone 1 (Epithelium)
50% Median 573 13 1828
Epithelial Dysplasia - Zone 2 (Connective Tissue)
50% Median 4487 130 11572
CD8+ T-cells
Lichen Planus - Zone 1 (Epithelium)
Level Quantile 95% Confidence Limits Distribution Free
50% Median 860 40 2075
Lichen Planus - Zone 2 (Connective Tissue)
50% Median 2085 416 7928
Epithelial Dysplasia - Zone 1 (Epithelium)
50% Median 905 477 2345
Epithelial Dysplasia - Zone 2 (Connective Tissue)
50% Median 2125 1001 4108
Table 2. Confidence Intervals (median about percentiles) calculated per zone analyzed.
Confidence Intervals in Lichen Planus vs Epithelial Dysplasia in Zone 1
23
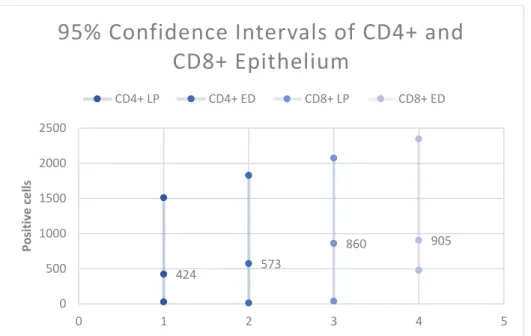
Figure 6. Overlapping confidence intervals (95%) – CD4+ and CD8+ cells infiltrating the epithelium (Zone 1) by group.
Confidence Intervals in the Lichen Planus vs Epithelial Dysplasia in Zone 2
Figure 7. Overlapping confidence Intervals (95%) – CD4+ and CD8+ cells underlying the epithelium (connective tissue / Zone 2).
424 573 860 905 0 500 1000 1500 2000 2500
0 1 2 3 4 5
Po si ti ve c e lls
95% Confidence Intervals of CD4+ and
CD8+ Epithelium
CD4+ LP CD4+ ED CD8+ LP CD8+ ED
2652 4487 2085 2125 0 2000 4000 6000 8000 10000 12000 14000
0 0.5 1 1.5 2 2.5 3 3.5 4 4.5
Po si ti ve C e lls
95% Confidence Inte CD4+ and CD8+
Connective Tissue
24
Analysis of the Distribution of CD8+ T-cells in Lichen Planus vs Epithelial Dysplasia
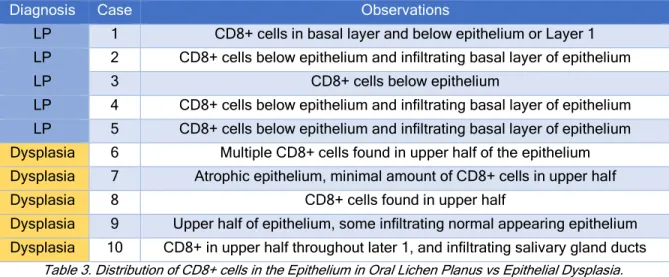
The full results of the morphological distribution of CD8+ cells are summarized in table 3. The biggest difference in the comparison of oral lichen planus with epithelial dysplasia was the pattern of infiltration of CD8+ cells.
Diagnosis Case Observations
LP 1 CD8+ cells in basal layer and below epithelium or Layer 1 LP 2 CD8+ cells below epithelium and infiltrating basal layer of epithelium
LP 3 CD8+ cells below epithelium
LP 4 CD8+ cells below epithelium and infiltrating basal layer of epithelium LP 5 CD8+ cells below epithelium and infiltrating basal layer of epithelium Dysplasia 6 Multiple CD8+ cells found in upper half of the epithelium Dysplasia 7 Atrophic epithelium, minimal amount of CD8+ cells in upper half
Dysplasia 8 CD8+ cells found in upper half
Dysplasia 9 Upper half of epithelium, some infiltrating normal appearing epithelium Dysplasia 10 CD8+ in upper half throughout later 1, and infiltrating salivary gland ducts
Table 3. Distribution of CD8+ cells in the Epithelium in Oral Lichen Planus vs Epithelial Dysplasia.
25 DISCUSSION
This study attempted to evaluate the population of T-cells comprising the inflammatory lichenoid infiltrate underlying the epithelium in oral lichen planus and epithelial dysplasia, specifically regarding the quantity and distribution of two major subtypes of lymphocytes. Phenotype of Inflammatory Cells in Oral Lichen Planus
26
Figure 8. Distribution of CD4+ and CD8+ lymphocytes detected by IF/IHC. Blue – Nuclei stained with Hoechst. Red – CD4. Green – CD8. Note the scattered CD8+ lymphocytes infiltrating the lower half of the epithelium (400x
magnification).
Figure 9. Presence of CD4+ lymphocytes mainly in the connective tissue and basal membrane some. Red – CD4+ cells (400x magnification).
27
planus, were associated with basal epithelial cells undergoing apoptosis(13,15). It has been also described, that the presence of activated CD8+ cells expressing human leukocytic antigen surface antigen, is detected not only close to damaged epithelial cells but also to the basement membrane and epithelial areas of erosion (55). No significant differences in the ratio of CD4+/CD8+ (2:3) in the infiltrating and underlying t-lymphocytes were encountered in the present study.
The trigger for keratinocyte apoptosis in oral lichen planus is unknown. However, the localization of CD8+ cells can be explained by the previously mentioned studies and by Sugerman et al. (2000), who reported that CD8+ lesional cells recognize antigen associated MHC class I on lesional keratinocytes. Following antigen recognition and activation, CD8+ cytotoxic T-cells trigger keratinocyte apoptosis, resulting in the clinical and histological appearance of LP (16).
28
Figure 10. Hematoxylin and Eosin tissue section of a sample with moderate to severe epithelial dysplasia. (Magnification 400X)
29
Figure 11. CD4+ and CD8+ cell infiltrate within Zone 1. Yellow line highlights the epithelium-connective tissue interphase.
30
Figure 12. Graphic representation of averages of percentages of cells present in Layer 1 and 2 of oral lichen planus vs dysplasia.
An important change can be appreciated in the date for premalignant lesions where the CD4+/CD8+ cell ratio changes from the position of CD8+ lymphocytes. It is already known CD4+/CD8+ cell infiltrate is significantly higher in moderate to severe dysplasia in comparison with benign lesions and in SCC (9,40). This can be explained by the relationship between immunosurveillance and tumor progression, in which carcinogenesis results from crosstalk of cancer-cell-intrinsic factors and host immune system or “cell-intrinsic” effects(57). Hirota et al. (1990), also demonstrated an increased number of T-helper cells over T-cytotoxic cells within the T-cell subpopulation of oral SCC lesions. The above suggests an overall switching of the immune response in favor of pro-tumor immunity dominated by a CD4+ cell population that might help in tumor initiation and progression as suggested by Strauss et al. (2007). Further studies need to be conducted to identify the subpopulations of CD4+ cells that are directly responsible for such increase in the CD8+ population.
There was no statistically significant difference between the numbers of cells encountered in the different zones analyzed in our study. This indicates that the CD4+/CD8+ T-cell ratio is similar between both lesions and, therefore cannot be used to differentiate them.
Epithelium Connective Tissue Epithelium Connective Tissue
CD4+ Cells CD8+ Cells
Lichen Planus 44.2 49.5 55.8 50.5
Epithelial Displasia 36.3 47.9 62.4 52.1
44.2 49.5 55.8 50.5 36.3 47.9 62.4 52.1 PE R CE N TA G E O F P O SIT IV E CE LL S
31
However, the localization of CD8+ cells infiltrating the epithelium can be useful in differentiating these dysplastic lesions with lichenoid features and LP.
In our study, in all the cases with moderate to severe epithelial dysplasia, a striking population of CD8+ lymphocytes were found following the dysplastic changes in the epithelial zone. Since cytotoxic CD8+ cells will try to eliminate the cells undergoing malignant transformation within the epithelial layer, it makes sense that in moderate to severe OED, these types of inflammatory cells follow the malignant changes throughout the thickness of this morphological and cytological changes within the tissue. For this reason, the localization of CD8+ cells could be used to differentiate OED and LP in equivocal cases. Of course, more proven cases are necessary, along with clinical follow-up of the patient’s progression to
32
CONCLUSIONS
The inflammatory component of the oral cavity is a complex system that, at this point in time, is still not well understood, especially with respect to potentially premalignant mucosal lesions. The diagnostic dilemma addressed in this study may be eventually solved by identifying cells with specific functions within the inflammatory population that can be used to track early malignant changes within the mucosal epithelium. However, there is no specific marker or panel of markers available yet that allow reliable prediction of malignant transformation of leukoplakia in the oral cavity. Further studies regarding specific subtypes of CD4+ and CD8+ T-cells are necessary to distinguish between OLP and OED and reliably predict the malignant transformation of OED and those equivocal cases previously mentioned.
33
BIBLIOGRAPHY
1. Cheng Y-SL, Gould A, Kurago Z, Fantasia J, Muller S. Diagnosis of oral lichen planus: a position paper of the American Academy of Oral and Maxillofacial Pathology. Oral Surg Oral Med Oral Pathol Oral Radiol. 2016 Sep;122(3):332–354.
2. Wilson E. On lichen planus: the lichen ruber of hebra. BMJ. 1866 Oct 13;2(302):399–
402.
3. Schifter M, L. S, Li J. Oral Lichen Planus. In: Fernando S, editor. Skin Biopsy - Diagnosis and Treatment. InTech; 2013.
4. Steffen C, Dupree ML. Louis-Frédéric Wickham and the Wickham’s striae of lichen
planus. Skinmed. 2004 Oct;3(5):287–289.
5. Georgakopoulou EA, Achtari MD, Achtaris M, Foukas PG, Kotsinas A. Oral lichen planus as a preneoplastic inflammatory model. J Biomed Biotechnol. 2012 May 17;2012:759626.
6. Kurago ZB. Etiology and pathogenesis of oral lichen planus: an overview. Oral Surg Oral Med Oral Pathol Oral Radiol. 2016 Jul;122(1):72–80.
7. Hasséus B, Jontell M, Brune M, Johansson P, Dahlgren UI. Langerhans cells and T cells in oral graft versus host disease and oral lichen planus. Scand J Immunol. 2001 Nov;54(5):516–524.
8. Okiyama N, Katz SI. Programmed cell death 1 (PD-1) regulates the effector function of CD8 T cells via PD-L1 expressed on target keratinocytes. J Autoimmun. 2014
Sep;53:1–9.
9. Öhman J, Magnusson B, Telemo E, Jontell M, Hasséus B. Langerhans cells and T cells sense cell dysplasia in oral leukoplakias and oral squamous cell carcinomas--evidence for immunosurveillance. Scand J Immunol. 2012 Jul;76(1):39–48.
10. Firth FA, Friedlander LT, Parachuru VPB, Kardos TB, Seymour GJ, Rich AM. Regulation of immune cells in oral lichen planus. Arch Dermatol Res. 2015 May;307(4):333–339.
11. Matsuzaki J, Tsuji T, Luescher IF, Shiku H, Mineno J, Okamoto S, et al. Direct tumor recognition by a human CD4(+) T-cell subset potently mediates tumor growth inhibition and orchestrates anti-tumor immune responses. Sci Rep. 2015 Oct 8;5:14896.
12. Kim H-J, Cantor H. CD4 T-cell subsets and tumor immunity: the helpful and the not-so-helpful. Cancer Immunol Res. 2014 Feb;2(2):91–98.
13. Khan A, Farah CS, Savage NW, Walsh LJ, Harbrow DJ, Sugerman PB. Th1 cytokines in oral lichen planus. J Oral Pathol Med. 2003 Feb;32(2):77–83.
14. Zhang L, Michelsen C, Cheng X, Zeng T, Priddy R, Rosin MP. Molecular analysis of oral lichen planus. A premalignant lesion? Am J Pathol. 1997 Aug;151(2):323–327. 15. Mattila R, Rautava J, Syrjänen S. Human papillomavirus in oral atrophic lichen planus
34
16. Sugerman PB, Savage NW, Zhou X, Walsh LJ, Bigby M. Oral lichen planus. Clin Dermatol. 2000 Oct;18(5):533–539.
17. Lage D, Juliano PB, Metze K, de Souza EM, Cintra ML. Lichen planus and lichenoid drug-induced eruption: a histological and immunohistochemical study. Int J Dermatol. 2012 Oct 1;51(10):1199–1205.
18. Tetzlaff MT, Nagarajan P, Chon S, Huen A, Diab A, Omar P, et al. Lichenoid dermatologic toxicity from immune checkpoint blockade therapy: A detailed examination of the clinicopathologic features. Am J Dermatopathol. 2017 Feb;39(2):121–129.
19. Collins LK, Chapman MS, Carter JB, Samie FH. Cutaneous adverse effects of the immune checkpoint inhibitors. Curr Probl Cancer. 2016 Dec 14;0(0).
20. Yang Q, Xu B, Sun H, Wang X, Zhang J, Yu X, et al. A genome-wide association scan of biological processes involved in oral lichen planus and oral squamous cell
carcinoma. Medicine. 2017 Jun;96(25):e7012.
21. Ruokonen HMA, Juurikivi A, Kauppila T, Heikkinen AM, Seppänen-Kaijansinkko R. High percentage of oral lichen planus and lichenoid lesion in oral squamous cell carcinomas. Acta Odontol Scand. 2017 Aug;75(6):442–445.
22. Krutchkoff DJ, Cutler L, Laskowski S. Oral lichen planus: the evidence regarding potential malignant transformation. J Oral Pathol. 1978 Feb;7(1):1–7.
23. Midana A, Depaoli M. [Incidence of malignant neoplasia on sclerous-bullous lichen lesions]. Minerva Dermatol. 1967 Sep;42(9):447–450.
24. Andreasen JO, Pindborg JJ. [Development of cancer in oral lichen planus. A review of the literature]. Nord Med. 1963 Aug 1;70:861–866.
25. Fitzpatrick SG, Hirsch SA, Gordon SC. The malignant transformation of oral lichen planus and oral lichenoid lesions: a systematic review. J Am Dent Assoc. 2014 Jan;145(1):45–56.
26. Mignogna MD, Lo Russo L, Fedele S, Ruoppo E, Califano L, Lo Muzio L. Clinical behaviour of malignant transforming oral lichen planus. Eur J Surg Oncol. 2002 Dec;28(8):838–843.
27. Kim J, Yook JI, Lee EH, Ryu MH, Yoon JH, Hong JC, et al. Evaluation of premalignant potential in oral lichen planus using interphase cytogenetics. J Oral Pathol Med. 2001 Feb;30(2):65–72.
28. Peng Q, Zhang J, Ye X, Zhou G. Tumor-like microenvironment in oral lichen planus: evidence of malignant transformation? Expert Rev Clin Immunol. 2017 Jun;13(6):635–
643.
35
30. Müller S. Oral lichenoid lesions: distinguishing the benign from the deadly. Mod Pathol. 2017 Jan;30(s1):S54–S67.
31. Al-Hashimi I, Schifter M, Lockhart PB, Wray D, Brennan M, Migliorati CA, et al. Oral lichen planus and oral lichenoid lesions: diagnostic and therapeutic considerations. Oral Surg Oral Med Oral Pathol Oral Radiol Endod. 2007 Mar;103 Suppl:S25.e1–12. 32. Asarch A, Gottlieb AB, Lee J, Masterpol KS, Scheinman PL, Stadecker MJ, et al.
Lichen planus-like eruptions: an emerging side effect of tumor necrosis factor-alpha antagonists. J Am Acad Dermatol. 2009 Jul;61(1):104–111.
33. Hadzi-Mihailovic M, Petrovic R, Raybaud H, Stanimirovic D, Ozar Koray M. Expression and role of p53 in oral lichen planus patients. J BUON. 2017 Oct;22(5):1278–1286. 34. Gomes CC, Fonseca-Silva T, Gomez RS. Evidence for loss of heterozygosity (LOH) at
chromosomes 9p and 17p in oral granular cell tumors: a pilot study. Oral Surg Oral Med Oral Pathol Oral Radiol. 2013 Feb;115(2):249–253.
35. Coltrera MD, Zarbo RJ, Sakr WA, Gown AM. Markers for dysplasia of the upper aerodigestive tract. Suprabasal expression of PCNA, p53, and CK19 in alcohol-fixed, embedded tissue. Am J Pathol. 1992 Oct;141(4):817–825.
36. Olson MA, Rogers RS, Bruce AJ. Oral lichen planus. Clin Dermatol. 2016 Aug;34(4):495–504.
37. Katsanos KH, Roda G, Brygo A, Delaporte E, Colombel J-F. Oral cancer and oral precancerous lesions in inflammatory bowel diseases: A systematic review. J Crohns Colitis. 2015 Nov;9(11):1043–1052.
38. Vasovic M, Gajovic N, Brajkovic D, Jovanovic M, Zdravkovaic N, Kanjevac T. The relationship between the immune system and oral manifestations of inflammatory bowel disease: a review. Central-European journal of immunology / Polish Society for Immunology and eleven other Central-European immunological societies. 2016 Oct 25;41(3):302–310.
39. Czerninski R, Zeituni S, Maly A, Basile J. Clinical characteristics of lichen and
dysplasia vs lichen planus cases and dysplasia cases. Oral Dis. 2015 May;21(4):478–
482.
40. Gannot G, Gannot I, Vered H, Buchner A, Keisari Y. Increase in immune cell infiltration with progression of oral epithelium from hyperkeratosis to dysplasia and carcinoma. Br J Cancer. 2002 May 6;86(9):1444–1448.
41. Au J, Patel D, Campbell JH. Oral lichen planus. Oral Maxillofac Surg Clin North Am. 2013 Feb;25(1):93–100, vii.
42. Alves MGO, Balducci I, Carvalho YR, Nunes FD, Almeida JD. Oral lichen planus: a histopathological study. Histopathology. 2015 Feb;66(3):463–464.
36
44. Krutchkoff DJ, Eisenberg E. Lichenoid dysplasia: a distinct histopathologic entity. Oral Surg Oral Med Oral Pathol. 1985 Sep;60(3):308–315.
45. Dost F, Lê Cao K, Ford PJ, Ades C, Farah CS. Malignant transformation of oral epithelial dysplasia: a real-world evaluation of histopathologic grading. Oral Surg Oral Med Oral Pathol Oral Radiol. 2014 Mar;117(3):343–352.
46. Villa A, Gohel A. Oral potentially malignant disorders in a large dental population. J Appl Oral Sci. 2014 Dec;22(6):473–476.
47. Müller S. Update from the 4th Edition of the World Health Organization of Head and Neck Tumours: Tumours of the Oral Cavity and Mobile Tongue. Head Neck Pathol. 2017 Mar;11(1):33–40.
48. Fernandes JV, Cobucci RNO, Jatobá CAN, Fernandes TAA de M, de Azevedo JWV, de Araújo JMG. The role of the mediators of inflammation in cancer development. Pathol Oncol Res. 2015 Jul;21(3):527–534.
49. Perez-Ordoñez B, Beauchemin M, Jordan RCK. Molecular biology of squamous cell carcinoma of the head and neck. J Clin Pathol. 2006 May;59(5):445–453.
50. Polo V, Pasello G, Frega S, Favaretto A, Koussis H, Conte P, et al. Squamous cell carcinomas of the lung and of the head and neck: new insights on molecular characterization. Oncotarget. 2016 May 3;7(18):25050–25063.
51. Pu Y, Wang Y, Huang X, Chen S, Wang Z, Sun G, et al. The influence of mild
dysplasia at the surgical margin on the prognosis of oral squamous cell carcinoma. Int J Oral Maxillofac Surg. 2016 Nov;45(11):1372–1377.
52. Wilder EG, Frieder J, Sulhan S, Michel P, Cizenski JD, Wright JM, et al. Spectrum of orocutaneous disease associations: Genodermatoses and inflammatory conditions. J Am Acad Dermatol. 2017 Nov;77(5):809–830.
53. Overgaard NH, Jung J-W, Steptoe RJ, Wells JW. CD4+/CD8+ double-positive T cells: more than just a developmental stage? J Leukoc Biol. 2015 Jan;97(1):31–38.
54. Payeras MR, Cherubini K, Figueiredo MA, Salum FG. Oral lichen planus: focus on etiopathogenesis. Arch Oral Biol. 2013 Sep;58(9):1057–1069.
55. Kilpi AM. Activation marker analysis of mononuclear cell infiltrates of oral lichen planus in situ. Scand J Dent Res. 1987 Apr;95(2):174–180.
56. Speight PM. Update on oral epithelial dysplasia and progression to cancer. Head Neck Pathol. 2007 Sep;1(1):61–66.
57. Zitvogel L, Tesniere A, Kroemer G. Cancer despite immunosurveillance: