Asian Journal of Pharmaceutical Research and Development Vol. 3 (5) Sept – Oct. 2015:1-8
Asian Journal of Pharmaceutical Research and Development
(An International Peer-Reviewed Journal of Pharmaceutical Research and Development)
www.ajprd.com
ISSN 2320-4850
Research Article
“ANALYTICAL METHOD DEVELOPMENT AND VALIDATION
OF CAPECITABINE FROM TABLET DOSAGE FORM BY USING
RP-HPLC”
Rohit A. Patil 1, Dr. Rajendra C. Doijad 2, Pravin D.Lade3, Pournima S.
Sankpal4
Shree Santkrupa College of Pharmacy, Ghogaon, Karad- 415111(M.S.) India
Received: May 2015 Revised and Accepted: September2015
ABSTRACT
A simple, precise and accurate RP-HPLC method was developed and validated for rapid assay of Capecitabine in tablet dosage form by using a mobile phase consisting mixture of Methanol: Water in the ratio (85:15 % v/v) at the flow rate of 1 mL/min. Symmetry Chromosil C-18 (4.6×250mm), was used as stationary phase. The UV detection wavelength was 303 nm
and 10µl sample was injected. The retention time for Capecitabine was 4.2 min. The percentage RSD for precision and
accuracy of the method was found to be less than 2%. The method was validated as per the ICH guidelines. The method was successfully applied for routine analysis of Capecitabine in tablet dosage form.
Key words: Capecitabine, RP-HPLC Method.
INTRODUCTION:
Analytical technique play important role in maintaining and assuring the quality of substance and are critical components of quality assurance and quality control. In general terms pharmaceutical analysis comprises, those procedures necessary to determine the identity, strength, quality and purity of drugs and chemicals.
Capecitabine (CAP) [N4-pentoxycarbonyl- 5-deoxy-5-fluorocytidine] is an anticancer prodrug of 5-fluorouracil (5-FU) that was designed to undergo preferential conversion to 5-FU within tumors (1-3). 5-FU has also been widely used as an anticancer agent in the chemotherapy of solid tumors but its efficacy is limited by dihydropyrimidine dehydrogenase catalyzed formation of dihydro-5-fluorouracil. Since it lacks selectivity toward tumor cells,
Corresponding author: * R.A.Patil
Shree Santkrupa College of Pharmacy, Ghogaon, Karad- 415111 (M.S.) India. [email protected]
5-FU also exhibits significant toxicity. Prodrug of 5-FU have been developed to improve efficacy and to reduce side effect and toxicity (4-5). For example, Tegafur [5-fluoro-1-[(RS)-tetrahydrofuran-2-yl]-pyrimidine-2, 4-(1H, 3H)-Dione] maintains an effective 5-FU concentration over a longer period while Doxifluridine [5_deoxy-5-fluorouridine] achieves some selectivity toward tumors (6-7). However, both prodrugs still show adverse effects, such as diarrhoea after oral and intravenous administration. CAP was developed to reduce such adverse effects while improving the selectivity toward tumours. (8)
Structure of Capecitabine
Asian Journal of Pharmaceutical Research and Development Vol. 3 (5) Sep – Oct.. 2015:1-8
www.ajprd.com 2
for the detection of CAP in bulk drug and pharmaceutical formulation.
Hence, on the basis of literature survey it was thought to develop a precise, accurate, simple, reliable and less time consuming RP –HPLC method for estimation of Capecitabine in tablet formulations.
MATERIALS & METHODS:
Apparatus:
The analysis was performed by using Waters HPLC system 400, Column used is C-18 (4.6×250mm) with a flow rate of 1 ml/min. The mobile phase consists of Methanol: Water as
85:15, the injection volume is 10µL and the
photo diode array detection was at 303 nm.
Reagents and materials:
CAP was obtained as a gift sample from Naprod Life Sciences, Boisar India. All solvents and reagents used were of AR/HPLC grade. A tablet dosage form containing CAP were purchased from local commercial sources.
Standard solution-
Selection of Mobile Phase:
Selection of mobile phase was performed based on resolution, asymmetric factors and theoretical plates obtained for the drug. By consideration of pKa values of the drugs, initially pH was adjusted to both acidic and basic pH range.
From the various mobile phases tried, mobile phase containing methanol: Double distilled water in 85:10 % v/v, pH was adjusted to7.5 with NaOH was selected, since it gave sharp and completely resolved peaks with symmetry within limits and significant retention times for the drug.
Preparation of standard drug solution:
Accurately weighed quantity 500mg of Capecitabine was transferred to 1000.0 ml volumetric flask, dissolved the mixture using 100 ml of distilled water as a diluent and then sonicated for 10 minutes. Later the volume was made up to the mark with diluent to make 500 ppm of Capecitabine.
Preparation of sample solution:
Marketed tablet formulation containing 500 mg CAP of Capecitabine was used for
preparation of sample solution.
Twenty tablets were weighed accurately, finely powdered and powder equivalent to 500 mg of Capecitabine was transferred into 100 ml volumetric flask, dissolved the mixture in 25 ml of diluent and sonicated for 10-15 minutes. The final volume of the solution was made up to 100 ml with diluent, and the solution was filtered through whatmann filter paper no.41.The sample was analyzed under optimized chromatographic conditions and chromatogram is depicted in Figure 4.The result of analysis of marketed tablet formulation shown in Table 3.And 4
The final dilutions of standard and sample were injected to the system and analyzed at 303 nm. Capecitabine was eluted at the retention time of 4.2 min. for Capecitabine
Analytical Method Validation: [1-8]
The method was validated in terms of linearity, sensitivity, precision and accuracy the sample applications. The linearity of the method was investigated by serially diluting the stock solutions. Calibration curves were constructed by plotting the peak area against the concentration. All the drugs show linearity in the concentration range. Method was validated as per ICH Q2B guidelines.
Linearity:
Linearity was studied by preparing standard solutions at different concentration levels. The linearity range for Capecitabine was found to be 0.5-1.5 µg/ml.
Accuracy:
Accuracy of an analytical method is the closeness of test results obtained by a method to the true value. The accuracy of analytical method should be established across its range. To check the degree of accuracy of the proposed method, recovery studies were carried at three different levels (80%, 100% and 120%).From the total amount of drug added, the percentage recovery was calculated [1,2,7,8].
Preparation Chart for Accuracy solution is shown in Table 4
represented in Figure 5.to 7
Precision:
The precision of an analytical method is the amount of scatter in the results obtained from multiple analyses of a homogeneous sample under the prescribed conditions.
Precision (Intra-day precision) was evaluated by carrying out replicate injections of CAP sample preparation on the same day [1-2]. The results were shown in Table 5.and 6.
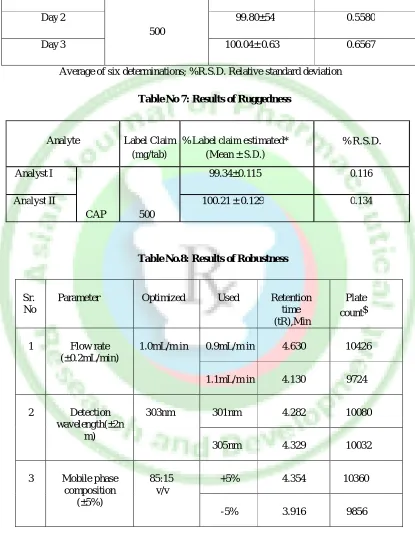
Robustness:
Robustness is the measure of its capacity to remain unaffected by small, but deliberate variations in method conditions and its indications of the reliability of the method. A method is robust, if it is unaffected by small changes in operating conditions. To determine the robustness of method, the experimental conditions were deliberately altered using following parameters and chromatographic responses were evaluated [1,4-8].
1) Change in flow (± 0.1 ml/min) 2) Change in wavelength (± 2 nm)
Standard and test solutions for each of the robustness parameter were prepared and injected in the system. Their effects on
retention time, theoretical plate, tailing factor, percent recovery, %R.S.D. were standard. The results from the robustness studies are presented in Table 7 & 8 and Figure 8 &9
Specificity:
Specificity is the ability of the method to accurately measure the analyte response in the presence of all potential sample components
The response of the analyte in test mixtures containing the analyte and all potential sample components (excipients, degradation products, process impurities, etc.) is compared with the response of a solution containing only the analyte [1, 7].
The peak purity of Capecitabine was assessed by comparing the retention time (Rt) of standard Capecitabine.
System Suitability: [1-2, 9, 13]
System suitability tests are an integral part of method development is used to ensure
adequate performance of the
chromatographic system. Retention time, No. of theoretical plates (N), tailing factor (T), and peak symmetry (AS) were recorded. The results were given in Table 10 and are within acceptable limits.
RESULT AND DISCUSSION:
Figure.1: Spectra UV Scan of Capecitabine (CAP) in distilled water.
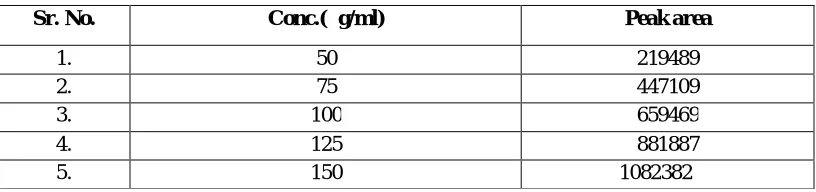
Table No1: Data for calibration curve of CAP
Sr. No. Conc.(µg/ml) Peak area
1. 50 219489
2. 75 447109
3. 100 659469
4. 125 881887
Asian Journal of Pharmaceutical Research and Development Vol. 3 (5) Sep – Oct.. 2015:1-8
www.ajprd.com 4 Table No.2: Statistical data of linearity for CAP by HPLC method
Sr. No. Parameters HPLC method
1. Detection wavelength(nm) 303nm
2. Beer’s law limit(µg/ml) 50-150
3. Regression equation Y* 8642.3x - 206158
4. Slope (B) 8642.3
5. Intercept(A) 206158
6. Correlation coefficient r2 0.999
Y= A + B*C, where C= concentration in µg/ml and Y =absorbance unit.
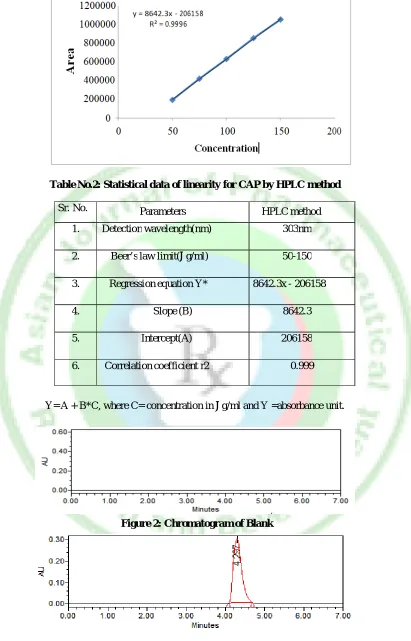
Figure 2: Chromatogram of Blank
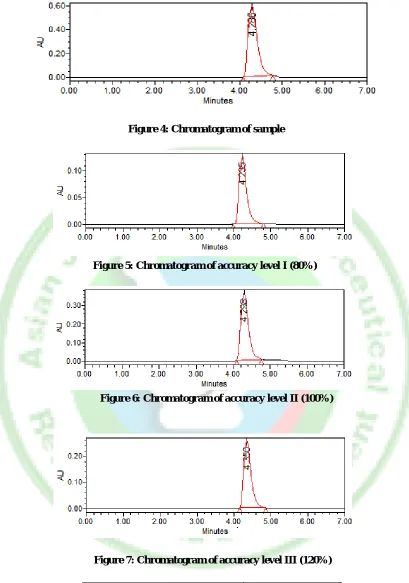
Figure 4: Chromatogram of sample
Figure 5: Chromatogram of accuracy level I (80%)
Figure 6: Chromatogram of accuracy level II (100%)
Figure 7: Chromatogram of accuracy level III (120%)
Asian Journal of Pharmaceutical Research and Development Vol. 3 (5) Sep – Oct.. 2015:1-8
www.ajprd.com 6
Figure: 9 Chromatogram of standard preparation (1.1ml/min flow rate)
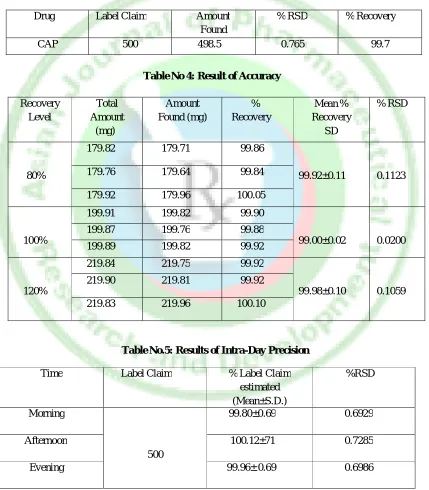
Table No 3: Results of Analysis of Marketed Formulation
Drug Label Claim Amount
Found
% RSD % Recovery
CAP 500 498.5 0.765 99.7
Table No 4: Result of Accuracy
Recovery Level
Total Amount (mg)
Amount Found (mg)
% Recovery
Mean % Recovery
SD
% RSD
80%
179.82 179.71 99.86
99.92±0.11 0.1123
179.76 179.64 99.84
179.92 179.96 100.05
100%
199.91 199.82 99.90
99.00±0.02 0.0200
199.87 199.76 99.88
199.89 199.82 99.92
120%
219.84 219.75 99.92
99.98±0.10 0.1059
219.90 219.81 99.92
219.83 219.96 100.10
Table No.5: Results of Intra-Day Precision
Time Label Claim % Label Claim
estimated (Mean±S.D.)
%RSD
Morning
500
99.80±0.69 0.6929
Afternoon 100.12±71 0.7285
Evening 99.96± 0.69 0.6986
Table No.6: Results of Inter-Day Precision
Time Label Claim % Label Claim
estimated (Mean±S.D.)
%RSD
Day 1
500
99.45±0.55 0.5478
Day 2 99.80±54 0.5580
Day 3 100.04± 0.63 0.6567
Average of six determinations; %R.S.D. Relative standard deviation
Table No 7: Results of Ruggedness
Analyte Label Claim
(mg/tab)
% Label claim estimated* (Mean ± S.D.)
% R.S.D.
Analyst I
CAP 500
99.34±0.115 0.116
Analyst II 100.21 ± 0.129 0.134
Table No.8: Results of Robustness
Sr. No
Parameter Optimized Used Retention
time (tR),Min
Plate count$
1 Flow rate
(±0.2mL/min)
1.0mL/m in 0.9mL/m in 4.630 10426
1.1mL/m in 4.130 9724
2 Detection
wavelength(±2n m)
303nm 301nm 4.282 10080
305nm 4.329 10032
3 Mobile phase composition
(±5%)
85:15 v/v
+5% 4.354 10360
-5% 3.916 9856
Table No.9: Result of LOD & LOQ
LOD (µg/ml)* LOQ (µg/ml)*
Asian Journal of Pharmaceutical Research and Development Vol. 3 (5) Sep – Oct.. 2015:1-8
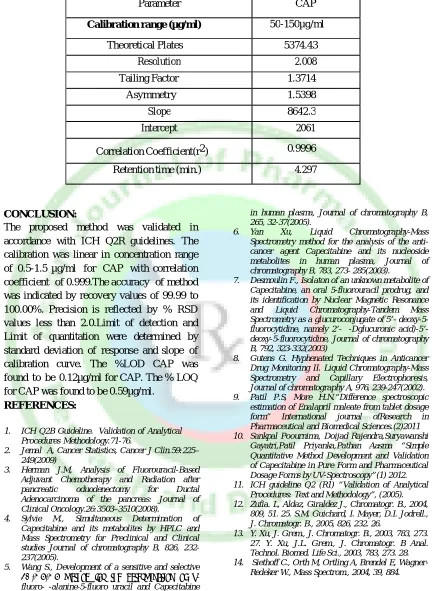
www.ajprd.com 8 Table No10: System Suitability Test Parameters
Parameter CAP
Calibration range (µg/ml) 50-150µg/ml
Theoretical Plates 5374.43
Resolution 2.008
Tailing Factor 1.3714
Asymmetry 1.5398
Slope 8642.3
Intercept 2061
Correlation Coefficient(r2) 0.9996
Retention time (min.) 4.297
CONCLUSION:
The proposed method was validated in accordance with ICH Q2R guidelines. The calibration was linear in concentration range of 0.5-1.5 µg/ml for CAP with correlation coefficient of 0.999.The accuracy of method was indicated by recovery values of 99.99 to 100.00%. Precision is reflected by % RSD values less than 2.0.Limit of detection and Limit of quantitation were determined by standard deviation of response and slope of calibration curve. The %LOD CAP was found to be 0.12µg/ml for CAP. The % LOQ for CAP was found to be 0.59µg/ml.
REFERENCES:
1. ICH Q2B Guideline. Validation of Analytical Procedures Methodology.71-76.
2. Jemal A, Cancer Statistics, Cancer J Clin.59:225– 249(2009)
3. Herman J.M, Analysis of Fluorouracil-Based Adjuvant Chemotherapy and Radiation after pancreatic oduodenectomy for Ductal Adenocarcinoma of the pancreas: Journal of Clinical Oncology.26:3503–3510(2008).
4. Sylvie M., Simultaneous Determination of Capecitabine and its metabolites by HPLC and Mass Spectrometry for Preclinical and Clinical studies Journal of chromatography B, 826, 232-237(2005).
5. Wang S., Development of a sensitive and selective
LC/MS/MS method for the determination of α -fluoro-β-alanine-5-fluoro uracil and Capecitabine
in human plasma, Journal of chromatography B, 265, 32-37(2005).
6. Yan Xu, Liquid Chromatography-Mass Spectrometry method for the analysis of the anti-cancer agent Capecitabine and its nucleoside metabolites in human plasma, Journal of chromatography B, 783, 273- 285(2003).
7. Desmoulin F., Isolaton of an unknown metabolite of Capecitabine, an oral 5-fluorouracil prodrug, and its identification by Nuclear Magnetic Resonance and Liquid Chromatography-Tandem Mass Spectrometry as a glucuroconjugate of 5’- deoxy-5-fluorocytidine, namely 2’-(β-Dglucuronic acid)-5’-deoxy-5-fluorocytidine, Journal of chromatography B, 792, 323-332(2003)
8. Gutens G. Hyphenated Techniques in Anticancer Drug Monitoring II. Liquid Chromatography-Mass Spectrometry and Capillary Electrophoresis, Journal of chromatography A, 976, 239-247(2002). 9. Patil P.S, More H.N.“Difference spectroscopic
estimation of Enalapril maleate from tablet dosage form” International journal ofResearch in Pharmaceutical and Biomedical Sciences.(2)2011 10. Sankpal Poournima, Doijad Rajendra,Suryawanshi
Gayatri,Patil Priyanka,Pathan Aasma “Simple Quantitative Method Development and Validation of Capecitabine in Pure Form and Pharmaceutical Dosage Forms by UV-Spectroscopy”(1) 2012. 11. ICH guideline Q2 (R1) “Validation of Analytical
Procedures: Text and Methodology”, (2005). 12. Zufia. L, Aldaz, Giraldez J., Chromatogr. B., 2004,
809, 51. 25. S.M. Guichard, I. Mayer, D.I. Jodrell., J. Chromatogr. B., 2005, 826, 232. 26.
13. Y. Xu, J. Grem., J. Chromatogr. B., 2003, 783, 273. 27. Y. Xu, J.L. Grem., J. Chromatogr. B Anal. Technol. Biomed. Life Sci., 2003, 783, 273. 28. 14. Siethoff C., Orth M, Ortling A, Brendel E,