THE MOVEMENT ECOLOGY OF LARGE, MOBILE FISHES IN NORTH CAROLINA ESTUARIES
Matthew D. Kenworthy
A dissertation submitted to the faculty at the University of North Carolina at Chapel Hill in partial fulfillment of the requirements for the degree of Doctor of Philosophy in the
Environment, Ecology, and Energy Program in the College of Arts and Sciences.
Chapel Hill 2019
© 2019
ABSTRACT
Matthew Dylan Kenworthy: The Movement Ecology of Large, Mobile Fishes in North Carolina Estuaries
(Under the direction of F. Joel Fodrie)
Linkages between availability of healthy coastal habitats and sustainability of fish populations has been an important driver of marine ecosystem conservation and restoration efforts. Yet, identifying what exactly constitutes critical habitat remains challenging. Key to identifying the value and function of estuarine habitats in supporting fish production is
quantifying spatiotemporal use of target habitats by fishes. However, this is complicated by the fact that fish move over multiple spatiotemporal scales. I explored the movement ecology and habitat selectivity of recreationally important fishes in multiple North Carolina estuaries
analysis of red drum habitat utilization identified greater than expected selection for structured habitats along saltmarsh edges. In the NRE, man-made cultch reefs were visited by our focal species in similar modes and frequencies as unstructured habitats following the destructive harvest of oysters. We observed a greater volume of detections for black drum at the larger, more structurally complex artificial reefs although no distinguishable relationships were observed for red drum and southern flounder. Finally, because traditional gears sample a greater quantity and variety of individuals and species, they have been utilized primarily in studies evaluating
community based research questions while telemetry has been linked with research requiring greater spatiotemporal resolution of fish behavior. This research both expands on and
corroborates previous studies analyzing the movement ecology of fishes. These data will better inform stakeholders about the value of various estuarine habitats and guide managers in
ACKNOWLEDGEMENTS
I first would like to acknowledge my advisor Dr. Joel Fodrie. You always finds a way to go above and beyond to support and guide your students and technicians towards success in the field of estuarine ecology. For me, this began many years prior to entering into the PhD program at the University of North Carolina at Chapel Hill. You guided me through my first presentation at a scientific conference as an undergraduate student and my first co-authorship on a manuscript publication as a graduate student. I am extremely grateful for the opportunities you have
provided which have allowed me to grow as an ecologist. Studying and exploring the variety of ecosystems from North Carolina to the Galapagos has truly been a pleasure and has made me a much better scientists today. You have also been a great friend outside of work. Specifically, thank you for teaching me valuable lessons in being a good sportsman.
In addition to my advisor, I would like to thank my entire committee for the guidance and support extended to me prior to and during my time as a PhD student at UNC. You all have provided valuable guidance for my dissertation research and I would not be in this position without you. From the first day we all set out into the field to begin these studies, I have always admired your excitement and enthusiasm for the research. Each of you have provided unique guidance and support that I will carry with me and use as I continue to develop my career as a marine ecologist. I look forward to many years of friendship as well as research collaboration.
specifically want to extend special thanks to C. Baillie, M. Brodeur, S. Coleman, J. Geyer, R. Gittman, D. Keller, J. Morley, G. Redding, A. Pool, A. Poray, M. Tice-Lewis, E. Voigt, and E. Woodward. This dissertation would not have happened had you all not dedicated so much time and effort towards helping collect data with me.
Beyond our immediate research team, I would express my appreciation to the greater IMS community. The kindness, support, and encouragement of everyone at IMS truly makes this a very special place to work. I would like to specifically express appreciation to the shop crew who worked diligently to keep our boats running and our financial team that kept our spending in check. While each field station has a unique and inspiring research family, I will truly cherish everyone I was blessed with interacting with at IMS. Leaving such a great group is tough, but knowing that I can return at any moment to open arms is a great feeling. I look forward to many years of coming home to visit with each and every one.
To my parents and my brother, you have always been supportive of who I am and who I aspire to become. Thank you for supporting my decision to extend my education and earn a PhD. You have been very special role models in my life and I hope that I can be half as successful as you. My big brother, you have paved a golden pathway inspiring me with your guidance allowing me to become a better person. Mom and Dad, you have fueled my interest and respect for the environment which has directed me towards this career in marine ecology. Thank you for your guidance and for inspiring me to continue along this career path.
TABLE OF CONTENTS
LIST OF TABLES ...xiii
LIST OF FIGURES ...xiv
LIST OF SYMBOLS AND ACRONYMS ...xv
CHAPTER 1: MOVEMENT ECOLOGY OF A MOBILE PREDATORY FISH REVEALS LIMITED HABITAT LINKAGES WITHIN A TEMPERATE ESTUARINE SEASCAPE...1
Introduction ...1
Methods ...4
Study Area ...4
Tagging and Tracking...4
Dispersal Patterns Away from Middle Marsh Release Location ...6
Activity Space ...8
Residency ...8
Fishermen Recaptures ...10
Result ...10
Dispersal ...11
Activity Space ...12
Residency ...13
Discussion ...14
Tables ...23
Figures ...25
CHAPTER 2: SPATIAL CONFIGURATION OF HABITAT WITHIN AN ESTUARINE SEASCPE MOREINFLUENTIAL THAN IDENTITY AND AVAILABILITY IN DETERMINING SELECTIVY BY A MOBILE PREDATORY FISH ……….28
Introduction ………...28
Methods ………...…...30
Study site………30
Study Species………..32
Tagging and Tracking………32
Habitat Selection Indices ………..33
Results………....35
Discussion………..37
Acknowledgements………....41
References………..42
Tables………...46
Figures………49
CHAPTER 3: COMPARING ACOUSTIC TELEMETRY AND TRADITIONAL GEARS TO MAXIMIZE SPATIOTEMPORAL RESOLUTION IN ESTUARINE FISH RESEARCH AT INDIVIDUAL, SPECIES. AND COMMUNITY LEVELS ...53
Introduction ...53
Methods ...56
Literature search ...56
Data Collection Characteristics ...57
Case Studies ...59
Cost Analysis ...62
Results ...63
Research Topics ………63
Data Collection Characteristics ………. .64
Case Studies ………..65
Discussion………..67
Acknowledgements ………...71
References ...73
Tables………...80
Figures………85
CHAPTER 4: RESTORATION GOALS, SPATIAL-SCALE, AND SPECIES IDENTITY INFLUENCE HOW CULTCH SHELL ENHANCEMENT AND ARTIFICIAL REEFS PROVIDE HABITAT SUBSIDIES FOR ESTUARINE FISHES...88
Introduction ...88
Methods ...91
Study Area ...91
Study Species ...93
Tagging and tracking ...93
Habitat Sampling ...95
Discussion ...100
Acknowledgements ...105
References ...106
Tables ...110
LIST OF TABLES
Table 1.1 Summary of 34 red drum tagged with acoustic transmitters ...23 Table 1.2 Connectivity matrix indicating probability of movement
between marsh complexes ...24 Table 2.1 Summary of 34 red drum tagged with acoustic transmitters ...46 Table 2.2 Summary of the total number of detections for all fish within
each habitat classification during the early, middle, and late time periods ...47 Table 2.3 Summary of habitat availability represented as percent of
individual classifications during each time period ...48 Table 3.1 List of publications identified in the Web of Science literature search
and extracted sampling metrics ...80 Table 3.2 List of research topics identified in the selected publications for each gear type ...82 Table 3.3 Sampling metrics quantified for each gear type examined ...83 Table 3.4 List of supplies and cost associated with sampling gear required
for the gill-net and telemetry surveys associated with the two case studies examined ....84 Table 4.1 Location and quantity of cultch material at six cultch oyster reef
LIST OF FIGURES
Figure 1.1 Map of the hydrophone observation network ...25
Figure 1.2 Dispersal patterns for red drum throughout the study ...26
Figure 1.3 Red drum activity space measured through time ...27
Figure 2.1 Distribution of habitat types within the acoustic detection arena at our study site ...49
Figure 2.2 Relocations of all fish throughout the entire study superimposed on an aerial image of the study site ...50
Figure 2.3 Habitat preference of red drum for all habitat classifications ...51
Figure 2.4 Habitat preference of red drum for reef classifications only ...52
Figure 3.1 Map of the sampling locations for the case studies ...85
Figure 3.2 Patterns of fine-scale habitat selectivity in fine-scale habitat selectivity case study ...86
Figure 3.3 Patterns of seasonal distribution in estuarine-scale seasonal distribution case study ...87
Figure 4.1 Map of the hydrophone observation network and location of man-made-made habitats monitored in the New River Estuary ...112
Figure 4.2 Mean number of detections day-1 at oyster cultch reefs and associated reference sites for each individual species and all species combined ...113
Figure 4.3 Mean number of detections day-1 fish-1 at AR-398 and the associated reference site for each individual species and all species combined ...114
Figure 4.4 Mean number of total visits at oyster cultch reefs and associated reference sites for each individual species and all species combined ...115
LIST OF SYMBOLS AND ACRONYMS
% percent
< less than > greater than
plus or minus
σ standard deviation
Δ delta (difference in)
μ average
ANOVA Analysis of Variance
C Celsius
Cm centimeter
m meter
mm millimeter
km kilometer
n sample size
RTK GPS real time kinematic global positioning system SE standard error
t time
ppt parts per thousand
VR2W Name of VEMCO single channel receiver
CHAPTER1: MOVEMENT ECOLOGY OF A MOBILE PREDATORY FISH REVEALS LIMITED HABITAT LINKAGES WITHIN A TEMPERATE ESTUARINE
SEASCAPE1
Introduction
Marine ecosystems are typically comprised of heterogeneous mosaics of distinct habitat patches (i.e., seascapes). Identifying the value and function of habitats within the seascape is a central component of efforts to conserve and protect estuarine habitats (Bostrom et al. 2011). As ecologists and managers incorporate ecosystem-level approaches into research and decision making in marine environments, they have drawn on studies quantifying the degree of
connectivity that results from the exchange of nutrients, pollutants, pathogens, sediments, and organisms (i.e., fish, birds, and mobile invertebrates) across habitat boundaries within seascapes (Polis et al. 1997). Fish movement, often considered one of the most influential factors in mediating habitat connectivity (Sheaves 2009), within and among these habitat mosaics can affect species interactions (Baggio et al. 2011), foraging behaviors (Beets et al. 2003), ecosystem resiliency, biodiversity (Olds et al. 2012), reproduction (Bolden 2000), recruitment success (Berkstrom et al. 2012), and nutrient transfer (Meyer et al. 1983). Therefore, enhancing our understanding of fish movement patterns within and between various estuarine habitats is critical
1 This chapter was previously published in Canadian Journal of Fisheries and Aquatic Sciences. The original
to the management and conservation of fish populations and habitats on which they depend (e.g. identifying discrete stock units).
Mobile fish species capable of traveling large distances (i.e. >5 km/day) increase the linkages and potential for connectivity among habitats within estuarine seascapes (Rosenblatt and Heithause 2011; McCauley et al. 2012; McMahon et al. 2012). Fish behavior can be highly variable, with a number of factors affecting a fish’s decision to move. For example, movement and habitat choice can vary with individual preference and habitat complexity (Popple and Hunte 2005), different degrees of predation pressure (Martin et al. 2010), resource availability
(Hammerschlag et al. 2010), seasonally (Barbour et al. 2014; Ketchum et al. 2014), and between contingents of fish (Afonso et al. 2009), Here, we explore the movement behaviors of a relatively large mobile predator between different marsh complexes within a temperate estuary and the potential implications of this behavior on seascape-level connectivity of marsh complexes.
Salt marsh (Spartina altinaflora) complexes are often the dominant shoreline habitat within temperate estuarine ecosystems, and are typically comprised of a mosaic of salt marsh, seagrass, oyster reef, and mud/sand flat that are separated by deeper channels or extended sand/mud flats from other structured habitats (most typically, other marsh complexes).
Red drum (Sciaenops ocellatus), common in estuaries from Virginia to Texas, is highly sought after by recreational fishermen. As sub-adults (up to age five), red drum inhabit estuarine marsh complexes and near-shore habitats and forage on small fishes and crustaceans (Scharf and Schlight 2000). Individuals are capable of traveling large distances (> 10 km/week) and are often found occupying a variety of estuarine habitats across a wide range of salinities in temperate estuaries (Bacheler et al. 2009a; Bacheler et al. 2009b). Because they are considered highly mobile and use a wide range of estuarine habitats, red drum are presumed to increase the connectivity of spatially separated saltmarsh complexes within estuaries over tidal, diel, and seasonal scales.
Methods
Study Area
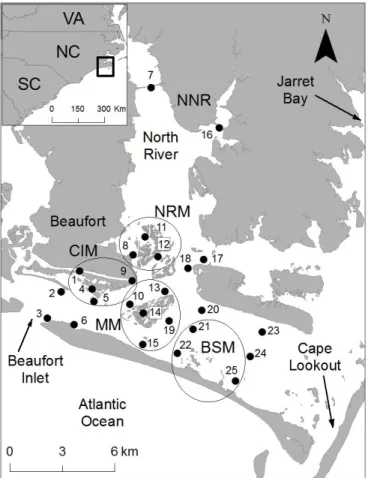
We acoustically tracked the movement of 34 sub-adult red drum over five months within a temperate estuary near Cape Lookout, NC (Fig. 1.1). The shallow estuary of North River and Back Sound covers an area of 68 km2 from Beaufort Inlet (western extent of study system) to Bardens Inlet at Cape Lookout (eastern extent). The estuary contains multiple saltmarsh complexes, large expanses of shallow un-vegetated bottom, and deeper channels. Within the study area, we deployed an array of 25 Vemco VR2W hydrophones to detect red drum movement, specifically among four distinct salt marsh complexes (Fig. 1.1).
Within each marsh complex, multiple hydrophones were deployed to increase the probability of detection when fish were present. For our analysis, hydrophones were grouped according to their associations with individual marsh complexes or classified as “non-marsh” (Fig. 1.1). Non-marsh stations were located in deeper channels and mud/sand flats, which were presumed to be travel corridors. The hydrophone stations were grouped as follows: Carrot Island Marsh (CIM) stations: 1, 4, 5, 9; Middle Marsh (MM) stations: 10, 13, 14, 15, 19; North River Marsh (NRM) stations: 8, 11, 12; Back Sound Marsh (BSM) stations: 21, 22, 25; and non-marsh complex stations: 2, 3, 6, 7, 16, 17, 18, 20, 23, 24 (Fig. 1.1). The VR2W omni-directional
hydrophones had a detection range of approximately 350 m in this study system based on range detection tests conducted at the start of the study.
Tagging and Tracking
transmitter (LOTEK Wireless Inc. MM-MR-11-28, also used in a companion fine-scale tracking study, see Fodrie et al. 2015) was implanted into the body cavity of each fish following
procedures similar to Dresser and Kneib (2007). These transmitters emitted both LOTEK Wireless and Vemco coded signals, and therefore were all detectable with the VR2W (Vemco) receivers. Following tag implantation, fish were held for 24 hours for observation before being released into the southwestern-most bay within the MM complex (Fig. 1.1). Fish monitored in this study were the same individuals tracked in a companion project analyzing fine-scale habitat use within MM, therefore requiring all fish to be released in the same location (Fodrie et al. 2015). Individual fish were released intermittently starting July 12th, with the last fish being
released on October 9th. At regular one-minute intervals, the transmitter emitted a pulsed chirp unique to each fish, which was used to identify the presence of each individual within range of a hydrophone. For each detection, the hydrophone recorded the transmitter ID, date, and time information, and we downloaded these data monthly. Due to potential discrepancies in behavior as a result of capture, tagging, and subsequent release back into the environment, we excluded detections during the first 24 hours after being released from our movement analyses.
is detected continuously at a single hydrophone, with no detections occurring at any other stations, for extended periods of time.
Dispersal Patterns Away from Middle Marsh Release Location
Understanding connectivity in estuarine systems requires knowledge of the rate at which fish move throughout the estuary over hours to months. We calculated the rate of dispersal away from the release location in the southwestern-most embayment within MM. Red drum detections were separated into 10, six-day time bins, roughly representing weeks since being released into the estuary (weeks at liberty thereafter). We then established three detection metrics: 1) the raw number of detections (total detections thereafter), reflecting the number of times all individuals were detected, collectively, at each hydrophone during each week at liberty; 2) the number of individuals that visited each hydrophone during each week at liberty; and 3) a weighted number of detections, defined as “relative occurrence”, at each hydrophone during each week at liberty. We chose to look at the number of fish visiting hydrophones to supplement the detection volume data (i.e. total detections). Instead of using just the number of total detections, which for any individual hydrophone or group of hydrophones could result from ‘residency’ of a single fish, we also wanted to evaluate how many individuals were detected at each hydrophone during each week at liberty. The third metric was designed to address a potential bias of individuals with disproportionately higher number of detections “swamping” total detection (metric 1) patterns. To accomplish this, we standardized total detections by dividing a fish’s number of detections at each hydrophone by the total number of detections collectively for that individual at all
hydrophones. In doing so, “relative occurrence” at individual hydrophones was scaled between 0 and 1 for each week at liberty for each fish. Each fish’s relative occurrence value at each
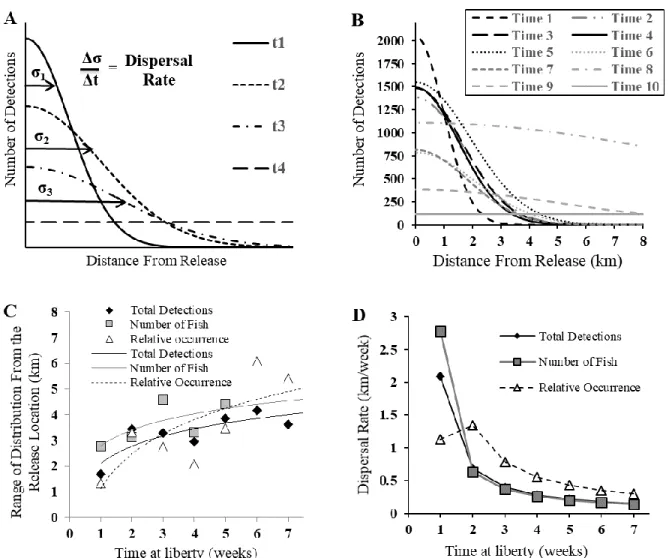
We adopted the general approaches of inspecting animal movement outlined by Ergon and Gardner (2014) by quantifying dispersal patterns as changes in the three detection metrics across our hydrophones, each of known distance from the release point in MM, through time. We first plotted the relationship between our detection metrics at each hydrophone and the straight-line distance from the release location to the respective hydrophone for each weekly time bin (Fig. 1.2A). Next, normal distribution curves were fit through the data points to characterize the distribution of the detection metrics for each weekly bin. We used the resulting standard
deviation (sigma [σ]) from the weekly normal distribution curves to represent the relative range of fish distribution (measured in kilometers). For the analysis, we used two standard deviations (2σ) representing 95% of the distribution range. This value therefore represented the distance from the release location in which 95% of fish detections occurred during that week, hereafter referred to as “relative distribution”. As fish dispersed from the release location, the distribution of detections as a function of distance (of hydrophones) from the release location should
“flatten”, resulting in increasing 2σ values over time (Fig. 1.2B). By week 7 in our study the distribution of detections calculated from total detection and relative occurrence metrics had flattened to the point that 2σ values were unreliably large, and therefore we ceased to evaluate relative distribution beyond this point. When analyzing the number of individuals detected at each hydrophone (detection metric 2 listed above), 2σ became unreliably large after week 5. Dispersal rate, the change in 2σ over time (Δ2σ/Δt) (t = time), were calculated from the
Activity Space
In addition to quantifying the mean dispersal rate of tagged red drum over the duration of the study, we quantified weekly activity space size through time to examine if fish revisit the same areas or continuously explore new areas. First, we calculated the center of activity (COA) for each fish using the latitude and longitude coordinates of each hydrophone as suggested in Simpfendorfer et al. (2002). We weighted these values by the number of detections at each hydrophone visited during each week at liberty. Standard deviation (σ) values resulting from calculating the mean latitude and longitude components of the COA were averaged to obtain a single value representing the radius (m) of primary activity space for each week at liberty. Similar to dispersal calculations, we used two standard deviations (2σ) for the radius (m) of weekly activity space, which reflected 95% of all detections (per each individual fish within each week) occurring within these boundaries.
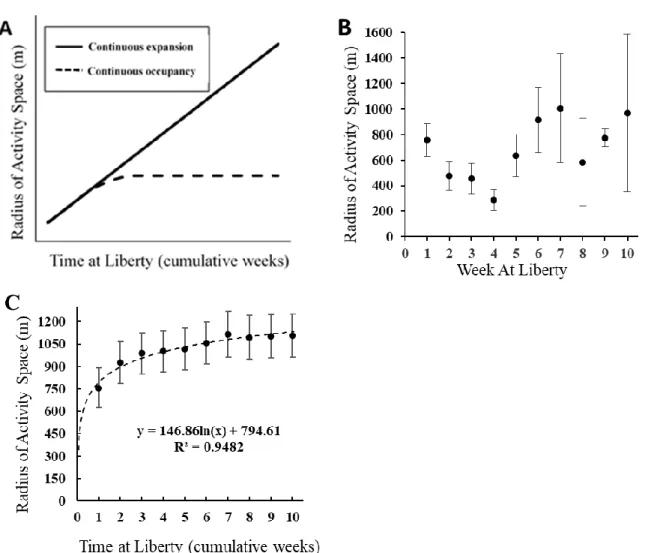
Next, we explored temporal variation in the weekly activity space of fish by calculating cumulative activity spaces. Cumulative activity space was calculated in the same manner as for weekly measurements; however, the cumulative measurement included detections from that week and all previous weeks since release. If fish were occupying completely new areas from week to week, we expected to see cumulative activity space continue to grow linearly through time (Fig. 1.3A). Alternatively, if a fish revisited areas over time, suggestive of higher site
fidelity, we expected the cumulative activity would grow initially, then asymptote over time (Fig. 1.3A).
Residency
To examine patterns of residency and exchange of fish among individual marsh
our study area. Each day that an individual red drum was detected, we randomly selected one detection that day and recorded the location of that detection (primary detection). Relative to the time stamp of the primary detection, we identified the location of that same fish twenty-four hours later, or as soon as possible thereafter, based on the marsh complex groupings above (subsequent detection). We chose a twenty-four-hour time step to allow for two full tidal cycles and one day-night cycle, both of which can impact fish movement behavior and habitat choice (Popple and Hunte 2005; Dresser and Kneib 2007). This procedure was repeated each calendar day for which each individual was detected throughout the study. We conducted 100 iterations, with replacement, of this sampling procedure to ensure that a representative selection of
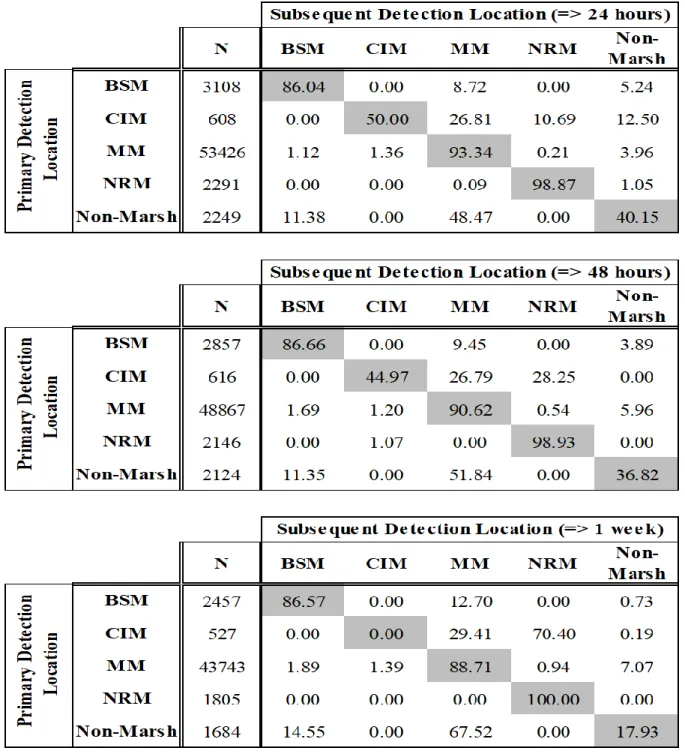
randomly selected detection data points were incorporated. Therefore, for each day a fish was detected, we performed this procedure using 100 randomly selected detections. From these observations, we created a connectivity matrix identifying the probabilities that individuals observed in a given marsh complex (primary detection) will be relocated in the same marsh complex, a different marsh complex, or a non-marsh location after 24 hours (subsequent detection). Probabilities ranged from 0, low chance of being detected in subsequent location, to 100, high chance of being detected in subsequent location. A high probability of being detected within the same marsh complex suggests high residency. Further, we explored the consistency of these behaviors over time by conducting the same analysis with time lags of 48 hours and one week following the primary detections.
Finally, we assured that the uneven distribution of hydrophones within the marsh complexes (e.g. MM contained five hydrophones while the others had 3-4 each) did not
the three hydrophones with the most detections and ran our analysis again three times with all combinations of two of these three hydrophones being removed from the dataset. Therefore, for each subsequent run of the analysis, MM was represented using only three hydrophones. Due to consistencies in our original test for residency patterns using different time lags as well as the consistency in the re-analysis of the dataset with a 24-hr lag, we did not perform this test using time lags of 48-hr or 1-week. The resulting detection probabilities did not differ notably from the original analysis therefore we proceeded to include all hydrophones from MM in our subsequent analysis of residency patterns.
Fishermen Recaptures
Throughout the study, recreational and commercial fishermen reported occurrences of capturing our tagged red drum. Using the date and location of the reported captures, we calculated the number of days at liberty between release to recapture and the straight-line distance from the release location to the recapture location. We examined the correlation between days at liberty and distance from the release location to suggest whether individuals exhibited random (low correlation) or non-random (high correlation) movement away from the study area. Correlation analysis was conducted in JMP Pro12.
Results
an average of 33 ± 5 days at liberty. Six individuals were detected visiting a combination of three marsh complexes while another 13 were only detected in two complexes. The remaining 13 fish were detected only in the MM complex. Of the 34 fish released, nine individuals were recaptured by fishermen during or following our 5-month tracking effort. The time at liberty of these nine fish ranged from 2 days to 425 days and the straight line distance from the release location to the recapture location varied from 0 km up to 38 km. There was no distinguishable relationship between days at liberty and distance from release location to recapture location (Pearson’s r = <0.01).
Dispersal
fluctuating distribution range through week five (Fig. 1.2C). Dispersal rate calculated based on number of fish at each hydrophone was high during week one (2.78 km/week), followed by a large reduction in dispersal rate between week two (0.63 km/week) and week five (0.20 km/week) (Fig. 1.2C-D).
The average of all three detection metrics indicated that after the first two weeks at liberty, the range of dispersal was approximately 3.29 km, which was comparable to the distance across the MM complex from the release location (2.73 km). Although dispersal measurements were calculated to represent distribution in all directions, the minimal number of detections at hydrophones one through six to the west of MM (0.08% of total) indicated that the dispersal direction was predominantly towards the east and north of the release location, along the main axis of MM.
Activity Space
Weekly mean radius of activity space ranged from 286 m to 1007 m, with an overall average of 686 ± 16.1 m (mean radius ± SE), and did not change appreciably over time (Fig. 1.3B). Calculations of cumulative activity space indicated that the greatest increase in mean radius occurred during week one (756 m) and week two (925 m) (Fig. 1.3C). The size of the cumulative activity space increased by small increments (<10% per week) over the remaining eight weeks of observations. Overall, the fish displayed only a 20% increase in the radius of their cumulative activity space between week two and week ten. Similar to results from dispersal patterns, the cumulative activity space after two weeks at liberty (2.69 km2) scaled
Residency
The connectivity matrix indicates the probabilities of fish remaining in the same location as the primary detection (highlighted values along the diagonal of the matrix; Table 1.2) or moving to a new location (non-highlighted values; Table 1.2). Movement probabilities indicated that a fish had a >85% probability of being detected in the same marsh complex after 24 hours in three of the four marsh complexes (BSM: 86.04%; MM: 93.34%; NRM: 98.87%). Fish within CIM were the least likely to remain in the same complex (connectivity index = 50%). Fish initially detected at any of the non-marsh locations had a greater likelihood of being detected at MM (48.5%) compared to being detected again at a non-marsh complex location (40.15%).
In general, when fish were not detected in the same marsh complex after 24 hours from the primary detection, they were most likely to be detected in the MM complex during
subsequent detections. There was evidence for a lack of direct linkages (i.e. subsequent detection probabilities equal to zero) between several marsh complexes (MM-NRI, BSM-CIM, and NRM-BSM). Finally, none of the fish in this study were detected at either of the two stations located in the northern part of North River (stations 6 and 16), suggesting that tagged fish did not move to marsh complexes in the upper River. Extending the time lag between primary and subsequent detections resulted in very similar patterns of residency within BSM, MM, and NRM. The likelihood of being detected in the same marsh complex 48 hours and 1 week later remained >86% in all three marsh complexes. Conversely, fish originally observed in CIM had zero
Discussion
Patterns of red drum dispersal, activity space, and residency suggested limited movement between similar saltmarsh complexes by a mobile fish during our five-month study. Dispersal and cumulative activity space metrics indicated that there was minimal sustained occupation of areas outside of the MM complex prior to emigration from the entire study array (further supported by fishermen recapture data). Residency analysis also corroborated dispersal and activity-space data; further suggesting limited movement between the marsh complexes we monitored. Thus, our results imply that red drum induce minimal linkages among these spatially separated habitat complexes on a sub-annual scale.
Limited seascape connectivity in this study highlights the potential for these saltmarsh complexes to represent relatively isolated, discrete food webs within the estuary (Sheaves 2009). This runs counter to suggestions that mobile consumers facilitate nutrient exchange within estuaries through consumption and excretion, and may impact primary productivity in adjacent habitats when consumer movement between habitats is high (Allgeier et al. 2013; Hyndes et al. 2014). Rather our results suggest that consumer-driven transfer of nutrients may be primarily a local phenomenon, with relatively tighter recycling within each marsh complex. Additionally, red drum could potentially impose greater predation pressure locally on their prey if movement away from their preferred marsh complex is limited. Conversely, seasonally high abundances of food resources throughout the lower estuary could provide fitness incentives to limit movement away from MM, or any marsh complex in the lower North River (Dudley and Judy 1973; Williams 1955).
amount of time fish rely on those habitats and the benefits they provided to the success of the population, weigh heavily when evaluating habitat value (sensu Nagelkerken et al. 2015). Although red drum demonstrated high levels of residency within MM in this study, comparing this marsh complex as a preferred location to the alternative complexes is beyond the scope of this study given a potential bias in releasing all fish within this marsh complex. Nonetheless, we expect that red drum would behave in a similar manner if released in other marsh complexes due to similarities in fauna and habitat (Baillie et al. 2015). The few individuals (three) that moved into one of the alternative marsh complexes for extended periods during the study, with the exception of fish moving to CIM, displayed high residency for their new location. Although two of these fish returned to their initial capture location in NRM, there is little evidence suggesting that red drum movement is influenced by any homing behavior such as that previously
documented for some large bodied fish (Taylor et al. 2017). Fourteen of the sixteen individuals initially captured in NRM remained in the MM system during the study and only two out of thirty translocated fish were observed returning to their initial capture location. Reflecting the results observed in this study, other fish in the population would be suggested to maintain high levels of residency within the marsh complex they occupy.
Ontogenetic migrations of red drum generally shift the distribution of 1-3 year-old fish to lower, more saline portions of coastal estuaries (Bacheler et al. 2009b). However, this pattern is not all inclusive as two-year-old fish, equivalent to those used in our study, are still known to occupy low salinity (< 10 ppt) waters of North Carolina estuaries (Bacheler et al. 2009a)
limited number of fish (four) were detected as far up-estuary as NRM (Fig 1.1). Our data contribute to the growing consensus in the literature that suggests red drum rarely move upstream as sub-adults (Dresser and Kneib 2007; Bacheler 2009b). Occupation of the upper estuary by similar age class fish is likely a result of individuals either settling in this region and remaining or individuals arriving during spring months when a large portion of the sub-adult population re-enter and distribute within the estuaries (Bacheler et al. 2009b). Connectivity among upper estuary and lower estuary seascapes therefore is likely influenced more by ontogenetic migrations or suggested re-entry of the red drum population into the estuary. The mechanism driving this subpopulation structure deserves further research attention.
drum are not consistently connecting distinct marsh complexes within this estuary. Following the flow of energy within coastal ecosystems is important for understanding the values and
contributions of individual towards productivity within an estuary (Heck et al. 2008). Although these assumptions are speculative without direct measurements of nutrient exchange within the system, identifying the movement behaviors of fish with the capacity to facilitate this nutrient exchange is critical to identifying potential energy transport dynamics within this estuary.
The spatial and temporal scale at which ecological processes are observed can influence our understanding of dynamics within an ecosystem (Levine1992). For instance, over the time frame of this study, the distance between marsh complexes could play a crucial role in assessing linkages among them (i.e., marshes in our study were relatively far apart and therefore
connectivity was low). However, considering previously reported daily movements for red drum (3.4 ± 0.6 km; Dance and Rooker 2015), we do not anticipate that this drove our results. On average, the straight-line distance between marsh complexes in our array was less than two kilometers, except for the distances between BSM and both CIM and NRM, which were each ~5 km. We do acknowledge, however, that the location of MM in the middle of the study array could have contributed to the higher degree of connectivity of this marsh complex relative to the other complexes we monitored.
support previous studies suggesting that individual red drum express high residency in specific locations (Dresser and Kneib 2007; Bacheler et al. 2009b; Reyier et al. 2011; Dance and Rooker 2015). Even fish that moved out of the study array did not appear to disperse with any apparent regularity. The lack of any defined relationship between time at liberty and distance from where they were released suggests that over the course of that time frame, those individuals likely established temporary residency in other locations along the route to the where they were
recaptured. Future research could build off this study to further explore the dynamics of estuarine scale seascape linkages (e.g. between lower and upper estuary) as well as marsh complex
specific residency patterns.
Acknowledgements
REFERENCES
Able, K.W., Vivian, D.N., Petruzzelli, G., and Hagan, S.M. 2012. Connectivity Among Salt Marsh Subhabitats: Residency and Movements of the Mummichog (Fundulus heteroclitus). Estuaries and Coasts 35(3): 743–753. doi:10.1007/s12237-011-9471-x.
Afonso, P., Fontes, J., Holland, K.N., and Santos, R.S. 2009. Multi-scale patterns of habitat use in a highly mobile reef fish, the white trevally Pseudocaranx dentex, and their implications for marine reserve design. Mar. Ecol. Prog. Ser. 381(2): 273–286. doi:10.3354/meps07946. Allgeier, J.E., Yeager, L.A., and Layman, C.A. 2013. Consumers regulate nutrient limitation
regimes and primary production in seagrass ecosystems. Ecology 94(2): 521–529. Bacheler, N.M., Paramore, L.M., Buckel, J.A., and Hightower, J.E. 2009. Abiotic and biotic
factors influence the habitat use of an estuarine fish. Mar. Ecol. Prog. Ser. 377: 263–277. doi:10.3354/meps07805.
Bacheler, N.M., Paramore, L.M., Burdick, S.M., Buckel, J. a., and Hightower, J.E. 2009. Variation in movement patterns of red drum (Sciaenops ocellatus) inferred from conventional tagging and ultrasonic telemetry. Fish. Bull. 107: 405–419.
Baggio, J. a., Salau, K., Janssen, M. a., Schoon, M.L., and Bodin, Ö. 2011. Landscape connectivity and predator-prey population dynamics. Landsc. Ecol. 26: 33–45. doi:10.1007/s10980-010-9493-y.
Baillie, C.J., Fear, J.M., and Fodrie, F.J. 2015. Ecotone Effects on Seagrass and Saltmarsh Habitat Use by Juvenile Nekton in a Temperate Estuary. Estuaries and Coasts 38: 1414– 1430. doi:10.1007/s12237-014-9898-y.
Barbour, A.B., Adams, A.J., and Lorenzen, K. 2014. Size-based, seasonal, and multidirectional movements of an estuarine fish species in a habitat mosaic. Mar. Ecol. Prog. Ser. 507: 263– 276. doi:10.3354/meps10837.
Beets, J., Muehlstein, L., Haught, K., and Schmitges, H. 2003. Habitat Connectivity In Coastal Environments: Patterns and Movements of Caribbean Coral Reef Fishes With Emphasis On Bluestriped Grunt. Gulf and Car. Res. 14(2): 29–42. doi:10.18785/gcr.1402.03.
Berkström, C., Gullström, M., Lindborg, R., Mwandya, A.W., Yahya, S.A.S., Kautsky, N., and Nyström, M. 2012. Exploring “knowns” and “unknowns” in tropical seascape connectivity with insights from East African coral reefs. Estuar. Coast. Shelf Sci. 107: 1–21. Elsevier Ltd. doi:10.1016/j.ecss.2012.03.020.
Boström, C., Pittman, S.J., Simenstad, C., and Kneib, R.T. 2011. Seascape ecology of coastal biogenic habitats: Advances, gaps, and challenges. Mar. Ecol. Prog. Ser. 427: 191–217. doi:10.3354/meps09051.
Dance, M.A., and Rooker, J.R. 2015. Habitat- and bay-scale connectivity of sympatric fishes in an estuarine nursery. Estuar. Coast. Shelf Sci. 167: 447–457. Elsevier Ltd.
doi:10.1016/j.ecss.2015.10.025.
Dresser, B.K., and Kneib, R.T. 2007. Site fidelity and movement patterns of wild subadult red drum, Sciaenops ocellatus (Linnaeus), within a salt marsh-dominated estuarine landscape. Fish. Manag. Ecol. 14: 183–190. doi:10.1111/j.1365-2400.2007.00526.x.
Drymon, J.M., Ajemian, M.J., and Powers, S.P. 2014. Distribution and dynamic habitat use of young bull sharks Carcharhinus leucas in a highly stratified Northern Gulf of Mexico estuary. PLoS One 9(5): 1–12. doi:10.1371/journal.pone.0097124.
Dudley, D.L., and Judy, M.H. 973. Seasonal Abundance and Distribution of Juvenile Blue Crabs in Core Sound N.C. 1965-68. Chesap. Sci. 14(1): 51–55.
Ergon, T., and Gardner, B. 2013. Separating mortality and emigration: modelling space use, dispersal and survival with robust-design spatial capture-recapture data. Methods Ecol. Evol.: 1–10. doi:10.1111/2041-210X.12133.
Facendola, J.J., and Scharf, F.S. 2012. Seasonal and Ontogenetic Variation in the Diet and Daily Ration of Estuarine Red Drum as Derived from Field-Based Estimates of Gastric
Evacuation and Consumption. Mar. Coast. Fish. 4(1): 546–559. doi:10.1080/19425120.2012.699018.
Fodrie, F.J., Yeager, L.A., Grabowski, J.H., Layman, C.A., Sherwood, G.D., and Kenworthy, M.D. 2015. Measuring individuality in habitat use across complex landscapes: approaches, constraints, and implications for assessing resource specialization. Oecologia 178(1): 75– 87. Springer Berlin Heidelberg. doi:10.1007/s00442-014-3212-3.
Hammerschlag, N., Heithaus, M.R., and Serafy, J.E. 2010. Influence of predation risk and food supply on nocturnal fish foraging distributions along a mangrove – seagrass ecotone. Mar. Ecol. Prog. Ser. 414: 223–235. doi:10.3354/meps08731.
Heck Jr, K.L., Carruthers, T.J.B., Duarte, C.M., Randall, A., Kendrick, G., Orth, R.J., and
Williams, S.W. 2008. Trophic Transfers from Seagrass Meadows Subsidize Diverse Marine and Terrestrial Consumers. Ecosystems 11: 1198–1210. doi:10.1007/s10021-008-9155-y. Hyndes, G.A., Nagelkerken, I., Mcleod, R.J., Connolly, R.M., Lavery, P.S., and Vanderklift,
Ketchum, J.T., Hearn, A., Klimley, A.P., Peñaherrera, C., Espinoza, E., Bessudo, S., Soler, G., and Arauz, R. 2014. Inter-island movements of scalloped hammerhead sharks (Sphyrna lewini) and seasonal connectivity in a marine protected area of the eastern tropical Pacific. Mar. Biol. 161(4): 939–951. doi:10.1007/s00227-014-2393-y.
Levin, S.A. 1992. The Problem of Pattern and Scale in Ecology: The Robert H. MacArthur Award Lecture Author(s): Simon A. Levin Source: Ecology 73(6): 1943–1967. doi:10.2307/1941447.
McCauley, D.J., Young, H.S., Dunbar, R.B., Estes, J. a., Semmens, B.X., and Micheli, F. 2012. Assessing the effects of large mobile predators on ecosystem connectivity. Ecol. Appl.
22(6): 1711–1717. doi:10.1890/11-1653.1.
Martin, C.W., Fodrie, F.J., Heck, K.L., and Mattila, J. 2010. Differential habitat use and antipredator response of juvenile roach (Rutilus rutilus) to olfactory and visual cues from multiple predators. Oecologia 162(4): 893–902. doi:10.1007/s00442-010-1564-x.
McMahon, K.W., Berumen, M.L., and Thorrold, S.R. 2012. Linking habitat mosaics and connectivity in a coral reef seascape. Proc. Natl. Acad. Sci. 109: 15372–15376. doi:10.1073/pnas.1206378109.
Meyer, J.L., Schultz, E.T., and Helfman, G.S. 1983. Fish Schools: An Asset to Corals. Science (80-. ). 220(4601): 1047–1049.
Nagelkerken, I., Sheaves, M., Baker, R., and Connolly, R.M. 2015. The seascape nursery: A novel spatial approach to identify and manage nurseries for coastal marine fauna. Fish Fish.
16(2): 362–371. doi:10.1111/faf.12057.
Olds, A.D., Pitt, K.A., Maxwell, P.S., and Connolly, R.M. 2012. Synergistic effects of reserves and connectivity on ecological resilience. J. Appl. Ecol. 49(6): 1195–1203.
doi:10.1111/jpe.12002.
Polis, G.A., Anderson, W.B., and Holt, R.D. 1997. TOWARD AN INTEGRATION OF
LANDSCAPE AND FOOD WEB ECOLOGY: The Dynamics of Spatially Subsidized Food Webs. Annu. Rev. Ecol. Syst. 28: 289–316.
Popple, I.D., and Hunte, W. 2005. Movement patterns of Cephalopholis cruentata in a marine reserve in St Lucia, W.I., obtained from ultrasonic telemetry. J. Fish Biol. 67: 981–992. doi:10.1111/j.0022-1112.2005.00797.x.
Rosenblatt, A.E., and Heithaus, M.R. 2011. Does variation in movement tactics and trophic interactions among American alligators create habitat linkages? J. Anim. Ecol. 80: 786–798. doi:10.1111/j.1365-2656.2011.01830.x.
Scharf, F.S., and Schlight, K.K. 2000. Feeding Habits of Red Drum (Sciaenops ocellatus) in Galveston Bay, Texas: Seasonal Diet Variation and Predator-Prey Size Relationships. Estuaries 23(1): 128. doi:10.2307/1353230.
Secor, D.H., Rooker, J.R., Zlokovitz, E., and Zdanowicz, V.S. 2001. Identification of riverine, estuarine, and coastal contingents of Hudson River striped bass based upon otolith elemental fingerprints. Mar. Ecol. Prog. Ser. 211(1968): 245–253.
doi:10.3354/meps211245.
Sheaves, M. 2009. Consequences of ecological connectivity: the coastal ecosystem mosaic. Mar. Ecol. Prog. Ser. 391: 107–115. doi:10.3354/meps08121.
Simpfendorfer, C. a, Heupel, M.R., and Hueter, R.E. 2002. Estimation of short-term centers of activity from an array of omnidirectional hydrophones and its use in studying animal movements. Can. J. Fish. Aquat. Sci. 59: 23–32. doi:10.1139/f01-191.
TABLES
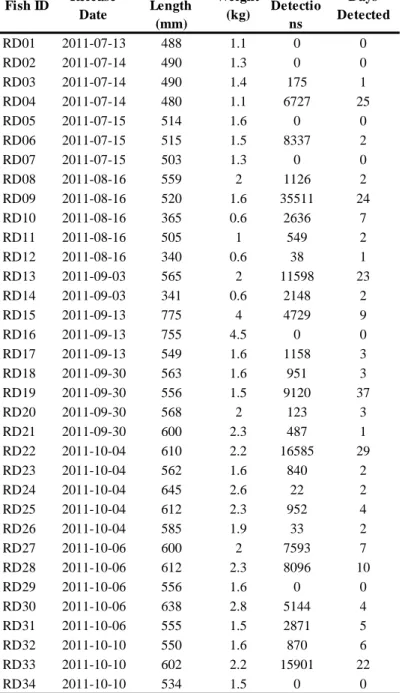
Table 1.1 Summary of 34 red drum tagged with acoustic transmitters and tracked within the array of VEMCO hydrophones within the Back Sound Estuary in central North Carolina. Fish ID’s marked with an asterisk are fish that were recaptured by fishermen. Capture location indicates where fish were originally caught for this study: Jarret Bay (JB), North River Marsh (NRM), Middle Marsh (MM), Carrot Island Marsh (CIM), and Northern North River (NNR).
Fish ID Capture Location Release Date Total Length (mm) Weight (kg) Total Detections S tations Visited Marsh Complexes Visited Days at Liberty (acoustics) Days at Liberty (recapture) Distance to recapture (km)
RD01 JB 7/13/2011 488 1.1 249 10 3 4 -
-RD02 JB 7/14/2011 490 1.3 9 1 1 3 -
-RD03* JB 7/14/2011 490 1.4 0 0 0 0 420 5.13
RD04 JB 7/14/2011 480 1.1 977 2 1 23 -
-RD05 JB 7/15/2011 514 1.6 396 4 2 15 -
-RD06 JB 7/15/2011 515 1.5 15 1 1 3 -
-RD07 JB 7/15/2011 503 1.3 126 5 1 126 -
-RD08 NRM 8/16/2011 559 2 550 11 3 76 -
-RD09 NRM 8/16/2011 520 1.6 499 1 1 37 -
-RD10 NRM 8/16/2011 365 0.6 101 1 1 35 -
-RD11 NRM 8/16/2011 505 1 151 4 1 28 -
-RD12* NRM 8/16/2011 340 0.6 0 0 0 0 425 14.25
RD13 JB 9/3/2011 565 2 14140 6 2 62 -
-RD14 NRM 9/3/2011 341 0.6 138 4 2 30 -
-RD15 NRM 9/13/2011 775 4 2159 9 2 46 -
-RD16 NRM 9/13/2011 755 4.5 38 3 1 1 -
-RD17* NRM 9/13/2011 549 1.6 2610 8 3 34 2 0 RD18* NRM 9/30/2011 563 1.6 1199 5 1 32 39 38
RD19 M M 9/30/2011 556 1.5 896 2 1 43 -
-RD20* CIM 9/30/2011 568 2 736 7 2 49 54 2.88
RD21 NRM 9/30/2011 600 2.3 2316 4 1 26 -
-RD22 M M 10/4/2011 610 2.2 636 5 2 31 -
-RD23 NRM 10/4/2011 562 1.6 110 6 3 5 -
-RD24* NNR 10/4/2011 645 2.6 1361 7 2 49 50 0 RD25* NRM 10/4/2011 612 2.3 301 9 2 7 7 5.86
RD26 NRM 10/4/2011 585 1.9 700 6 2 48 -
-RD27 JB 10/6/2011 600 2 1128 7 2 21 -
-RD28 JB 10/6/2011 612 2.3 6786 10 2 75 -
-RD29 M M 10/6/2011 556 1.6 193 4 2 52 -
-RD30* NNR 10/6/2011 638 2.8 105 3 1 7 10 9.21
RD31 NRM 10/6/2011 555 1.5 1 1 1 1 -
-RD32 NRM 10/10/2011 550 1.6 12721 9 3 70 - -RD33* CIM 10/10/2011 602 2.2 314 2 2 25 179 1.83
-Table 1.2 Connectivity matrix indicating the number (N) of randomly selected detections for each marsh complex and non-marsh sites and the location probabilities (%) of subsequent
detection after A) 24 hours, B) 48 hours, and C) 1 week. Marsh complex names are: Back Sound Marsh (BSM), Carrot Island Marsh (CIM), Middle Marsh (MM), and North River Marsh
(NRM).
FIGURES
Figure 1.2 Dispersal patterns for red drum throughout the study based on distributions of the three metrics measured, (total detections, number of fish, and relative occurrence) at
CHAPTER 2: SPATIAL CONFIGURATION OF HABITAT WITHIN AN ESTUARINE SEASCPE MOREINFLUENTIAL THAN IDENTITY AND AVAILABILITY IN
DETERMINING SELECTIVY BY A MOBILE PREDATORY FISH
Introduction
Identifying essential habitats which are most conducive to rapid growth and/or increased survival in fishes is a central component of efforts to conserve and protect estuarine habitats and ensure the sustainability of fish populations (Dahlgren et al. 2006, Bostrom et al. 2011). Key to achieving this management objective is understanding the basic habitat requirements of fish within the ecosystem. In coastal estuarine ecosystems which are composed of a variety of spatially heterogeneous but functionally connected habitats (i.e., seascapes), identifying high-quality fish habitat remains challenging (Beck et al. 2001). Estuarine dependent fishes in particular have complex habitat requirements during their life cycle which can vary along
spatiotemporal gradients due to ontogenetic migration (Bacheler et al. 2009), predator avoidance behavior (Hammerschlag et al. 2010), foraging behavior (Hammerschlag-Peyer and Layman 2010), and individual specialization in behavior (Fodrie et al. 2015). Rigorous quantitative data on multi-scale habitat utilization by fishes will help stakeholders allocate limited financial and material
resources towards the conservation of high value habitats to ensure sustainable fish populations.
been demonstrated to vary with estuary geomorphology and ocean connectivity (Schrandt et al. 2018). At smaller spatial scales, spatial configuration of individual habitat patches within the seascape has been demonstrated to have significant implications on species distribution (Pittman et al. 2007, Baillie et al. 2015), predator foraging behavior (Micheli and Peterson 1999), food web dynamics (Polis et al. 1997), estuarine scale habitat connectivity (Kenworthy et al. 2018), species diversity (Yaeger et al. 2016), and function of restored habitats (Keller et al. accepted, Ziegler et al. 2018). Therefore, in order to maintain the structure and function of particular habitats, ecologists need to develop a better understanding of fish-habitat associations within the context of the larger seascape in addition to focusing on individual habitat classification.
Generating quantifiable metrics identifying the value of fish habitat is challenging
(Garshelis 2000). Quantifying levels of habitat use for fish is particularly challenging in estuarine environments where a number of biotic (i.e. foraging and reproductive behaviors) and abiotic (i.e. temperature, salinity and DO) processes are acting on estuarine fish movement and
Evaluating habitat value using demographic data provides knowledge of species abundance and distribution, although these data alone are limited in assessing selective
preference for available habitats within estuarine seascapes. Because the abundance of various resources (e.g., habitat) is not uniform in nature, a more informative evaluation of selection and preference for individual habitat patches must consider both habitat use and habitat availability (Garshelis et el. 2000). Habitat selectivity thus can be quantified according to the
disproportionate selection for or avoidance of available habitats resulting from choice rather than haphazardly wandering within the environment (Johnson 1980, Manly et al. 2002). In this study we combine high resolution (sub-meter) acoustic tracking data with fine scale data of habitat distribution within an estuarine marsh complex to assess fish habitat selectivity for red drum (Sciaenops ocellatus). We ask two primary questions regarding habitat selectivity of red drum within this system: 1) Do red drum display selective preference for or avoidance of individual habitat classifications relative to their availability within the environment? and 2) Does spatial configuration of individual habitat patches within the seascape influence habitat selection for red drum?
Methods
Study site
restored habitats. Previous studies have indicated that large predatory fish like red drum
frequently access these embayments within Middle Marsh (Grabowski et al. 2005, Kenworthy et al. 2018). Thus, we were able to explore habitat selectivity and movement behavior in a natural, open seascape composed of a variety of habitat classifications.
Using high resolution (<1m) aerial imagery, we delineated the following habitat types: 1) Sand—areas of bare, smooth substrate generally in the central portion of the study area; 2) Halo—bands of bare substrate 3–5 m in width that separated marsh and seagrass habitats. Halo bottoms were qualitatively muddier and had greater Lebensspuren densities than sand bottoms; 3) Seagrass—mixed Zostera marina and Halodule wrightii distributed as contiguous and patchy meadows across the study area; 4) Marsh—flooded Spartina alterniflora along the perimeter of the study area; 5) Fringing shell—loose, naturally occurring aggregates of both living and dead shell bordering marsh habitat (<25 oysters m−2); 6) Reef (salt marsh; SM); natural and restored oyster reefs immediately adjacent to marsh habitat (>100 oysters m−2). Unlike fringing shell, reefs were consolidated, raised features within the embayment; 7) Reef (seagrass; SG)—restored oyster reefs immediately adjacent to seagrass habitat and isolated from salt marsh; 8) Reef (sand flat; SF)—restored oyster reefs surrounded by a sand matrix and isolated from other structured habitats. With the exception of the reef adjacent to seagrass, all other oyster reefs in this system were intertidal.
Individual habitats within the embayment were mapped using satellite images obtained through the National Oceanic and Atmospheric Administration data bases (Geo-Eye and World View; early and middle periods) and eMap International (IKONOS;
boundary positions collected using a Trimble RTK-GPS. To account for seasonality in seagrass cover (i.e., Zostera senescence due to heat stress), aerial images from three separate dates during the study were acquired for delineation of habitat boundaries. Thus, habitat use was evaluated during three time periods consisting of equal duration (early, July 15 up to and including August 30; middle, September 1 up to and including October 14; and late, October 15 up to and
including 30 November). Study Species
Red drum (Sciaenops ocellatus), common in estuaries from Virginia to Texas, is highly sought after by recreational fisherman. As sub-adults (up to age 5), individuals inhabit estuarine environments and forage on small fishes and crustaceans (Scharf and Schlight 2000). Red drum are often considered habitat generalists because they commonly occupy a variety of estuarine habitats across a wide range of salinities in temperate estuaries including salt marshes, seagrass, and oyster reefs (Bacheler et al. 2009, Fodrie et al. 2015, Kenworthy et al. 2018). Because of the variety of habitats used by this species, a working hypothesis is that individuals for this species will utilize the habitat within our study system in proportion to its availability within the seascape.
Tagging and Tracking
while in the study area. Following tag implantation, fish were held for 24 hours for observation before being released into the center of the embayment. Individual fish were released
intermittently starting July 12th, with the last fish being released on October 9th. Once released, red drum were free to enter or exit the study area without further manipulation (data collection began 12 h after release to allow for acclimation). While inside of the embayment, auditory cues should have transmitted far enough to ensure that all habitats were within the ambit of individual red drum; therefore, we are confident that all individuals sampled a common resource (habitat) pool in this study.
We deployed a LOTEK MAP 600 Acoustic Telemetry system to detect acoustic signals emitted from tagged red drum and track their fine-scale habitat use. The MAP 600 uses 8 fixed hydrophones positioned to allow “line-of-sight” detection of coded signals from LOTEK
transmitters. Fish positions with sub-meter accuracy were generated when signals were detected by at least three hydrophones within the array. Hydrophones were positioned within the
embayment to maximize overall coverage while providing reliable detection of tagged red drum within the target habitats. Position data was superimposed on habitat maps generated for each study period to quantify the volume of detections within each habitat classifications for individual fish
Habitat Selection Indices
Habitat preference was quantified using approaches derived from studies examining diet selectivity (Johnson 1980, Lechowicz 1982, Manly et al. 2002). Habitat selection indices (HSI) identified each fish’s preference or avoidance of individual habitat classifications within the study area. Habitats chosen at random would mirror availability, whereas preference or
We used individual fish positions as our observational unit for habitat use analysis. This index was calculated by dividing each fish’s proportion of positions within each habitat by the
proportional availability of each respective habitat during individual time periods. We used log values of each quantified HSI for analysis, thus the degree of preference or avoidance for individual habitat classifications was identified by the degree of deviation in a positive
(preference for) or negative (avoidance of) direction from a value of 0. Because of the potential bias of individual fish with disproportionately higher number of positions “swamping” observed trends in habitat use, we quantified the weighted mean HSI for comparisons between habitat classification and time periods. Each fishes’ HSI was weighted by the individual’s proportion of detections within each time period. Habitat selection indices were quantified for each habitat individually as well as all oyster reef habitats combined during each study period.
We quantified availability of each habitat classification after accounting for differences in habitat accessibility across the tidal cycle. Shallow habitats (e.g., oyster reefs) were accessible less often than deeper habitats (e.g. seagrass) thus affecting use-availability analysis. Water level data collected from a HOBO Water Level Logger (Onset Computer Corporation; ± 0.3 cm accuracy) located near the study site was integrated with bathymetry maps of the embayment to ascertain the spatial coverage (m2) of accessible habitat at ten-minute intervals for each time period. Considering that access to a given habitat is limited by water depth, a habitat patch was only considered available when water depth was greater than 30cm because examination of position data throughout the entire study identified this as the minimum depth at which fish were detected. Bathymetry maps were generated by combining elevation data collected using a
classifications for each time period was quantified as the sum of each ten-minute measurement of spatial coverage (m2).
Results
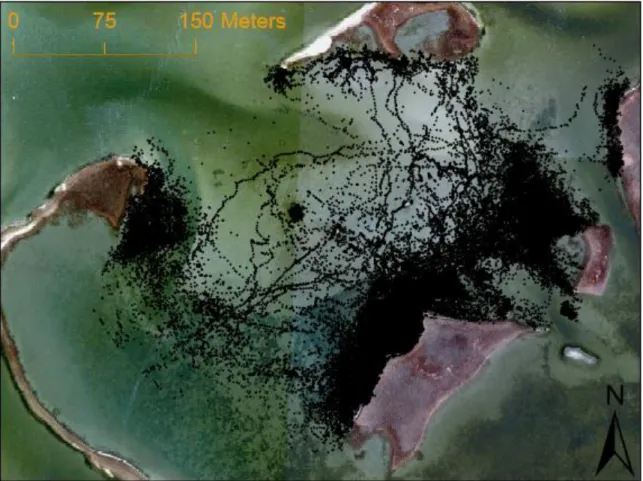
Overall, 144,320 triangulated fish positions were recorded from 27 out of the 34 tagged individuals for analysis of habitat selectivity (5,345 ± 1,485 positions fish-1) (Fig. 2.2). The seven individuals for which no position data was acquired were detected in a companion study (see Kenworthy et al. 2018), indicating that these individuals simply left the array within the initial 12 hours of release without returning. Only three of the 27 fish recorded fewer than 100 positions throughout the entire study. The timing of when fish were released resulted in variable numbers of fish monitored during the early (n = 8; 37,596 detections), middle (n =20; 71,987 detections), and late (n = 10; 34,739 detections) time periods. Thirteen individuals were tracked over multiple time periods.
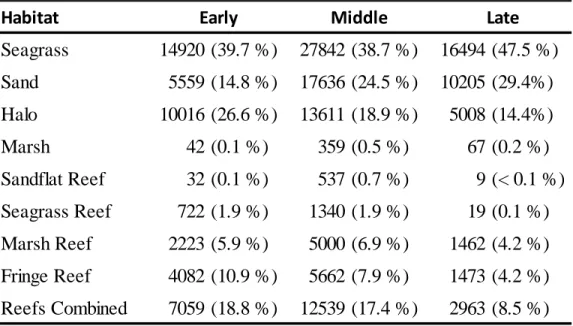
Habitat availability was substantially greater for both seagrass and sand within the array (Table 2.3). This pattern was consistent for each time period regardless of the decline in Zostera due to senescence. During each of the time periods, sand and seagrass habitats combined
comprised approximately 93% of the available habitat. The decline of seagrass from the early (43%) to late (26%) period resulted in a subsequent increase in sand coverage from 50% to 67% during respective time periods. Halo and fringe reef comprised approximately 3% and 2% of the available habitat respectively. The remaining habitats each individually consisted of less than 1% of all available habitat within the array. Minor (< 1%) fluctuations were observed in availability of the reef habitats, likely due to slight variations in water levels recorded during individual time periods.
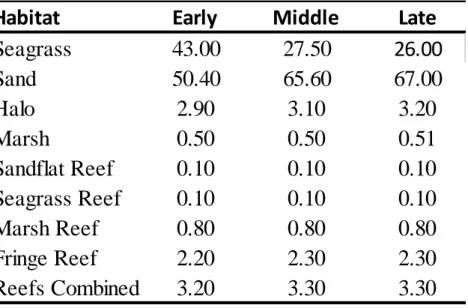
Mean HSI over the course of the study indicated a general avoidance of sand (-0.48) and marsh (-1.48) habitats while generally preferences for the halo (0.68) and oyster reefs (0.50) (Fig. 2.3). Observed selection indices during each individual time period in these respective habitats reflected overall averages (e.g. HSI in sand was consistently negative throughout the study). Although, mean HSI for seagrass (0.04) over the entire study suggested random usage of this habitat, selection indices during the early period (-0.20) indicated modest avoidance
preference or avoidance of the habitat classification during the early (0.01) period; however, there was a notable shift towards avoidance during the middle (-0.34) and late (-1.49) periods.
Discussion
By comparing high resolution position data with rigorous analysis of habitat availability, we were able to identify a gradient of preferences for the variety of habitats available to red drum within this saltmarsh embayment. Regardless of the greater volume of positions located within seagrass and sand, selection indices indicated that these habitats were not the most selected for by fish in this system. We observed the greatest selection for habitats proximate to, but not within, marsh habitat. Isolated habitats (e.g. sandflat reef) along with areas characterized by less structural complexity (e.g. marsh – sand interface) were among the least preferred areas in this study. Variation in habitat selectivity among the different oyster reef classifications corroborated our consensus that landscape setting of individual habitat classifications, rather than overall availability, has a greater influence on habitat selection by red drum in this study.
A major challenge with evaluation of habitat value involves the capacity for generalizing ecological processes and function across broader spatial and temporal gradients (Bostrom et al. 2011). The influence of habitat complexity and connectivity on species assemblages within the seascape is well recognized in estuarine systems (Micheli and Peterson 1999, Sheaves 2009, Kenworthy et al. 2018). The results from our study corroborate these findings as red drum selected for areas of the seascape where multiple habitats converged (i.e., saltmarsh, oyster reef, and seagrass). In a similar study Dance and Rooker (2015) revealed preference for highly
more abundant habitat directly proximate to saltmarsh while in our study oyster reef was most abundant. Complexity and connectivity associated with saltmarsh habitat thus may be more of a suitable predictor of habitat selection by red drum rather than habitat identity or complexity alone. In fact, we also observed increased fish positions at the interface of marshes along the norther and western boundary of the study are which contained more seagrass than oyster reef directly proximate to the salt marsh interface. Furthermore, we did not observe notable
enhancement of fish activity at seagrass reefs where two high structured habitats converge, further corroborating the hypothesis that saltmarsh is a focal habitat feature within seascapes whereas the apparent value of alternative habitat classifications depends on their proximity to this habitat.
Linkages between habitat use and distribution of preferred dietary resources are well documented for a range of fish species and habitats (Rozas and Odum 1988, Lowe et al. 2003, Wenger et al. 2018). Red drum could potentially be selecting these high complexity landscapes to maximize foraging opportunities on blue crabs and small fish, which are known to occur at greater densities in highly connected estuarine environments (Summerson and Peterson 1984, Irlandi and Crawford 1997, Micheli and Peterson 1999). Interestingly though, we also observed a slight increase in selection for seagrass coinciding with a reduction in selectivity for reef habitat as the study progressed from summer into fall. Changes in the configuration and complexity of seagrass associated with senescence of Zostra through the study may explain the shifting selectivity. Red drum were likely less efficient at acquiring preferred prey (i.e. blue crabs) in large dense seagrass meadows during summer; whereas small patchy meadows during the fall potentially facilitated foraging success and notable shifts in habitat preferences (Mahoney et al. 2018). Contrasting these observations however is that red drum did not respond positively to densities of crustaceans, particularly xanthid crabs, which previous studies have demonstrated occur in greater densities at sandflat reefs in this seascape (Grabowski et al. 2005, Ziegler et al. 2018). These data highlight the need for more quantitate understanding of habitat associations across broader spatial and temporal gradients and their implications for shaping food web dynamics in estuarine seascapes.
often challenging using telemetry data. For instance, selection indices identified sand to be the least preferred habitat in this embayment. Examination of individual fish tracks generally
suggested a transiting behavior (identified by straight line paths) rather than foraging (consistent changes in movement direction) when fish positions were within sand habitat. Conversely, results from a hook and line survey from a companion study within this same embayment suggested foraging activity occurred among sand habitats located away from structured oyster reefs (Ziegler et al. 2018). While we evaluated habitat use in terms of positions within each habitat, inference of behavior requires examination of positions through time at a greater resolution. Manual inspection of several fish tracks identified repeated visits to saltmarsh reefs within this embayment. Presumably this activity reflects foraging behavior, although these assumptions would require additional attention. Furthermore, while the halo habitat appeared to be highly selected for in this study, closer observation of detailed fish tracks suggested that this area of the seascape was used more as a corridor for fish transiting parallel to the marsh
interface. Apparent selection for this habitat may in reality be due to its proximity to the saltmarsh interface rather than active selection for some ecological benefit.
habitats to better understand food web dynamics. The general assumptions regarding association with high habitat complexity and connectivity need to be examined in additional seascapes. Red drum occupy a range of habitats within estuarine systems, many which do not contain high abundances of oyster reef habitat. While oyster reef was highly valued in this study, habitat associations will likely vary among various seascapes. Overall, these data provide a better understanding of habitat associations for red drum in this temperate estuarine seascape at a much greater resolution highlighting the need for evaluating the value and function of estuarine
habitats across the entire seascape rather than focusing on limited areas (Nagelkerken et al. 2015).
Acknowledgments
We would like to thank Abigail Poray, Chris Baillie, Michelle Brodeur, Sarah Coleman, and Erin Voigt for their help in the field. We are grateful to Lee Willis and the Red Fish Action Series, as well as Adam Tyler, in helping with fish collections. We thank Dr. Craig Harms for providing training on implanting acoustic transmitters in fish. This work was funded by the North Carolina Marine Resources Fund. (Institutional Animal Care and Use Committee ID:241.0-A.)
REFERENCES
Bacheler NM, Paramore LM, Buckel JA, Hightower JE. 2009. Abiotic and biotic factors
influence the habitat use of an estuarine fish. Marine Ecology Progress Series 377: 263–277. Baggett LP, Powers SP, Brumbaugh RD, Coen LD, Deangelis BM, Greene JK, Hancock BT,
Morlock SM, Allen BL, Breitburg DL, Bushek D, Grabowski JH, Grizzle RE, Grosholz ED, Peyre MK La, Luckenbach MW, Mcgraw KA, Piehler MF, Westby SR, Ermgassen PSE (2015) Guidelines for evaluating performance of oyster habitat restoration. Restor Ecol 23:737–745
Baillie CJ, Fear JM, Fodrie FJ (2015) Ecotone Effects on Seagrass and Saltmarsh Habitat Use by Juvenile Nekton in a Temperate Estuary. Estuaries and Coasts 38:1414–1430
Beck MW, Heck KL, Able KW, Childers DL, Eggleston DB, Gillanders BM, Halpern B, Hays CG, Hoshino K, Minello TJ, Orth RJ, Sheridan PF, Weinstein MP. 2001. The identification, conservation, and management of estuarine and marine nurseries for fish and invertebrates. Bioscience 51: 633.
Boström C, Pittman SJ, Simenstad C, Kneib RT (2011) Seascape ecology of coastal biogenic habitats: Advances, gaps, and challenges. Mar Ecol Prog Ser 427:191–217
Bradley M, Baker R, Nagelkerken I, Sheaves M. 2019. Context is more important than habitat type in determining use by juvenile fish. Landscape Ecology 34: 427–442.
Dahlgren CP, Kellison GT, Adams AJ, Gillanders BM, Kendall MS, Layman CA, Ley JA, Nagelkerken I, Serafy JE (2006) Marine nurseries and effective juvenile habitats: concepts and applications. Mar Ecol Prog Ser 312:291–295
Dance MA, Rooker JR (2015) Habitat- and bay-scale connectivity of sympatric fishes in an estuarine nursery. Estuar Coast Shelf Sci 167:447–457
Dresser BK, Kneib RT (2007) Site fidelity and movement patterns of wild subadult red drum, Sciaenops ocellatus (Linnaeus), within a salt marsh-dominated estuarine landscape. Fish Manag Ecol 14:183–190
Fodrie FJ, Yeager LA, Grabowski JH, Layman CA, Sherwood GD, Kenworthy MD. 2015. Measuring individuality in habitat use across complex landscapes: approaches, constraints, and implications for assessing resource specialization. Oecologia 178: 75–87.
Garshelis DL (2000) Delusions in Habitat Evaluation: Measuring Use, Selection, and Importance. In: Paerl MC, Boitani L, Fuller TK (eds) Research Techniques in Animal Ecology, 1st edn. Columbia University Press, New York, p 111–164