Erry Rismawan, Ida Nahriah IJSRE Volume 05 Issue 10 October 2017 Page 6882 Volume||5||Issue||10||October-2017||Pages-6882-6895||ISSN(e):2321-7545 Website: http://ijsae.in Index Copernicus Value- 56.65 DOI: http://dx.doi.org/10.18535/ijsre/v5i10.03
Analyze Performace Measure Using Balanced Scorecard
Authors
Erry Rismawan1, Ida Nahriah2 1
lecturer Mercu Buana University Indonesia
2
Student Mercu Buana University Indonesia Email- [email protected] ABSTRACT
This research is intended to measure and the company’s capability by four perspective Balanced Scorecard, identification and measure achievement of Critical Success Factor in every perspective. This research is also using Analytical Hierarchy Process (AHP) to determine behalf weight every refuses fathom and aught perspective. The result of measurement shows that capability on year 2013, 2014 and 2015 financial perspective : 1.01 (2013), 1.284 (2014), 1.04 (2015), Customer Perspective : 1.48 (2013), 1.58 (2014), 1.48 (2015), Internal Business Perspective : 1.30 (2013), 1.30 (2014), 1.32 (2015), Learning and Growth Perspective : 1.45 is always consistent and stable.
Keywords : company’s performance, balanced scorecard, key performance indicator
INTRODUCTION
PT. Kito Indonesia is a subsidiary of Kito Corporation located in Japan, where its subsidiaries are spread across 14 countries including Indonesia. PT. Kito Indonesia as a 5-year-old manufacturing company already has customers from Japanese, foreign or local companies located in Indonesia. But it can not guarantee the achievement of sales targets PT. Kito Indonesia. It can be seen from the sales value obtained by PT. Kito Indonesia for the last 3 years.
Figure 1. Achieving Sales Value PT. Kito Indonesia against the value of the reservation (In Hundreds of Million)
Not reaching customer demand is due PT. Kito Indonesia produces and distributes its products in accordance with orders from its customers and does not dare to raise the stock stock level higher in order to follow the fluctuations in customer demand. This is because the fluctuation of customer demand and demand is different from the forecast given earlier and discontinue information from the customer is also shorter than the lead time order. There are times when PT. Kito Indonesia is not able to meet the spike in customer demand in a timely manner or in accordance with the requested amount. Where in each year there is still the
Erry Rismawan, Ida Nahriah IJSRE Volume 05 Issue 10 October 2017 Page 6883
difference between the number of orders received by PT. Kito Indonesia from customers with products that can be met. This means that the company's performance in meeting customer demand is not 100% and this can lead to complaints from customers.
Currently, performance measurement is only seen from the value of sales or financial perspective only. If the sales value of PT. Kito Indonesia has met the target and positively valued to the business profit then the company's performance is said to be good. Whereas in achieving the target is also required a good performance in a nonfinancial perspective. Because until now PT. Kito Indonesia has not been able to reach customer demand with target 100%
To meet the target of 100% customer demand by doing premium freight has caused a complaint from the Sales Department and Finance and Accounting Department PT. Kito Indonesia that the supply of goods passtrough often losers. Whereas the achievement of business process performance of PT. Kito Indonesia has not reached 100% alone is losing money, let alone 100% performance. This loss can be seen from the value of operating costs are large enough to reduce profits.
LITERATURE REVIEW Company Performance
According to Stoner and Freeman in his book Management (1996: 6), the company's performance is "The measure of how well organization do their job". The main purpose of performance evaluation is to motivate employees in achieving the goals of the organization and in complying with predefined standards of behavior, in order to produce the desired actions and results.
Balanced Scorecard
The Balanced Scorecard (BSC) is used as a measurement tool in order to measure an organization’s performance in both public and private sectors to achieve the key business strategies and objectives. The BSC was first developed in early 1990s by Robert Kaplan and David Norton at the Harvard Business School. As the key problem that they identified is many organizations had tendency to manage their businesses based on financial measures while they actually may have worked well in earlier. Moreover, the tempo of business nowadays significantly needs greater and more comprehensiveness of measurement to eventually become successful in further pace of business firms.
Figure 2. Four perspectives of Balanced Scorecard
1) Customer perspective: this element is a measurement of the customers’ satisfaction as well as their accomplishment requirements.
2) Internal business process perspective: this perspective is used to measure the critical-to-customer process requirements and measures.
Erry Rismawan, Ida Nahriah IJSRE Volume 05 Issue 10 October 2017 Page 6884
4) Learning and growth perspective: this perspective will be concentrating on how organizations train and educate their employee, gain and capture their knowledge, and how organization utilized it to maintain a competitive edge within their markets
Analytical Hierarchy Process (AHP)
The working principle of AHP is the simplification of a complex problem that is unstructured, strategic, and dynamic into its parts, and arranging in a hierarchy subjectively about the significance of these variables and then synthesized to determine the variables that have high priority and role to influence the results on the system The.
AHP allows to give the relative weight value of a multiple criterion (or multiple alternative against a criterion), ie by pairwise comparisons (Charisma, 2013). Dr. Thomas L. Saaty, the AHP maker, then determines a consistent way to change pairwise comparisons, into a set of numbers that represent the relative priorities of each criterion and alternative.
Key Performance Indicator (KPI)
The Key Performance Indicator (KPI) is often referred to as the Key Success Indicator (KSI) is a quantitative tool for improving the performance of an activity that is a key factor in organizational success. KPIs assist organizations to identify and measure progress of organizational goals after the mission, stakeholders, and objectives have been defined and analyzed
(Moeheriono:2012).
METHOD Research Design
The approach used in this research is descriptive method with qualitative and quantitative modification approach in processing information that will be used as quantitative data in processing information that will be used as research data.
Operational Definition and Variable Measurement
The research variables used are firm performance (Kaplan and Norton, 2000). Operationally this research is done by determining the main criteria and sub criteria. The main criteria are 4 balanced scorecard perspectives and the sub criteria are KPI. The proposed KPI is in accordance with the perspective in the balanced scorecard and is processed with the help of Expert Choice software.
Erry Rismawan, Ida Nahriah IJSRE Volume 05 Issue 10 October 2017 Page 6885 Primary Data
Primary data is a source of data obtained directly from the original source. The methods used to obtain primary data are: (1) survey method and (2) observation method, and (3) through questionnaire filled by respondent.
Secondary Data
Secondary data is a source of research data obtained by researchers indirectly through intermediary media. In this study which became secondary data is a variety of literature related to the topic and research problems such as books, journals, newspapers, internet.
Data Analysis Technique
The method of data analysis is using Analytic Hirarchy Process (AHP) by weighted pairwise comparison between perspectives in general and comparison of each KPI used to measure company performance in PT. Kito Indonesia. For data processing alone used Expert Choice software Ver 11 to facilitate the calculation and can be more accurate and objective.
The main idea in this research is to determine Key Performance Indicator (KPI) on performance process at PT. Kito Indonesia. So the things that need to be done in this research are as follows:
Mapping work system of PT. Kito Indonesia
Identify the Key Performance Indicator (KPI) that can be used to measure organizational success with 4 perspectives in the Balanced Scorecard.
KPI validation by sending questionnaires related to the use of KPI that has been determined so that the validation resulted in the form of approval or disagreement of the proposed KPI.
Weighting
Data processing company Formation of Objective Matrix
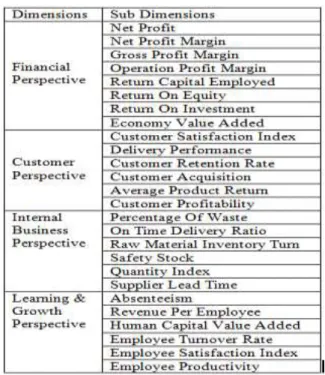
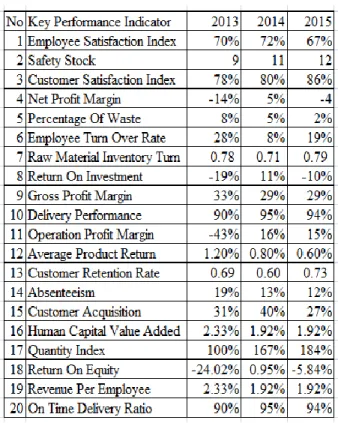
RESEARCH RESULT AND DISCUSSION Table II A. Proposing Key Performance Indicator
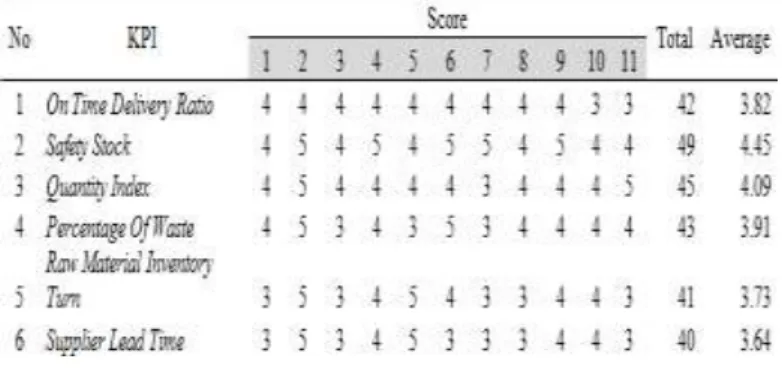
Erry Rismawan, Ida Nahriah IJSRE Volume 05 Issue 10 October 2017 Page 6886 Table IV. Selection of KPI Internal Business Perspective
Table V. Selection of KPI Learning & Growth Perspective
Based on the weighting results for all perspectives it is concluded that 5 indicators are taken for each perspective where the indicator is taken from the 5 indicators with the largest ranking or based on the level that is considered the most important. This is so that each perspective has the same number of indicators.
Table VI. Key Performance Indicator used for Company Performance measurement
Erry Rismawan, Ida Nahriah IJSRE Volume 05 Issue 10 October 2017 Page 6887
20 KPIs based on the perspective of Balanced Scorecard approach. Analytical Hierarchy Process
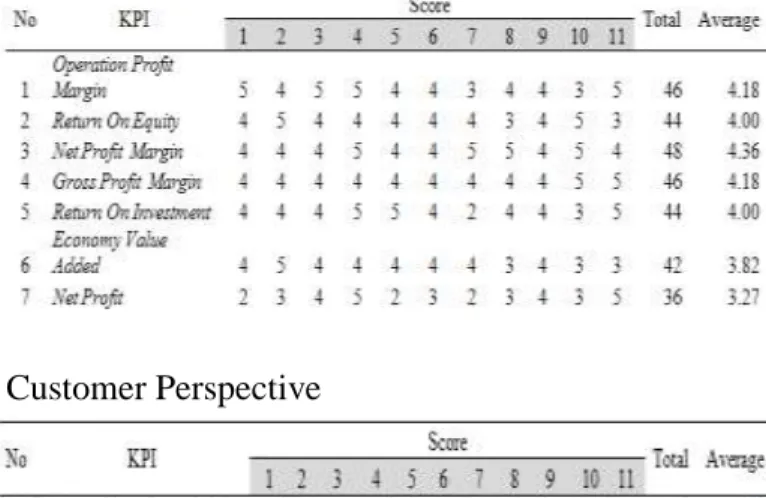
In choosing the most appropriate KPI to measure kineja company then made a comparison between the KPI proposed and verified by respondents who are the main management of PT. Kito Indonesia is associated in the company's performance system. The first comparison is based on the perspective of the balanced scorecard. By using Software Expert Choice then the following is the result of weighting pairwise comparison between perspectives in view of balanced scorecard.
Figure III. Comparison of paired financial perspective
Figure IV. Comparison of paired customer perspective
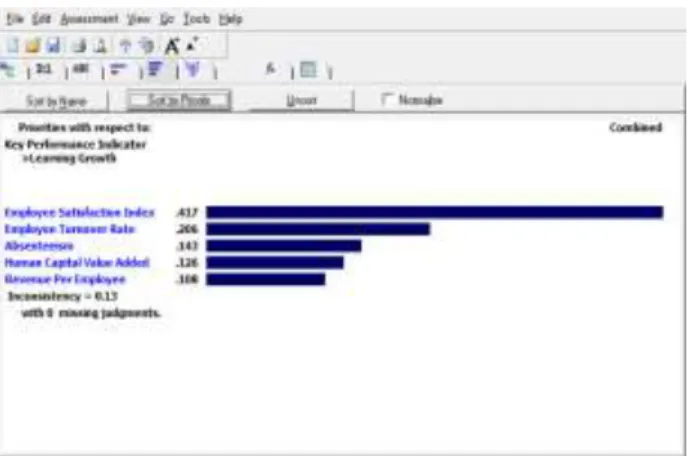
Erry Rismawan, Ida Nahriah IJSRE Volume 05 Issue 10 October 2017 Page 6888 Figure VI. Comparison of paired learning & growth perspective
By using Software Expert Choice, overall KPI proposed that KPI Employee Satisfaction Index selected management as a priority KPI in measuring company performance. The weight obtained by KPI is 0.104 largest compared to 20 other KPIs. The KPI is considered to be the most appropriate to the company's objectives and is highly relevant according to management to be used as a performance measurement tool especially in the business process of the passtrough goods as well as the organization as a whole.
Table VII. KPI Priorities
Calculation Of Corporate Performance Based on KPI
Erry Rismawan, Ida Nahriah IJSRE Volume 05 Issue 10 October 2017 Page 6889 Table VIII. Result Of KPI
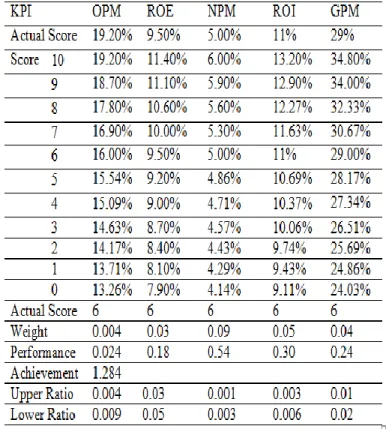
Objective Matrix (OMAX)
KPI measurement results are processed and summarized using Objective Matrix or OMAX. This is to combine the overall KPI into a single point of view and measurement. The measurement of each KPI has different patterns and scales so that a tool that makes KPI measurement results of the company's performance in PT. Kito Indonesia can be seen in one point of view. The results of the Objective Matrix of 20 KPIs for measuring company performance for each perspective in view of balance scorecard are as follows:
Financial Perspective
Erry Rismawan, Ida Nahriah IJSRE Volume 05 Issue 10 October 2017 Page 6890 Table X. Objective Matrix Financial Perspective For 2014
Table XI. Objective Matrix Financial Perspective For 2015
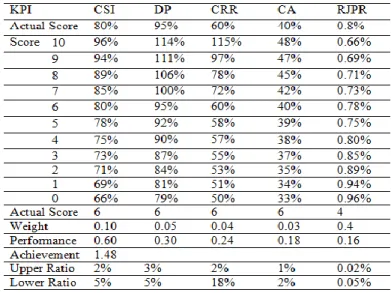
Erry Rismawan, Ida Nahriah IJSRE Volume 05 Issue 10 October 2017 Page 6891 Customer Perspective
Table XII. Objective Matrix Customer Perspective For 2013
Table XIII. Objective Matrix Customer Perspective For 2014
Erry Rismawan, Ida Nahriah IJSRE Volume 05 Issue 10 October 2017 Page 6892
From the customer point of view, the company's performance at PT. Kito Indonesia in 2015 has increased compared to 2013 and 2014. Where performance value for 2015 is 1.32 whereas in 2013 and year 2014 is 1.30, but the change is not significant so there is no big change. The lack of performance improvement on the internal perspective of business processes can lead to the cost / cost incurred by companies that can result in reduced profits.
Internal Business Perspective
Table XV. Objective Matrix Internal Business Perspective For 2013
Erry Rismawan, Ida Nahriah IJSRE Volume 05 Issue 10 October 2017 Page 6893 Table XVII. Objective Matrix Internal Business Perspective For 2015
Dari sudut pandang pelanggan, kinerja perusahaan di PT. Kito Indonesia tahun 2015 mengalami kenaikan jika dibandingkan dengan tahun 2013 dan 2014. Dimana nilai performance untuk tahun 2015 adalah 1.32 sedangkan tahun 2013 dan tahun 2014 sebesar 1.30, namun perubahan ini tidak signifikan sehingga tidak ada perubahan yang cukup besar. Masih kurangnya peningkatan performance pada perspektif internal proses bisnis dapat menyebabkan besarnya biaya / cost yang dikeluarkan perusahaan yang dapat mengakibatkan berkurangnya keuntungan yang diperoleh perusahaan.
Learning and Growth Perspective
Erry Rismawan, Ida Nahriah IJSRE Volume 05 Issue 10 October 2017 Page 6894 Table XIX. Objective Matrix Learning & Growth Perspective For 2014
Table XX. Objective Matrix Learning & Growth Perspective For 2015
From the point of view of learning and growth, the company's performance in PT. Kito Indonesia has not changed. Where performance values for 2013, 2014 and 2015 are 1.45.
ANALYSIS
Key Performance Indicator (KPI) used in measuring company performance
Erry Rismawan, Ida Nahriah IJSRE Volume 05 Issue 10 October 2017 Page 6895
has 5 KPIs, each KPI is considered the management of PT. Kito Indonesia is very representative and appropriately used in measuring company performance in PT. Kito Indonesia.
To determine priorities, what KPIs are the main and priorities used in measuring company performance, use paired comparison weightings and then the data is processed using Expert Choice software. From the results of data processing is known that the most priority KPI is the Employee Satisfaction Index and then followed the Safety Stock, and so on.
Employee Satisfaction Index is considered important compared to other KPI is because employee satisfaction is considered to affect the performance of the company performance because human resources are considered to play an important role in the business process of the company. With the weight that reaches 10.4 percent of the overall KPI Employee Satisfaction Index needs to pay serious attention. In addition, the value of Employee Satisfaction Index for 3 years is 2014, 2015, 2016 is still below 75% which means still not good enough.
Company Performance Measurement of PT. Kito Indonesia
Overall, the company's performance has changed even though the change is not significant. There are some KPIs that have not changed but there is also an increase or decrease, seen from its performance in 2014 PT. Kito Indonesia has the best performance, it can be seen from a financial perspective diamana has the highest performance value when compared to 2013 and 2015.
Meanwhile, the performance of the company viewed from the internal point of view of the business where in this case is passtrough goods and viewed from the point of view of timeliness it will range from 90 to 95% on average for all customers. But that number can be ideal when there are other aspects to be considered such as the cost aspect. To achieve 100% will cause a lot of premium costs (Premium Freight) which is certainly very expensive. This happens because the pattern of fluctuating manufacturing market demand. Sometimes demand is high but sometimes there is also low demand. This pattern causes the company to choose between increasing the inventory level safely or surviving with low inventory with the consequences at the time of the increase there will be a premium freight with air shipment.
From this situation can be understood that not achievement of 100% performance because PT. Kito Indonesia is more concerned with the costs that arise from the pattern of passtrough goods business. If forced 100% performance with fluctuating demand patterns PT. Kito Indonesia will experience a profit deficit and the work will be useless if there is no profit.
CONCLUSION
From a series of steps previous research steps related to the performance of the company in PT. Kito Indonesia can be concluded several things as follows:
1. The company's performance in 2013 is 5.18 and the year 2014 has increased to 5.14 but in 2015 it decreased to 5.39 this is due to the increase from the financial perspective in 2014 where the company get a significant profit but in 2015 the company suffered losses in terms of Finance so as to affect the value of KPI. This increase and decrease is not only influenced by financial perspective but also other perspectives. Then the priority KPI-KPI needs special attention because it is very significant determine the overall performance of the company.