Foglight
™
for vCloud Director 5.6.15
User and Reference Guide
© 2015 Dell Inc. ALL RIGHTS RESERVED.
This guide contains proprietary information protected by copyright. The software described in this guide is furnished under a software license or nondisclosure agreement. This software may be used or copied only in accordance with the terms of the applicable agreement. No part of this guide may be reproduced or transmitted in any form or by any means, electronic or mechanical, including photocopying and recording for any purpose other than the purchaser’s personal use without the written permission of Dell Inc.
The information in this document is provided in connection with Dell products. No license, express or implied, by estoppel or otherwise, to any intellectual property right is granted by this document or in connection with the sale of Dell products. EXCEPT AS SET FORTH IN THE TERMS AND CONDITIONS AS SPECIFIED IN THE LICENSE AGREEMENT FOR THIS PRODUCT, DELL ASSUMES NO LIABILITY WHATSOEVER AND DISCLAIMS ANY EXPRESS, IMPLIED OR STATUTORY WARRANTY RELATING TO ITS PRODUCTS INCLUDING, BUT NOT LIMITED TO, THE IMPLIED WARRANTY OF MERCHANTABILITY, FITNESS FOR A PARTICULAR PURPOSE, OR NON-INFRINGEMENT. IN NO EVENT SHALL DELL BE LIABLE FOR ANY DIRECT, INDIRECT, CONSEQUENTIAL, PUNITIVE, SPECIAL OR INCIDENTAL DAMAGES (INCLUDING, WITHOUT LIMITATION, DAMAGES FOR LOSS OF PROFITS, BUSINESS INTERRUPTION OR LOSS OF INFORMATION) ARISING OUT OF THE USE OR INABILITY TO USE THIS DOCUMENT, EVEN IF DELL HAS BEEN ADVISED OF THE POSSIBILITY OF SUCH DAMAGES. Dell makes no representations or warranties with respect to the accuracy or completeness of the contents of this document and reserves the right to make changes to specifications and product descriptions at any time without notice. Dell does not make any commitment to update the information contained in this document.
If you have any questions regarding your potential use of this material, contact: Dell Inc.
Attn: LEGAL Dept 5 Polaris Way Aliso Viejo, CA 92656
Refer to our web site (software.dell.com) for regional and international office information.
Trademarks
Dell, the Dell logo, and Foglight, IntelliProfile, PerformaSure, and Tag and Follow are trademarks of Dell Inc. Apache, Apache Ant, Ant, “Apache HTTP Server”, "Apache Tomcat" and "Tomcat" are trademarks of the Apache Software Foundation. Google is a registered trademark of Google Inc. Chrome, Android, and Nexus are trademarks of Google Inc. Red Hat, JBoss, the JBoss logo, and Red Hat Enterprise Linux are registered trademarks of Red Hat, Inc. in the U.S. and other countries. CentOS is a trademark of Red Hat, Inc. in the U.S. and other countries. Microsoft, .NET, Active Directory, Internet Explorer, Hyper-V, SharePoint, SQL Server, Windows, Windows Vista and Windows Server are either registered trademarks or trademarks of Microsoft Corporation in the United States and/or other countries. AIX, IBM, and WebSphere are trademarks of International Business Machines Corporation, registered in many jurisdictions worldwide. Sun, Oracle, Java, Oracle Solaris, and WebLogic are trademarks or registered trademarks of Oracle and/or its affiliates in the United States and other countries. SPARC is a registered trademark of SPARC International, Inc. in the United States and other countries. Products bearing the SPARC trademarks are based on an architecture developed by Oracle Corporation. OpenLDAP is a registered trademark of the OpenLDAP Foundation. HP is a registered trademark that belongs to Hewlett-Packard Development Company, L.P. Linux is a registered trademark of Linus Torvalds in the United States, other countries, or both. MySQL is a registered trademark of MySQL AB in the United States, the European Union and other countries. Novell and eDirectory are registered trademarks of Novell, Inc., in the United States and other countries. VMware, ESX, ESXi, vSphere, vCenter, vMotion, and vCloud Director are registered trademarks or trademarks of VMware, Inc. in the United States and/or other jurisdictions. Sybase is a registered trademark of Sybase, Inc. The X Window System and UNIX are registered trademarks of The Open Group. Mozilla and Firefox are registered trademarks of the Mozilla Foundation. "Eclipse", "Eclipse Foundation Member", "EclipseCon", "Eclipse Summit", "Built on Eclipse", "Eclipse Ready" "Eclipse Incubation", and “Eclipse Proposals" are trademarks of Eclipse Foundation, Inc. IOS is a registered trademark or trademark of Cisco Systems, Inc. and/or its affiliates in the United States and certain other countries. Apple, iPad, iPhone, Xcode, Mac OS, and Safari are trademarks of Apple Inc., registered in the U.S. and other countries. Ubuntu is a registered trademark of Canonical Ltd. Symantec and Veritas are trademarks or registered trademarks of Symantec Corporation or its affiliates in the U.S. and other countries. YAST is a registered trademark of SUSE LLC in the United States and other countries. Citrix and XenDesktop are trademarks of Citrix Systems, Inc. and/or one or more of its subsidiaries, and may be registered in the United States Patent and Trademark Office and in other countries. AlertSite and DéjàClick are either trademarks or registered trademarks of Boca Internet Technologies, Inc. Samsung, Galaxy S, and Galaxy Note are registered trademarks of Samsung Electronics America, Inc. and/or its related entities. MOTOROLA is a registered trademarks of Motorola Trademark Holdings, LLC. The Trademark BlackBerry Bold is owned by Research In Motion Limited and is registered in the United States and may be pending or registered in other countries. Dell Inc. is not endorsed, sponsored, affiliated with or otherwise authorized by Research In Motion Limited.
Legend
CAUTION:A CAUTION icon indicates potential damage to hardware or loss of data if instructions are not followed.
Contents
Getting Started . . . 5
Before you Begin . . . 5
Introducing the vCloud Directory Infrastructure . . . 5
Setting Up Monitoring Agents . . . 7
Getting Started to Set Up and Administer Monitoring Agents . . . 7
Exploring the Available Tasks . . . 8
Exploring the Agents table . . . 8
Discovering Server Groups . . . 9
Configuring Monitoring Agents for Data Collection . . . .12
Configuring Agent Properties . . . .13
Setting the Configuration Properties . . . .14
Setting the Data Collection Scheduler Properties . . . .15
Investigating Resource Consumption Levels . . . 16
Exploring your vCloud Director Environment . . . .16
Selecting Monitored Objects . . . .17
Managing Alarms . . . .18
Reviewing FAQts on the Monitoring Tab . . . .19
Reviewing Related Items . . . .20
Monitoring Organizations, Organization vDCs, and Provider vDCs . . . .21
Exploring the Collective Use of All Organization, Organization vDC, or Provider vDC Resources . . . .22
Exploring the Use of Individual Organization, Organization vDC, or Provider vDC Resources 26 Monitoring vSphere Resources . . . .28
Exploring the Use of Virtual Center, Resource Pool, or ESX Host Resources . . . .29
Exploring the Use of Datastore or Datastore Cluster Resources . . . .31
Monitoring Virtual Machines . . . .32
Exploring the Collective Use of All Virtual Machine Resources . . . .33
Exploring the Use of Individual Virtual Machine Resources . . . .35
Reviewing Frequently Asked Questions . . . .36
Metric Collections . . . .52 Contacting Dell . . . .60 Technical support resources . . . .60
1
Getting Started
Foglight™ for vCloud Director allows you monitor virtual vCloud Director infrastructure. Foglight alerts you about
infrastructure problems as soon as they develop, enabling you to resolved issues proactively before end users are affected. Early intervention ensures consistent application performance at established service levels. Foglight for vCloud Director monitors the health of your virtual system by tracking resource consumption such as CPU, network, and memory consumption for individual clusters, servers, and virtual machines in your integrated environment.
• Before you Begin
• Introducing the vCloud Directory Infrastructure
Before you Begin
• Ensure that Foglight™ for vCloud Director is installed on the Management Server. For installation
instructions, see the Foglight for vCloud Director Release Notes.
• If you want to monitor a Virtual Center, you need a running instance of the VMware Performance Agent. This agent is provided with Foglight for VMware. For more information about this product, see the
Managing Virtualized Environments User and Reference Guide.
• If you want to collect Foglight for Storage Management data, you need the Foglight for Storage
Management cartridge installed on the Management Server. For more information about this product, see the Managing Storage in Virtual Environments User and Reference Guide.
Introducing the vCloud Directory
Infrastructure
VMware® vCloud Director® supplies an innovative mechanism for organizing access to a Web console to various
members of an organization. It manages the use of organizational resources, virtual applications, and machines. Foglight™ for vCloud Director accommodates environments of all sizes, that leverage the vCloud Director
platform by analyzing the virtual environment and providing a knowledgeable and interactive view of its components.
• Virtual Machines. A virtual machine resides on an ESX host. Virtual machines share many of the characteristics of physical systems (like storage and network interaction), but they do not have direct access to the hardware that is used to process their information. Each virtual machine runs on a guest operating system, for example, MS Windows XP, and is allocated access to a specific set of the server’s resources, which includes the number of processors and the amount of memory it can leverage.
• vSphere Resources. vSphere resources represent the underlying vSphere resources provided by the associated datastores, ESX hosts, resource pools, and virtual centers.
2
Setting Up Monitoring Agents
Foglight™ for vCloud Director relies on vCloud Director Agents to collect data from the monitored system. When
you install Foglight for vCloud Director, you need to create monitoring agents to collect performance information from your environment.
If the vCloud Director® servers that you want to monitor belong to a vCloud server group, and you have
connection information for at least one vCloud server in that group, use the vCloud Discovery Wizard to configure monitoring of the desired vCloud server.
If you want to create a new vCloud server group and have the connection information for the vCloud server that you want to monitor, simply create a new vCloud Director Agent instance using the Create vCloud Agent
wizard.
• Getting Started to Set Up and Administer Monitoring Agents
• Discovering Server Groups
• Configuring Monitoring Agents for Data Collection
• Configuring Agent Properties
Getting Started to Set Up and Administer
Monitoring Agents
Foglight™ for vCloud Director includes a set of dashboards that allow you to monitor your virtual environment
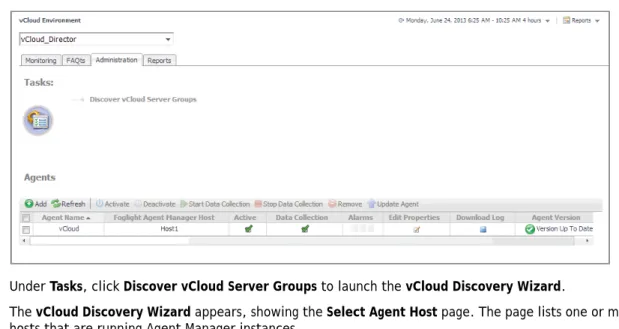
and manage monitoring agents. The vCloud Environment dashboard consists of several tabs, each focusing on a specific aspect of your monitoring needs. The Administration tab
To access this tab, on the navigation panel, under Dashboards, choose vCloud Director > vCloud Environment, and then open the Administration tab.
Exploring the Available Tasks
The Tasks area contains a link to the vCloud Discovery Wizard, Discover vCloud Server Groups. You can use this wizard to find a vCloud server group and the related cells in your environment. For more information, see Discovering Server Groups on page 9.
Figure 2. Tasks area
Exploring the Agents table
The Agents table lists the existing agent instances and allows you to manage them. It contains a set of columns that indicate various states of individual agent instances, along with several commands that you can issue to manage them. For example, to see if an agent instance is collecting data, look at the agent’s Data Collection
column. A green check mark indicates that the agent is collecting data. Figure 3. Agents table
Exploring the toolbar
The toolbar appearing on top of the Agents table provides a set of commands that allow you to manage agent instances. To issue any of the available commands, simply select one or more agent instances using the check boxes in the left-most column, and click the appropriate button on the toolbar. For example, to start an agent’s Table 1. Agents table
Agent Name The name of the agent instance.
Foglight Agent Manager Host
The name of the machine on which the Agent Manager process is running.
Active Indicates if the agent process is running.
Data Collection Indicates if the agent is collecting data from the monitored environment.
Alarms The total numbers of Warning, Critical, and Fatal alarms.
Edit Properties Allows you to edit the agent’s properties.
Download Log Allows you to download the agent log file.
Agent Version Indicates if the agent is running the latest version of the agent package
Figure 4. Agents table toolbar
Discovering Server Groups
A vCloud Director® server group contains one or more vCloud Director servers. The vCloud Director servers use a
shared database, and are associated with vCenter® servers and ESX® hosts. Each vCloud Director server is
considered a cell in the server group, with established connections to the shared database, vCenter server, and any ESX hosts.
Given a vCloud Director server, the vCloud Discovery Wizard allows to locate a desired server group, and to configure monitoring for one or more server cells belonging to that group. This results in two or more agent instances: a vCloud Director agent (to monitor the vCloud server) and one or more VMware Performance agents (to monitor the associated vCenters).
Table 2. Agents table toolbar
Add Starts a workflow for creating new agent instances. For more information, see
Configuring Monitoring Agents for Data Collection on page 12.
Refresh Refreshes the list of agent instances and their states.
Activate Activates one or more selected agent instances. Activating an agent instance starts the agent process on the machine on which the agent is installed. Deactivate Deactivates one or more selected agent instances. Deactivating an agent stops the agent process on the machine on which the agent is installed. Start Data Collection Starts the data collection for one or more selected agent instances. Starting an agent’s data collection causes the agent to begin monitoring the associated vCloud
server and to send the collected metrics back to the Management Server.
Stop Data Collection
Stops the data collection for one or more selected agent instances. Stopping an agent’s data collection causes the agent to stop monitoring the associated vCloud server.
Remove Deletes the selected agent instance.
Update Agent Updates the agent package to the latest version that is installed on the Management Server.
NOTE: The VMware Performance Agent is provided with Foglight for VMware. Ensure this product is installed and enabled in your environment before running the vCloud Discovery wizard. For complete information about Foglight for VMware for VMware, see the Foglight for VMware User and Reference
Figure 5. Administration tab
4 Under Tasks, click Discover vCloud Server Groups to launch the vCloud Discovery Wizard.
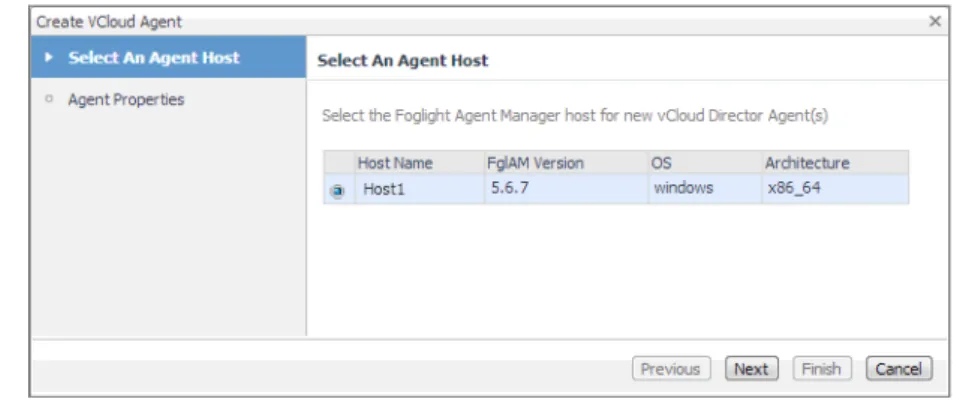
The vCloud Discovery Wizard appears, showing the Select Agent Host page. The page lists one or more hosts that are running Agent Manager instances.
Figure 6. Select Agent Host page
5 On the Select Agent Host page, select the running Agent Manager that you want to manage the monitoring agents you are about to create, and click Next.
Figure 7. Discovery Configuration page
6 On the Discovery Configuration page, provide the following information needed to connect to the vCloud server belonging to the group whose cell you want to monitor.
Figure 8. All vCloud Cells page
8 On the All vCloud Cells page, select the vCloud server that you want to monitor, and click Next. 9 On the All vCenter Servers page, select one or more vCenter that you want to monitor.
10 Optional—Configure monitoring of a vCenter using the VMware Performance Agent.
a On the All vCenter Servers page, in the row listing the vCenter that you want to configure, click the Configure Agent column.
The VMware vCenter Agent: Configure Agent Properties dialog box appears. Figure 9. VMware vCenter Agent: Configure Agent Properties dialog box
b Provide the following information needed to connected to the vCloud server belonging to the group whose cell you want to monitor.
• VMware Agent Name: If you want to specify a different name than the one provided by default (for example, VMware Agent 1), type it in this box.
• Port: If you want to use a different port number than the one provided by default, 443, type it in this box.
• User Name: Type the user name for the VMware Performance Agent to use to log in to the IMPORTANT: Monitoring a vCenter requires a running instance of the VMware Performance Agent. This agent is provided with Foglight for VMware. For more information about this product, see the
11 Click Finish.
12 The vCloud Discovery Wizard closes and the Result For Agent(s) Creation dialog box appears, showing a list of monitoring agents created during the discovery process.
Figure 10. Result For Agent(s) Creation dialog box
Configuring Monitoring Agents for Data
Collection
Foglight™ for vCloud Director uses the vCloud Director Agent to collect information from monitored hosts.
Creating a vCloud Director Agent instance creates the agent process on the Agent Manager host. Activating the vCloud Director Agent starts that agent process. Starting an agent instance’s data collection enables the agent to start collecting data from the monitored host and to send it to the Management Server.
When the vCloud Director Agent package is successfully deployed, create one or more agent instances, activate them, and start their data collection. To perform these steps in a single operation for one or more monitored hosts, use the Create vCloud Agent wizard accessible from the Agents area on the Administration tab of the vCloud Environment dashboard.
To create and activate vCloud Director Agent instances, and start their data collection:
1 Log in to the Foglight browser interface.
2 On the navigation panel, under Dashboards, click vCloud Director > vCloud Environment. 3 Click the Administration tab.
Figure 12. Create vCloud Agent wizard
5 Select the host running the Agent Manager that you want to use to manage the agent instance you are about to create, and click Next.
Figure 13. Agent Properties page
6 On the Agent Properties page, provide the following information needed to create a vCloud associated with the server that you want to monitor.
• vCloud Server Group Name: Type the name of the group to which the vCloud server that you want to monitor belongs.
• vCloud Server: Type the vCloud server name.
• User Name: Type the user name needed to access the vCloud server.
• Password: Type the password needed to access the vCloud server and associated with the above user name.
7 Click Finish.
The wizard closes, and the Agents area refreshes, showing a newly created agent instance. 8 Select the agent instance in the list and click Activate.
Default versions of these properties are installed with Foglight for vCloud Director. However, you can edit the default shareable and agent properties, configure agent properties that apply only to a specific agent instance, and create edited clones of shareable properties that are used by a subset of agents of a certain type.
For detailed information about working with agent properties, see the Administration and Configuration Help.
To modify agent properties:
1 Log in to the Foglight browser interface.
2 Open the Agent Status dashboard and navigate to the agent properties.
d On the navigation panel, under Dashboards, choose Administration > Agents > Agent Status. e On the Agent Status dashboard, select the instance of the vCloud Director Agent whose properties
you want to modify, and click Edit Properties. f Click Modify the private properties for this agent.
The vCloud Director Agent properties appears in the display area. Figure 14. vCloud Director Agent properties
The configuration of agent properties described in this section include:
• Setting the Configuration Properties on page 14
• Setting the Data Collection Scheduler Properties on page 15
Setting the Configuration Properties
The Configuration properties specify general settings the vCloud Director Agent needs to connect to the monitored vCloud server.
Figure 15. Configuration properties
• vCloud Server Group Name: The name of the group to which the vCloud server belongs. Changing the server group name causes the agent to be a part of a different group, while the data associated with the old group is preserved, which may lead to confusion. Therefore changing the server group is not recommended.
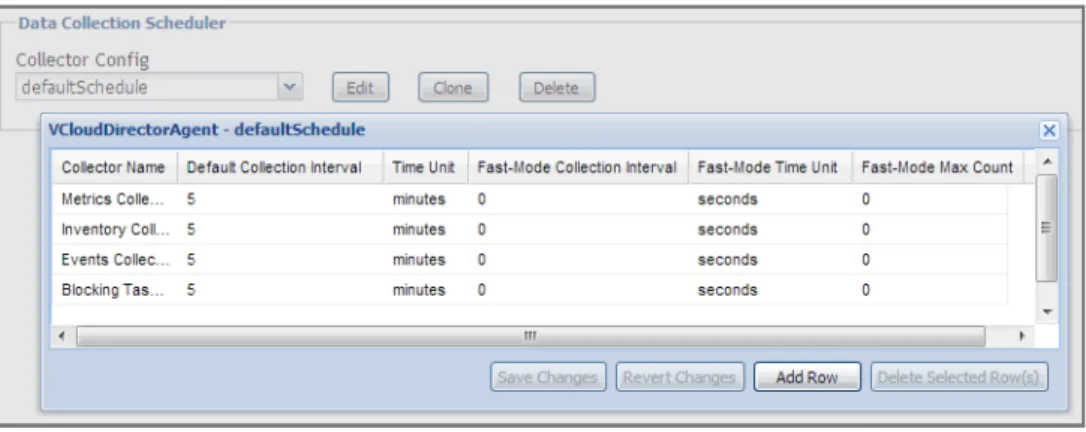
Setting the Data Collection Scheduler Properties
Use the Data Collection Scheduler properties to adjust how frequently the vCloud Director Agent collects data from the monitored vCloud server.
Figure 16. Data Collection Scheduler properties
• Collector Config: A list containing the data collectors the agent uses. Each entry in the list includes the following columns:
• Collector Name: The name of the collector the vCloud Director Agent uses to gather data.
• Default Collection Interval: The number of milliseconds, seconds, minutes, hours, or days during which the vCloud Director Agent collects data.
• Time Unit: The time unit associated with the Default Collection Interval.
• Fast-Mode Collection Interval: The number of milliseconds, seconds, minutes, hours, or days during which the vCloud Director Agent collects data when working in the fast collection mode.
• Fast-Mode Time Unit: The time unit associated with the Fast-Mode Collection Interval.
• Fast-Mode Max Count: The maximum number of the times the vCloud Director Agent can stay in fast collection mode.
3
Investigating Resource Consumption
Levels
When you deploy Foglight™ for vCloud Director and set up the monitoring agents for data collection, a set of
predefined dashboards enables you to review the performance of your virtual system at a glance. They allow you to ensure consistent application performance, by drilling down for details from higher-level components to physical servers and virtual machines, and viewing details about each component, such as CPU utilization and network I/O.
• Exploring your vCloud Director Environment
• Monitoring Organizations, Organization vDCs, and Provider vDCs
• Monitoring vSphere Resources
• Monitoring Virtual Machines
• Reviewing Frequently Asked Questions
• Generating Reports
Exploring your vCloud Director
Environment
A typical vCloud Director® environment contains a set of vDCs, organizations, and virtual machines. You can
view the overall state of these components on the vCloud Environment dashboard. To access this dashboard, under Dashboards, choose vCloud Director > vCloud Environment.
This dashboard provides a set of tabs, each displaying a different aspect of your monitored system:
• Monitoring: Use this tab to review data specific to the main components of your monitored environment such as provider vDCs, organization vDCs, vSphere resources, organizations, and virtual machines. This chapter describes the features available on this tab.
• FAQts: Use this tab to review the answers to common questions about your monitored systems. For more information, see Reviewing Frequently Asked Questions on page 36.
• Reports: Use this tab to find out more about predefined templates that can be used to report on the various aspects of your virtual environment. For more information, see Generating Reports on page 37.
• Administration: Use this tab to discover vCloud server groups and to manage vCloud Director agent instances. For more information, see Setting Up Monitoring Agents on page 7.
When you navigate to the vCloud Environment dashboard for the first time, the Monitoring tab appears open. This tab provides an overall summary of your monitored environment.
Figure 17. Monitoring tab
Selecting Monitored Objects
A set of tiles along the top of this tab gives you a quick overview of the monitored objects: provider vDCs, organization vDCs, vSphere resources, organizations, and virtual machines. Each tile represents a collection of a specific object type, shows the object count, and the count of objects in each alarm state (Normal, Warning, Critical, and Fatal).
Figure 18. Monitored object collections
The Quick View appearing immediately below the tiles allows you to select a specific instance of the tile selection. From here, you can drill down on a desired object instance, and review the related monitoring metrics.
Figure 19. Drilling down on a monitored object
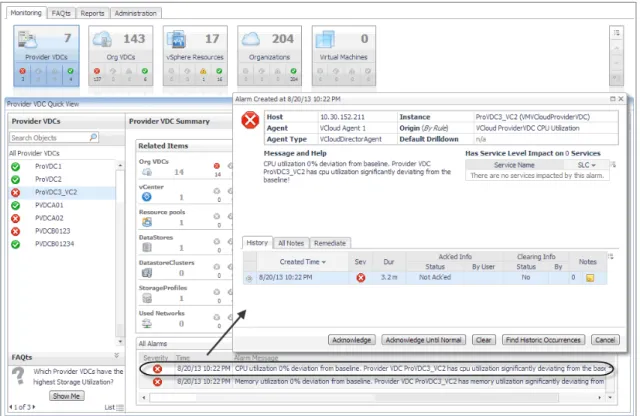
Managing Alarms
If any alarms are generated against the selected object, they appear along the bottom of the summary view. Drill down on an alarm to find out what triggered it, and to take steps to investigate further.
Figure 20. Drilling down on an alarm
For complete information about alarms in Foglight, see the Foglight User Guide.
Reviewing FAQts on the Monitoring Tab
In the bottom-left corner of the Quick View you can navigate through the questions associated to the selected components type, and to review the answers.
Figure 21. Reviewing FAQts on the Monitoring tab
You can review these questions in more detail using the FAQts tab. For more information, see Reviewing Frequently Asked Questions on page 36.
Reviewing Related Items
When you select an object in the left pane of the Quick View, you can quickly find out which objects are associated with the selected object, and to find out their alarm state. The combination of items in this view depends on the type of object selected. For example, if you select an organization object, this view identifies the related organization vDCs, vApps, running virtual machines, groups, and users. Selecting a provider vDC displays the associated organization vDCs, vCenter, resource pools, datastores, datastore clusters, storage profiles, and used networks.
Monitoring Organizations, Organization
vDCs, and Provider vDCs
An organization in vCloud Director® terms is a collection of users, groups, and resources that are available to
users. Encapsulated CPU, memory, and storage resources, that are available to an organization comprise an
organization vDC (virtual datacenter). A provider vDC combines the CPU, memory, and storage resources of the associated resource pools and datastores.
You can monitor the collective resource usage, allocation, and overhead of these monitored objects when you select them on the Monitoring tab. The information appearing in this view can help you discover potential resource-level issues such as spikes in CPU, memory and disk usage, and to reallocate resources where they are most needed.
To explore organizations, organization vDCs, and provider vDCs:
1 On the navigation panel, under Dashboards, click vCloud Director > vCloud Environment.
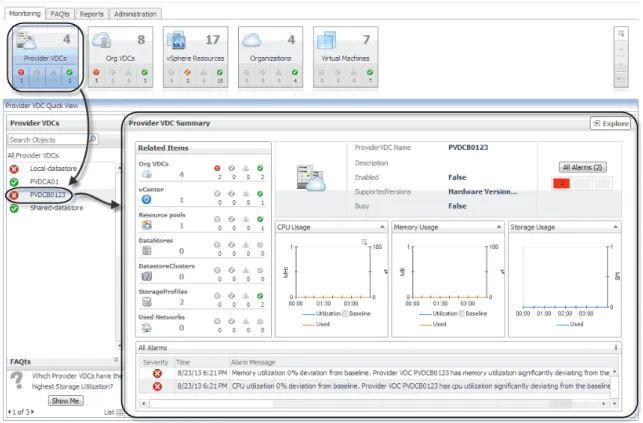
2 On the vCloud Environment dashboard, on the Monitoring tab, click one of the following tiles: Provider vDCs, Organization vDCs, or Organization.
The Quick View refreshes, showing the performance summary of all selected components in the right pane. For example, if you select the Provider vDC tile in this step, the Provider vDC Quick View
displays the Summary - All Provider vDCs view on the right. Figure 23. Summary - All Provider vDCs view
Table 3. Related Item details
Item Type The type of the related item. For example, organization vDCs, vCenter, resource pools, datastores, datastore clusters, storage profiles, or used networks. Item Count The number of items in this category.
Severity-Specific Item Counts
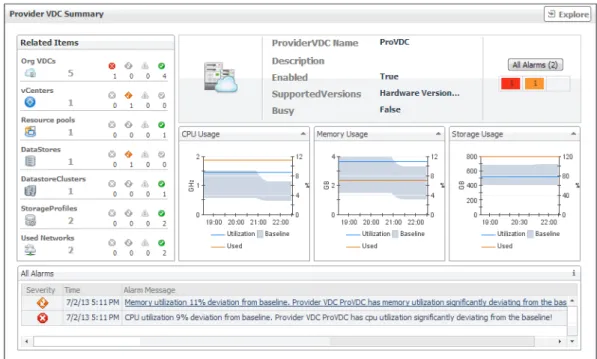
The Quick View refreshes, showing an object summary view on the right. For example, if you select a provider vDC, the Provider vDC Quick View displays the Provider vDC Summary view on the right. Figure 24. Provider vDC Summary view
This view displays the overall resource utilization and the amounts of system resource consumption for a selected organization, organization vDC, or provider vDC. For more information, see Exploring the Use of Individual Organization, Organization vDC, or Provider vDC Resources on page 26.
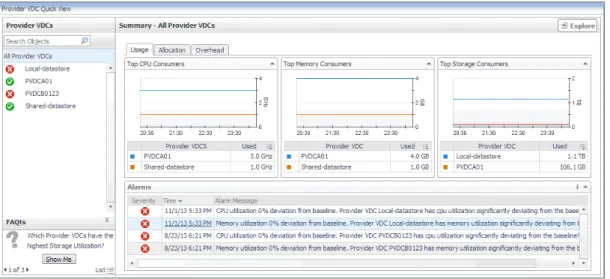
Exploring the Collective Use of All Organization,
Organization vDC, or Provider vDC Resources
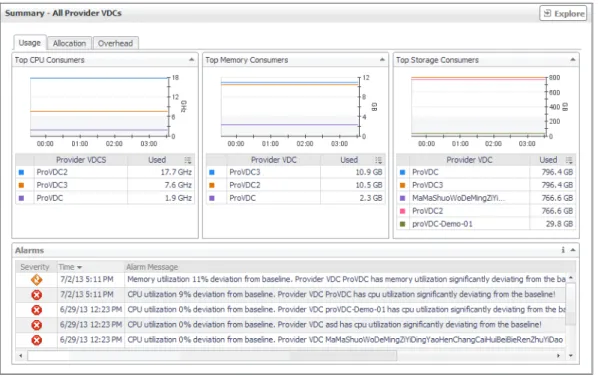
The following views display the levels of resource utilization for all organizations, organization vDCs, or provider vDCs objects:
• Summary - All Organizations • Summary - All Organization vDCs • Summary - All Provider vDCs
These views identify the elements that consume the highest amount of system resources. They can help you learn about the resource levels used by all organizations, organization vDCs, or provider vDCs in your
environment, and to identify and prevent potential bottlenecks by reallocating resources where they are most needed. These summary views appear on the right of the Quick View when you select the Organization,
Figure 25. Summary view
The information appearing on this view is organized into the following tabs:
• Usage tab
• Allocation tab
• Overhead tab
For information about the All Alarms view also appearing in this summary, see Managing Alarms on page 18.
Usage tab
Use this tab to identify the organizations, organization vDCs, or provider vDCs with the highest usage of CPU, memory, and disk resources. The information appearing on this tab can help you to quickly identify the objects whose usage exceeds projected expectations. In most cases, allocating additional resources to these
components can help avoid potential bottlenecks. Figure 26. Usage tab
Allocation tab
Use this tab to identify the organizations, organization vDCs, or provider vDCs with the highest amounts of CPU, memory, and disk resources allocated to them. The information appearing on this tab can help you to quickly identify the objects that may require additional resources allocated to them in order to avoid potential bottlenecks.
Figure 27. Allocation tab
For each of the identified organizations, organization vDCs, or provider vDCs, the graphs and tables appearing on this tab display the following information. Foglight for vCloud Director populates these tiles using the values stored as metrics collected from monitored organizations, organization vDCs, and provider vDCs.
Table 4. Usage tab
Data Description Metrics
Top CPU Consumers
Used
The amount of CPU resources used by an organization,
organization vDC, or provider vDC VMVCloudOrganizationVMVCloudOrganizationVDCcpuUsed cpuUsed
VMVCloudProviderVDCcpuUsed
Top Memory Consumers
Used
The amount of memory used by an organization, organization vDC, or provider vDC
VMVCloudOrganization memoryUsed VMVCloudOrganizationVDC memoryUsed VMVCloudProviderVDC memoryUsed
Top Storage Consumers
Used
The amount of disk space used by an organization,
organization vDC, or provider vDC VMVCloudOrganizationstorageUsed VMVCloudOrganizationVDC storageUsed
VMVCloudProviderVDC storageUsed
Overhead tab
Use this tab to identify the organizations, organization vDCs, or provider vDCs with the highest amounts of memory overhead. The information appearing on this tab can help you to quickly identify the objects that may require additional memory resources in order to avoid potential bottlenecks.
Figure 28. Overhead tab
For each of the identified organizations, organization vDCs, or provider vDCs, the graph and table appearing on
Allocated
The amount of CPU resources allocated to an organization,
organization vDC, or provider vDC VMVCloudOrganizationcpuAllocated VMVCloudOrganizationVDC cpuAllocated
VMVCloudProviderVDC cpuAllocated
Top Memory Allocation
Allocated
The amount of memory allocated to an organization, organization vDC, or provider vDC
VMVCloudOrganization memoryAllocated VMVCloudOrganizationVDC memoryAllocated VMVCloudProviderVDC memoryAllocated
Top Storage Allocation
Allocated
The amount of disk allocated to an organization,
organization vDC, or provider vDC VMVCloudOrganizationstorageAllocated VMVCloudOrganizationVDC storageAllocated
VMVCloudProviderVDC storageAllocated Table 5. Allocation tab
Exploring the Use of Individual Organization,
Organization vDC, or Provider vDC Resources
The following views display the amounts of system resource consumption for a selected organization, organization vDC, or provider vDC:• Organization Summary • Organization vDC Summary • Provider vDC Summary
These views can help you find out the configuration properties of a selected object, such as its name and state, and to identify and prevent potential bottlenecks. They appear on the right in the Quick View when you select an organization, organization vDC, or provider vDC in the left pane.
Figure 29. Provider vDC Summary view
The resource usage an configuration information appearing on this view is organized into the following views:
• Configuration Properties views
• CPU, Memory, and Storage Usage views
For information about the Related Items and All Alarms views also appearing in this summary, see the following sections:
• Managing Alarms on page 18
• Reviewing Related Items on page 20
enabled or busy. If any alarms are generated against the selected object, the counts of alarms in each severity state are displayed.
CPU, Memory, and Storage Usage views
Use this view to find out the percentages of CPU, memory, or memory utilization the selected organization, organization vDC, or provider vDC spends over the selected time range.
Figure 33. CPU, Memory, and Storage Usage views
For each of the identified organizations, organization vDCs, or provider vDCs, the graphs appearing on this tab display the following information. Foglight for vCloud Director populates these tiles using the values stored as Table 7. Organization, Organization vDC, and Provider vDC properties
Organization
Figure 30. Organization properties
Organization vDC
Figure 31. Organization vDC properties
Provider vDC
Monitoring vSphere Resources
A typical vSphere® infrastructure consists of the following objects:
• Virtual centers: Software used to manage virtual environments that are built on the VMware
Used
The amount of CPU resources an organization, organization
vDC, or provider vDC spends during the selected time range. VMVCloudOrganizationVMVCloudOrganizationVDCcpuUsed cpuUsed
VMVCloudProviderVDCcpuUsed
Baseline The expected CPU usage range for an organization, organization vDC, or provider vDC. The data range is not based on the current metric values, but on calculations using historical data. Memory Usage
Utilization
The percentage of memory resources an organization, organization vDC, or provider vDC spends during the selected time range.
VMVCloudOrganization memoryUtilization VMVCloudOrganizationVDC memoryUtilization VMVCloudProviderVDC memoryUtilization Used
The amount of memory resources an organization, organization vDC, or provider vDC spends during the selected time range.
VMVCloudOrganization memoryUsed VMVCloudOrganizationVDC memoryUsed VMVCloudProviderVDC memoryUsed
Baseline The expected memory usage range for an organization, organization vDC, or provider vDC. The data range is not based on the current metric values, but on calculations using historical data. Storage Usage
Utilization
The percentage of disk space an organization, organization
vDC, or provider vDC spends during the selected time range. VMVCloudOrganizationstorageUtilization VMVCloudOrganizationVDC storageUtilization
VMVCloudProviderVDC storageUtilization
Used
The amount of disk space an organization, organization
vDC, or provider vDC spends during the selected time range. VMVCloudOrganizationstorageUsed VMVCloudOrganizationVDC storageUsed
VMVCloudProviderVDC storageUsed
Baseline The expected disk usage range for an organization, organization vDC, or provider vDC. The data range is not based on the current metric values, but on calculations using historical data.
Table 8. CPU, Memory, and Storage Usage views
• Datastores: Storage location for virtual machine files.
• Datastore clusters: Collections of servers that share common storage resources.
You can monitor the resource usage, allocation, and overhead of these elements when you select them in the Quick View. The information appearing in this view can help you discover potential resource-level issues such as spikes in CPU, memory and disk usage, and to reallocate resources, when required.
To explore vSphere resources:
1 On the navigation panel, under Dashboards, click vCloud Director > vCloud Environment. 2 On the vCloud Environment dashboard, on the Monitoring tab, click the vSphere Resources tile.
The vSphere Resource Quick View appears, showing the performance summary for a component selected in the vSphere Resources pane on the left.
Figure 34. vSphere Resource Quick View
This view displays the overall resource utilization the selected virtual center, resource pool, or ESX host. For more information, see Exploring the Use of Virtual Center, Resource Pool, or ESX Host Resources on page 29.
Exploring the Use of Virtual Center, Resource Pool, or
ESX Host Resources
The following views display the amounts of system resource consumption for a selected virtual center, resource pool, or ESX® host:
Figure 35. Summary - Virtual Center view
The information appearing on this view is displayed in the Resource Utilizations view.
For information about the Related Items and All Alarms views also appearing in this summary, see the following sections:
• Managing Alarms on page 18
• Reviewing Related Items on page 20
Resource Utilizations view
Use this view to review the levels of CPU, network, memory, and disk utilization and overall consumption, broken down into four simple views. Foglight™ for vCloud Director populates these values using the metrics
collected by Foglight for VMware. For more information about the metrics appearing in these views, see the
Foglight for VMware User and Reference Guide. Table 9. Resource Utilizations view
Data Description
CPU Load The current percentage of the selected object’s CPU load, used to execute system code and user programs, based on the total CPU capacity. % Used The percentage of the selected object’s CPU resources spent on executing system code and user programs during the selected time period. % Ready The percentage of the selected object’s CPU resources that is ready to execute system code and user programs during the selected time period. Network I/O The current rate at which the selected object transfers data from and to the network.
Send Rate The rate at which the selected object sends data to the network during the selected time period. Receive Rate The rate at which the selected object receives data from the network during
Exploring the Use of Datastore or Datastore Cluster
Resources
The Summary - Datastore and Summary - Datastore Cluster views display the levels of storage capacity and growth for a datastore or datastore cluster. These views helps you predict the amount of time after which the selected object’s storage resources will be full and no longer available. It can help you identify and prevent potential bottlenecks by reallocating storage space where it is most needed.
This summary view appears on the right side of the Quick View when you select a datastore or a datastore cluster.
Figure 36. Summary - Datastore view
Swapped The amount of memory that is stored in disk swap space.
Shared The amount of the selected object’s memory that is freed up due to transparent page sharing. Ballooned The amount of physical memory that is actively being used by the VMware Memory Control Driver to allow the guest OS to selectively swap memory. Active The amount of the available memory that the selected object uses during the selected time period. Total Memory The total amount of memory available to the selected object.
Memory Used The percentage of memory the selected object currently uses.
Disk I/O The current disk I/O rate for the selected object.
Read Rate The rate at which the selected object reads data from the disk during the selected time period. Write Rate The rate at which the selected object writes data to the disk during the selected time period.
Table 9. Resource Utilizations view
• Reviewing Related Items on page 20
Resource Utilizations view
Use this view to review the levels of disk utilization for a datastore or a datastore cluster. The combination of items in this view depends on the type of the selected object. For example, both datastore and datastore cluster display the total disk capacity, amounts of used and free disk space, percentage od free space, estimated weekly rate, and estimated time after which the disk will be full. For each datastore, this view also shows the maximum file size and file system type, while for datastore clusters this view also contains the amount of uncommitted storage space.
Monitoring Virtual Machines
Virtual machines share many of the characteristics of physical systems (like storage and network interaction), but they do not have direct access to the hardware that is used to process. Each virtual machine runs on a guest operating system (for example, Microsoft® Windows® XP), and is allocated access to a specific set of the server’s
resources. This includes the number of processors and the amount of memory it can leverage.
You can monitor the usage of virtual machine resources when you select one or all virtual machines in the Quick View. The information appearing in this view can help you discover potential resource-level issues such as spikes in CPU, memory and disk usage, and to reallocate resources, when required.
Table 10. Resource Utilizations view
Datastore
Figure 37. Datastore Resource Utilizations view
Datastore Cluster
Figure 39. Summary - All Virtual Machines view
This view displays the overall resource utilization information for all virtual machines in the monitored vCloud, and identifies the elements that consume the highest amount of system resources. For more information, see Exploring the Collective Use of All Virtual Machine Resources on page 33.
3 In the left pane, select a virtual machine.
The Quick View refreshes, showing a virtual machine summary view on the right. Figure 40. Virtual Machine Summary view
This view displays the levels of system resource consumption for a selected organization, organization vDC, or provider vDC. For more information, see Exploring the Use of Individual Organization,
Figure 41. Summary - All Virtual Machines view
The information appearing on this view is organized into four views: Top CPU, Memory, Network, and Datastore Consumers views.
For information about the All Alarms view also appearing in this summary, see Managing Alarms on page 18.
Top CPU, Memory, Network, and Datastore Consumers views
Use these views to identify the virtual machines with the highest consumption of CPU, memory, network, and disk resources.Figure 42. Top CPU, Memory, Network, and Datastore Consumers views
Foglight™ for vCloud Director populates these views using the metrics collected by Foglight for VMware. For
more information about the metrics appearing in these views, see the Managing Virtualized Environments User and Reference Guide.
Table 11. Top CPU, Memory, Network, and Datastore Consumers views
Data Description
Virtual Machine The name of the virtual machine.
Top CPU Consumers
Used Hz The amount of CPU processing speed the virtual machine spends on executing system
code and user programs, during the selected time range.
Top Memory Consumers
Exploring the Use of Individual Virtual Machine
Resources
The Virtual Machine Summary view displays the amounts of system resource consumption for a selected virtual machine. This view can help you to identify and prevent potential bottlenecks by reallocating resources where they are most needed. It appears on the right in the Quick View when you select a virtual machine in the Virtual Machines pane.
Figure 43. Virtual Machine Summary view
The information appearing on this view is displayed in the Resource Utilizations view.
For information about the Related Items and All Alarms views also appearing in this summary, see the following sections:
• Managing Alarms on page 18
Top Disk Consumers
Rate The rate at which the virtual machines reads or writes data to the disk during the selected time range.
Table 11. Top CPU, Memory, Network, and Datastore Consumers views
Reviewing Frequently Asked Questions
Foglight™ for vCloud Director offers a collection of frequently asked questions that provide quick insight into
resource utilization levels for organization and provider vDCs in your monitored system. The question mechanism is interactive, guiding you to choose a category and specify additional parameters. You can find the available questions on the FAQts tab of the vCloud Monitoring dashboard. Table 12. Resource Utilizations view
Data Description
CPU Load The current percentage of the selected virtual machine’s CPU load, used to execute system code and user programs, based on the total CPU capacity. % Used The percentage of the selected virtual machine’s CPU utilization, spent on executing system code and user programs, during the selected time period. Baseline The expected CPU utilization range, based on historical data.
% Ready The percentage of the selected virtual machine’s CPU resources that is ready to execute system code and user programs during the selected time period. Network I/O The current rate at which the selected virtual machine transfers data from and to the network.
Transfer Rate The rate at which the selected virtual machine transfers data from and to the network during the selected time period. Baseline The expected network utilization range based on historical data.
Memory The current percentage of the average memory usage by the selected virtual machine, based on the total memory capacity. Utilization The percentage of memory used by the virtual machine during the selected time period. Baseline The expected memory utilization range based on historical data.
Disk I/O The current disk I/O rate for the selected virtual machine.
Transfer Rate The rate at which the selected virtual machine transfers data from and to the disk during the selected time period. Baseline The expected disk utilization range based on historical data.
Figure 44. FAQts tab
On this tab, the Categories pane several question groups. Selecting a category shows the questions belonging to that category in the Questions pane. From there, clicking a question shows the answer on the right.
Figure 46. Reports tab
For more information on how to use this tab to create and manage reports, see the Managing Capacity in Virtual Environments User Guide. For complete information about the Reports dashboard, see the Foglight User Help. The following templates are available with Foglight for vCloud Director.
Table 13. Report templates
Report Template Use it to…
vCloud Organization Summary Report
Compile a list of vCloud Director® provider and organization vDCs. For
each provider and organization vDC, the list indicates if the vDC is enabled and its alarm state, the levels of used, allocated, and limited CPU, memory, and storage resources, along with a health history bar. In addition, the report shows the allocation model associated with each organization vDC.
vCloud Summary Report
Compile a list of vCloud provider and organization vDCs, organizations. For each provider vDC, organization vDC, and organization, the list indicates if the vDC is enabled and its alarm state, the levels of used, allocated, and limited CPU, memory, and storage resources, along with a health history bar. In addition, the report shows the allocation model associated with each organization vDC.
4
Investigating Object Dependencies
A typical vCloud Director® environment consists of many interrelated components. Understanding the
dependencies between logical and virtual components in your monitored environment, and the levels of resources they consume, allows you to better understand resource-related issues, potentially affecting the stability of your system. This can help you predict the impact a potential outage may have on your environment, and to prevent such events, by reallocating resources where they are most needed.
• Getting Started with the Dependency Map
• Starting your Investigation
Getting Started with the Dependency Map
The vCloud VM Dependency dashboard visualizes the relationships between the different objects in your environment through an interactive map. The map illustrates how different components relate to each other, and the levels of the available resources available to them.
To access this dashboard, under Dashboards, choose vCloud Director > vCloud Dependency. Figure 47. vCloud VM Dependency dashboard
Figure 48. Dependency map
The information appearing in this view is organized into two tabs:
• vCD Dependency tab
• vSphere Dependency tab
vCD Dependency tab
The vCD Dependency tab illustrates the logical dependencies between the monitored objects. To open this tab, on the navigation panel, under vCloud Dependency, click vCD Dependency.
Figure 49. vCD Dependency tab
On this tab, your monitored vCloud appears as the root of the navigation tree, with all of its organizations, provider vDCs, resource pools, and datastores. Organization vDCs appear as child nodes of organizations. This structure illustrates the hierarchy of monitored objects in your vCloud Director infrastructure. Use this view to quickly locate a desired object using the logical hierarchy within your vCloud, and to explore any related dependencies.
vSphere Dependency tab
Figure 50. vSphere Dependency tab
Identifying Dependency Map Elements
In a dependency map, some objects are represented with container tiles, others with single-object tiles or just icons. Dependencies between the objects in a map are illustrated with single-directional arrows.
Figure 51. Dependency map elements
The complexity of the information representing an object depends on its type and any dependencies it has with other objects in a monitored environment. Object dependencies are represented with arrow lines.
Every object is represented with an icon, representing its type. This allows you quickly recognize main elements in a dependency map.
Organization tile
The organization tile displays the levels of resource utilization (CPU, memory, and disk storage) for an entire organization. It also shows the organization’s alarm severity state. These tiles also contain one or more tiles representing organization vDCs associated with that organization.
Figure 52. Organization tile
Foglight™ for vCloud Director populates the organization tile using the values stored as metrics collected from
monitored organizations.
Organization vDC Provider vDC Resource Pool vApp
vCloud
Virtual Machine
Table 15. Organization tile
Data Description Metric
CPU The amount of the organization’s CPU resources spent on executing system code and user programs. VMVCloudOrganizationcpuUsed Memory The amount of the organization’s memory resources that are currently in use. VMVCloudOrganizationmemoryUsed
Storage The amount of the organization’s disk resources that are currently in use. VMVCloudOrganizationstorageUsed
Figure 53. Organization vDC tile
Foglight for vCloud Director populates these tiles using the values stored as metrics collected from monitored organization vDCs.
Provider vDC tiles
The provider vDC tile displays the percentages of resource utilization (CPU, memory, and disk storage) for a provider vDC, and its severity state. It also shows the current resource usage and the total amount of resources available to the provider vDC.
Figure 54. Provider vDC tile Table 16. Organization vDC tile
Data Description Metric
CPU
The percentage of the organization vDC’s CPU resources spent on executing system code and user programs during the selected time period.
VMVCloudOrganizationVDC cpuUtilization
Used The amount of CPU resources spent on executing system code and user programs. VMVCloudOrganizationVDCcpuUsed Allocated The total amount of CPU resources allocated to the organization vDC. VMVCloudOrganizationVDCcpuAllocated Memory The percentage of the organization vDC’s memory resources that are currently in use. VMVCloudOrganizationVDCmemoryUtilization Used The amount of the organization vDC’s memory resources that are currently in use. VMVCloudOrganizationVDCmemoryUsed Allocated The total amount of memory resources that are allocated to the organization vDC. VMVCloudOrganizationVDCmemoryAllocated Storage The percentage of the organization vDC’s disk resources that are currently in use. VMVCloudOrganizationVDCstorageUtilization Used The amount of the organization vDC’s disk resources that are currently in use. VMVCloudOrganizationVDCstorageUsed Allocated The total amount of disk resources that are allocated to the organization vDC. VMVCloudOrganizationVDCstorageAllocated
vApp, Cluster, and Datastore tiles
The vApp, cluster, and datastore tiles are somewhat simpler in that they displays just the name of the component and its severity state, and also the name and severity state of the containing objects: virtual machines, resource pools, and datastores.
Figure 55. vApp tile
Setting the Zoom Level
In larger multi-component environments, a typical dependency map is likely complex and cannot fit your screen. The NAVIGATOR in the top-right corner allows you to easily set the zoom level by dragging the slider into the appropriate position. You can also display a desired part of the map by dragging the grey rectangle. Figure 56. Navigator
Table 17. Provider vDC tile
Data Description Metric
CPU
The percentage of the provider vDC’s CPU resources spent on executing system code and user programs during the selected time period.
VMVCloudProviderVDC cpuUtilization
Allocated The total amount of CPU resources available to the provider vDC. VMVCloudProviderVDCcpuAllocated Used The amount of CPU resources spent on executing system code and user programs. VMVCloudProviderVDCcpuUsed Memory The percentage of the provider vDC’s memory resources that are currently in use. VMVCloudProviderVDCmemoryUtilization
Allocated The total amount of memory resources that are available to the provider vDC. VMVCloudProviderVDCmemoryAllocated
Used The amount of the provider vDC’s memory resources that are currently in use. VMVCloudProviderVDCmemoryUsed Storage The percentage of the provider vDC’s disk resources that are currently in use. VMVCloudProviderVDCstorageUtilization
Allocated The total amount of disk resources that are available to the provider vDC. VMVCloudProviderVDCstorageAllocated
Starting your Investigation
To get started with your investigation, first select a desired object in the navigation tree. The vCD Dependency dashboard refreshes showing your object and any related dependencies. Observe related components and their alarm states. This can give you a good indication of any potential bottlenecks or performance issues.
Figure 57. vCD Dependency dashboard
Some objects in the dependency map are displayed in multi- and single component tiles, and object icons. The type and range of the objects appearing on the vCD Dependency dashboard depends on the selected objects and the dependencies that object has within your integrated infrastructure. To better understand the map, every object type is identified with an icon. For more information, see Identifying Dependency Map Elements on page 41.
For example, when you select an organization in the navigation tree, the dependency map displays a tile representing the organization object consisting of one or more organization vDCs.
Figure 59. Provider vDCs
CPU, memory, and disk usage metrics appear for the provider vDCs, along with their alarm states. The map also shows the datastores and resource pools the provider vDCs use, and the elements in and elements associated with these objects, such as datastore and VMware clusters.
Figure 60. Datastores and resource pools associated with provider vDCs
To find out more information about any of the displayed components, click the appropriate tile to display more information. For example, if you see an object that is in Fatal state, you can drill down on it to review the existing alarms and investigate further the root cause of the issue.
5
Reference
This chapter contains reference information about rules and metrics that are defined in Foglight™ for vCloud
Director. Read this chapter to find out details about these components.
• Rules
• Metric Collections
Rules
Foglight™ allows you to create flexible rules that can be applied to complex, interrelated data from multiple
sources within your distributed system. You can associate several different actions with a rule, configure a rule so that it does not fire repeatedly, and associate a rule with schedules to define when it should and should not be evaluated.
Different types of data can be used in rules, including registry variables, raw metrics, derived metrics, and topology object properties.
There are two types of rules in Foglight: simple rules and multiple-severity rules. A simple rule has a single condition, and can be in one of three states: Fire, Undefined, or Normal. A multiple-severity rule can have up to five severity levels: Undefined, Fatal, Critical, Warning, and Normal.
Rule conditions are regularly evaluated against monitoring data (metrics and topology object properties collected from your monitored environment and transformed into a standard format). Therefore, the state of the rule can change if the data changes. For example, if a set of monitoring data matches a simple rule’s condition, the rule enters the Fire state. If the next set does not match the condition, the rule exits the Fire
state and enters the Normal state.
A rule condition is a type of expression that can be true or false. When it evaluates to true, the rule is said to fire, causing any actions that are associated with the rule or severity level to be performed. You can configure a rule to perform one or more actions upon entering or exiting each state. When a multiple-severity rule fires, an alarm also appears in Foglight.
For more information see the Foglight Administration and Configuration Help.
Foglight for vCloud Director provides an effective monitoring solution for the vCloud infrastructure. The rules included with this product alert you about virtual infrastructure problems.
When service degradations are detected, Foglight sends alerts to the event console. Optionally, Foglight can be configured to send emails, pager messages, or perform other actions you define. Performance data can be viewed, analyzed, and reported using Foglight.
Foglight for vCloud Director includes the following groups of rules:
• vCloud Director Dependencies Rule on page 48
vCloudDependenciesRefresher rule
Purpose
This rule refreshes all objects found in the vCloud dependency map.
vCloud Director Rules
This section lists and describes the vCloud Director rules. Rules in this section:
• VCloud Agent Updates rule on page 49
• VCloud Check Virtual Center Monitoring Status rule on page 49
• VCloud OrganizationVDC CPU Utilization rule on page 50
• VCloud OrganizationVDC Memory Utilization rule on page 50
• VCloud OrganizationVDC Storage Utilization rule on page 50
• VCloud ProviderVDC CPU Utilization rule on page 51
• VCloud ProviderVDC Memory Utilization rule on page 51
• VCloud ProviderVDC Storage Utilization rule on page 51
VCloud Agent Updates rule
Purpose
This rule monitors the activity of monitoring vCloud Director Agent instances.
Scope
Agent
VCloud Check Virtual Center Monitoring Status rule
Table 18. Rule DefinitionConditions State Action
The monitoring vCloud Director Agent instances are active and collecting data. Normal None A vCloud Director Agent instance has not collected any data for 10 minutes (600 seconds).
This time period is set by the VCL:agent.lastUpdated.critical registry variable. The default global value of this variable is 600 (seconds).
VCloud OrganizationVDC CPU Utilization rule
Purpose
This rule monitors the CPU utilization of organization vDCs, and generates alarms if it determines that the CPU utilization significantly deviates from the baseline values.
Scope
VMVCloudOrganizationVDC
VCloud OrganizationVDC Memory Utilization rule
Purpose
This rule monitors the memory utilization of organization vDCs, and generates alarms if it determines that the memory utilization significantly deviates from the baseline values.
Scope
VMVCloudOrganizationVDC
VCloud OrganizationVDC Storage Utilization rule
Table 19. Rule DefinitionConditions State Action
All Virtual Centers associated with the monitored vCloud environment are configured for monitoring.
Normal None A Virtual Center is currently not monitored. A VMware Performance Agent instance should
be configured to collect data from this Virtual Center.
Warning None
Table 20. Rule Definition
Conditions State Action
The CPU utilization of all organization vDCs is within the normal baseline range. Normal None The CPU utilization of an organization vDC has reached 97% of the baseline value. Critical None The CPU utilization of an organization vDC has reached 99% of the baseline value. Fatal None
Table 21. Rule Definition
Conditions State Action
The memory utilization of all organization vDCs is within the normal baseline range. Normal None The memory utilization of an organization vDC has reached 97% of the baseline value. Critical None The memory utilization of an organization vDC has reached 99% of the baseline value. Fatal None
Scope
VMVCloudOrganizationVDC
VCloud ProviderVDC CPU Utilization rule
Purpose
This rule monitors the CPU utilization of provider vDCs, and generates alarms if it determines that the CPU utilization significantly deviates from the baseline values.
Scope
VMVCloudProviderVDC
VCloud ProviderVDC Memory Utilization rule
Purpose
This rule monitors the memory utilization of provider vDCs, and generates alarms if it determines that the memory utilization significantly deviates from the baseline values.
Scope
VMVCloudProviderVDC Table 22. Rule Definition
Conditions State Action
The storage utilization of all organization vDCs is within the normal baseline range. Normal None The storage utilization of an organization vDC has reached 97% of the baseline value. Critical None The storage utilization of an organization vDC has reached 99% of the baseline value. Fatal None
Table 23. Rule Definition
Conditions State Action
The CPU utilization of all provider vDCs is within the normal baseline range. Normal None The CPU utilization of a provider vDC has reached 97% of the baseline value. Critical None The CPU utilization of a provider vDC has reached 99% of the baseline value. Fatal None
Table 24. Rule Definition
Conditions State Action