Sharif University of Technology
Scientia IranicaTransactions B: Mechanical Engineering www.scientiairanica.com
Introduction and optimization of a power split
continuously variable transmission including several
xed ratio mechanisms
M. Delkhosh and M. Saadat Foumani
School of Mechanical Engineering, Sharif University of Technology, Tehran, P.O. Box 11155-9567, Iran. Received 21 October 2013; received in revised form 10 March 2014; accepted 31 May 2014
KEYWORDS Continuously variable transmission;
Power split; Full-toroidal; Fixed ratio mechanism; Fuel consumption; Optimization.
Abstract.The goal of this paper is to introduce and optimize a Power Split Continuously Variable Transmission (PS-CVT) including several Fixed Ratio (FR) mechanisms. In this power train, FR mechanisms are embedded in all possible places. At rst, the governing dynamics of the proposed power train is developed. A control algorithm on the base of minimizing the vehicle Fuel Consumption (FC) is introduced. Two vehicles in dierent classes are considered in which the proposed power train is used. Afterwards, two-stage optimization with the aim of minimizing the vehicles' FC is carried out. It is found that employing properly designed FR mechanisms improves the power train and decreases FC. Also, it is revealed that there is a specic power train for each of the vehicles that gives a remarkable fuel economy in each of the considered driving cycles.
© 2015 Sharif University of Technology. All rights reserved.
1. Introduction
The nite supply of fossil fuel resources inspires re-searchers to explore ways of reducing consumers' Fuel Consumption (FC). Optimization of the vehicles, one of the major consumers, can play an important role in saving fuel resources. Several researches have focused on the improvement of the vehicles' dierent parts. One of the key elements of the vehicles that has a signicant eect on their FC is the power transmis-sion. Nowadays, some manufacturers use Continuously Variable Transmission (CVT) as the power train in order to decrease the vehicle FC. In these power trains, the Speed Ratio (SR) between the engine and wheels varies continuously. In the case of conventional power trains, the engine rpm is a function of the vehicle speed according to the power train SR. Despite the conventional power train, the engine rpm is almost
*. Corresponding author. Tel.: +98 21 66165534; E-mail addresses: m [email protected] (M. Delkhosh); m [email protected] (M. Saadat Foumani)
independent of the vehicle speed through employing CVT. Therefore, CVT allows the engine to operate at the rpm in which the vehicle FC is minimal. However, CVT has two major shortcomings. The rst, is its limited power transmission capacity, which is a result of limited friction coecient in the V-belt CVT [1], and limited strength of contact surfaces in toroidal one [2]. The second weakness is its narrow SR range, because of the geometrical constraints. Moreover, in the case of CVT, another mechanism is necessary to create reverse gear in the transmission. Therefore, researchers at-tempted to combine CVT with a Planetary Gear train (PG) and a Fixed Ratio mechanism (FR) to extend the power train SR range. These mechanisms are called Power Split Continuously Variable Transmission (PS-CVT). Another advantage of PS-CVT over CVT is its greater capacity for power transmission. The reason behind it is that, in PS-CVT only a part of the input power ows through the CVT, while the rest ows through other parts [3]. It is notable that if PS-CVT be able to create zero speed ratio (output shaft xed), it is named as Innitely Variable Transmission (IVT).
There has been some interesting research in the eld of PS-CVT and IVT. Brockbank et al. [4] pre-sented an IVT transmission including a full-toroidal traction drive used in tractors in the USA. Their intro-duced IVT had some advantages such as low weight and volume, and high eciency. Mantriota [5] considered IVT including a V-belt CVT, and investigated the use of an automatically regulated speed ratio in dierent operating conditions. He calculated the power ows and eciency of this power train. Mangialardi et al. [3] and Mantriota [6,7] introduced the parallel and series types of IVT including a V-belt CVT, planetary gear and a xed ratio mechanism, and calculated their eciencies and power ows, theoretically and experimentally. They showed that IVT eciency would increase with the growth of its speed ratio. Delkhosh et al. [8] established the governing dynamics of a par-allel PS-CVT equipped with full-toroidal CVT. They optimized the geometry of this power train to decrease the vehicle FC in NEDC driving cycle. Bottiglione et al. [9] studied the IVT eciency and its control in the speed ratios close to zero (neutral gear), theoretically and experimentally. Fen Zhu et al. [10] examined the traction IVT (TIVT) and established a model for calculating its eciency. They demonstrated that its eciency can be almost 99% by proper designing. Pan et al. [11] studied the torque ratio of metal V-belt CVT to PS-CVT and investigated the toque ratio in series and parallel PS-CVT, and found the relation between the torque ratio and speed ratios of PS-CVT elements. Carbone et al. [12] developed a model for eciency calculation of half-toroidal and half-toroidal CVT and calculated their eciency as a function of their geometry and operating condition.
One of the main kinds of PS-CVT is the series one in which CVT and the sun of PG are connected to the input shaft. As mentioned in [13], toroidal CVT eciency is a function of its speed ratio, input speed and torque. In the simple type of series, where PS-CVT is including one FR, PG and PS-CVT, PS-CVT input torque and speed depend on the PS-CVT speed ratio and the engine exerted power and speed. Therefore, the value of CVT input torque, speed and speed ratio cannot be changed to increase its eciency, and therefore PS-CVT eciency is xed. A remedy for this is to embed some FR mechanisms between simple PS-CVT's elements. In this paper, a number of FR mechanisms are embedded in all possible places in the PS-CVT. In this case, by properly designing the FRs, PS-CVT eciency can be increased, and therefore, the vehicle FC will decrease. In the present study, at rst, governing dynamics of the PS-CVT including one PG and full toroidal CVT and four FR mechanisms are established. Afterwards, the control strategy of the power train speed ratio is introduced. Two dierent vehicles are considered and the introduced PS-CVT is
used as their power train. Finally, the optimization is accomplished with the aim of minimizing the vehicles' FC in various driving cycles, while the optimization parameters are the speed ratios of the FR mechanisms.
2. Method
In this section, the model of the proposed PS-CVT is presented and the control strategy of this power train is illustrated. Then the optimization process of the power train is explained.
2.1. Power split continuously variable transmission
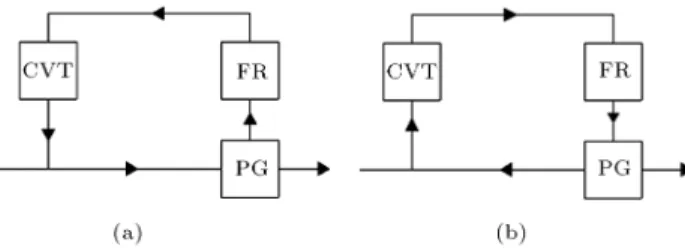
Due to the fact that CVT creates a narrow SR range, it is used in combination with PG and FR mechanisms to extend this range. There are several kinds of PS-CVT. One of the major kinds of PS-CVT is the series one. A simple diagram of series PS-CVT including FR, PG and CVT elements is shown in Figure 1.
As demonstrated in [3,6], there are only two types for PS-CVT power ow, including types 1 and 2 for which the power ow diagram of this power train is shown in Figure 2.
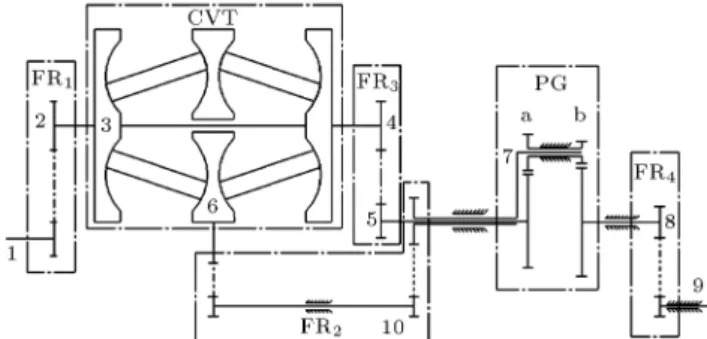
Embedding various FR mechanisms in dierent places in the PS-CVT, allows the input torque and speed of CVT to be changed. Due to the fact that CVT and therefore PS-CVT eciency is a function of input torque, speed ratio and rotational speed, proper design of FR mechanisms leads to improved power train eciency by operating CVT in its most ecient region. Figure 3 shows the proposed model of PS-CVT
Figure 1. A simple diagram of PS-CVT including FR, PG and CVT elements.
Figure 2. The power ow diagram of series PS-CVT for type 1 (a), and type 2 (b).
Figure 3. The proposed model of PS-CVT including one PG and full-toroidal CVT and four FR mechanisms.
Figure 4. Power ow direction between PS-CVT elements for type 1 of power ow.
including one PG and full-toroidal CVT and four FR mechanisms.
As can be seen, the FR mechanisms are embedded in all possible places in the PS-CVT. The power ow diagram of this model for type 1 is shown in Figure 4. 2.1.1. Governing dynamics of series PS-CVT
including four FR mechanisms
In order to calculate PS-CVT eciency, it is necessary to study the value of power ows through its elements. According to Figure 4, speed ratios of PS-CVT ele-ments are dened as:
FR1= !!2
1; CVT=
!6
!3;
FR2= !!7
6; FR3=
!5
!4;
FR4= !!9
8; PG=
!8 !7
!5 !7; (1)
!2= !3= !4:
Consequently, the speed ratio of the PS-CVT can be achieved by:
PS-CVT=!!9
1 = FR1FR4[PGFR3
+(1 PG)FR2CVT] : (2)
According to Eq. (2), FR1FR4FR3 and FR1FR4FR2
can be substituted with two other parameters in this equation, and utilization of dierent FRs do not have a
signicant eect in the kinematic behavior of PS-CVT. However, employing FR mechanisms in the input and output of the PS-CVT aects input torque, rotational speed and the speed ratio of CVT and PG. Due to the fact that CVT and PG eciencies are a function of these parameters, the embedded FRs can change their eciencies and therefore PS-CVT eciency. Therefore, these FRs may have a signicant eect on the power train eciency and therefore, the vehicle FC.
Referring to Eq. (2), PS-CVT speed ratio is a linear function of CVT speed ratio. Therefore, knowing the maximum and minimum of CVT and PS-CVT speed ratio, two constraint equations between speed ratios of dierent elements can be derived. These equations are discussed in the next paragraph.
In order to determine PS-CVT eciency, a dy-namic analysis should be carried out. As mentioned above, there are two types of power ow for series PS-CVT. Each of these types has individual advantages. As shown in [3], type 2 of power ow has more eciency in low speed ratios, while type 1 is more ecient in higher speed ratios. In this paper, we study type 1 and attempt to use it in its high eciency region. As demonstrated in [3], for the case of employing toroidal CVT, if the speed ratio of PS-CVT is positive, and CVT multiplicand in Eq. (2) (in this case, (1
PG)FR1FR2FR4) is also positive, type 1 of power ow
is obtained, and we will have: PS-CVT(max)=FR1FR4[PGFR3
+(1 Pg)FR2CVT(max); (3)
PS-CVT(min)=FR1FR4[PGFR3
+(1 Pg)FR2CVT(min): (4)
Using these equations, the values of PGFR3FR1FR4
and FR1FR2FR4 can be calculated. Considering
Figure 4, the sum of input and output power at point A is zero. In addition, regarding the equality of rotational speeds of elements 2, 3 and 4 in Figure 3, the sum of torques is zero, as:
P2+ P3+ P4= 0; (5)
T2+ T3+ T4= 0: (6)
According to the static equilibrium and power ow direction in PG place, we obtain:
PGP5+ P7+ P8= 0; (7)
T5+ T7+ T8= 0: (8)
Using the presented equations, PS-CVT eciency for positive speed ratios can be calculated by Eq. (9) as shown in Box I.
PS-CVT=PP9 1
= [CVTFR2(PGFR3 PS-CVT=FR1) + PGFR3PG(FR3 CVTFR2)] FR1FR4
CVTFR2CVTFR2FR3(PGFR3 PS-CVT=FR1) + FR3PG(FR3 CVTFR2): (9)
Box I
According to this equation, the eciencies of FR, PG and CVT elements should be determined to calculate PS-CVT eciency. Since the eciencies of the FR mechanisms is almost xed compared to the eciencies of PG and CVT, they are assumed a xed value (98%) [14]. Similarly, the eciencies of gear pairs in PG (P Gel) are assumed to be 98%.
The eciency of PG is achievable as a function of the connected elements' SR and gear pairs' eciency (P Gel) as follows [15,16]:
PG = 1 1 + 1 P GelP GelFR2CVT
PG(FR3 FR2CVT)
: (10)
To calculate full-toroidal CVT eciency, a model presented in [17] is used. In this model, its eciency is achieved as a function of its geometry, lubricating oil condition, and operating conditions, such as its speed ratio, input torque and rotational speed.
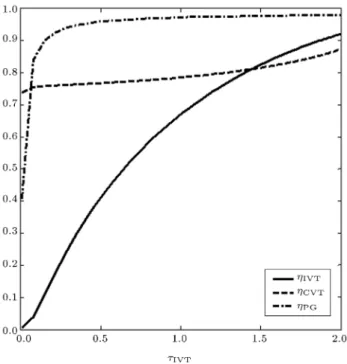
Figure 5 shows the eciencies of PS-CVT and its elements versus its SR, for a specic geometry of its elements.
As can be seen, PS-CVT eciency increases with the growth of its speed ratio. Moreover, CVT eciency will increase, too. The growth rate of CVT eciency is lower than its value for PS-CVT. The reason behind
Figure 5. Eciencies of PS-CVT and its elements for a specic geometry of its elements.
this is that increasing PS-CVT speed ratio decreases the value of power ows through CVT. Since CVT has the lowest eciency between PS-CVT elements, decreasing the power ow through CVT reduces the overall power loss, and therefore, PS-CVT eciency increases [6]. Consequently, PS-CVT eciency is severely dependent on its speed ratio.
In this section, the eciency of PS-CVT was derived as a function of its elements' eciency and SR. 2.2. Simulation and control of power train The model of the power train comprises a control unit which determines power ow through the power train elements including the engine, PS-CVT and clutch. The block diagram of the model is shown in Figure 6. According to this gure, the requested power of the vehicle at any point of the driving pattern can be calculated considering the vehicle speed and acceleration. Since the transmission eciency is not 100%, the engine required power is dierent from the vehicle required power. This power is achievable as:
Pengine=Prequired
PS-CVT: (11)
In the rst stage of the engine power calculation, PS-CVT eciency is unknown. Therefore, a rough estimate for its eciency is considered and the engine required power is determined. Subsequently, according to the control algorithm which will be illustrated in the following section, the engine operating point is determined, and regarding the vehicle speed, PS-CVT speed ratio is given by:
PS-CVT= SR = v Rdnd
!e : (12)
Figure 6. The block diagram of the powertrain simulation model.
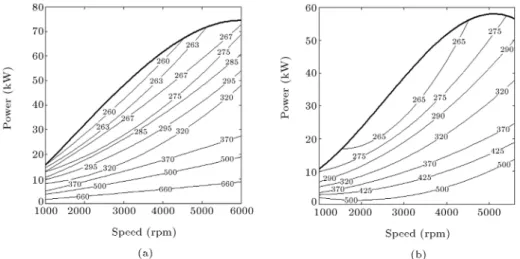
Figure 7. bsfc contours of the selected vehicles' engine: a) Vehicle A; and b) vehicle B.
Subsequently, knowing the power train input torque, speed and SR, its eciency can be derived using the presented model in the previous section. The engine required power is computed again. This procedure continues until PS-CVT eciency converges.
As mentioned, through application of PS-CVT, the speed ratio between the engine and the wheels is changed continuously, and there are an innite number of gears. Therefore, its SR control strategy is more complex than the conventional one, where there are only ve or six gears. One of the major concerns about PS-CVT power trains is their SR control strategy. One of the main control strategies is on the base of minimizing the vehicle FC. In this method, the experimental data of the engine Brake Specic Fuel Consumption (BSFC) is essential. In the present study, two vehicles in dierent classes are considered and the proposed power train is used in them. Figure 7(a) and (b) show BSFC contours of the selected vehicles' engine.
Vehicle A has an engine delivers power up to 100 hp, while the maximum power of the vehicle B's engine is 80 hp. As stated above, the amount of required power at any moment of the driving cycle can be calculated regarding the vehicle speed and its acceleration. For any value of the engine required power, there is a specic rpm, where the engine BSFC is minimal. For the selected vehicles' engine, these points are approximately on the curve of the engine maximum power. Having the vehicle speed and the engine rpm, the required SR of the power train can be determined. In addition to the BSFC map of the engines, the characteristics of the selected vehicles are necessary to calculate their FC in the driving cycles. These data are presented in Table 1.
The algorithm of FC calculation when employing the presented control strategy is introduced in [13], thoroughly. This method has been validated by com-paring the experimental data.
Table 1. The characteristics of the considered vehicles. Vehicle A Vehicle B
fr 0.013 0.013
CD 0.325 0.355
A ( m2) 2.26 2.09
m (kg) 1220 1100
Rd(m) 0.3108 0.279
nd 4.529 3.895
The SR range of the power train is determined according to the vehicle grade ability, its cruise speed and the engine fuel-optimal rpm [18]. As illustrated, by using the presented control strategy, the engine rpm is almost independent of the vehicle speed. Therefore, it is possible that the chosen SR is not in its determined domain. If it is larger than the upper bound of SR range (SRU), the PS-CVT speed ratio will be adjusted
to be equal to SRU, and the engine rpm will change to
create the demanded vehicle speed. Moreover, if the SR is smaller than the lower bound of the allowable range (SRL), similar to the conventional transmissions, the
power train creates the desired SR with the assistance of the clutch. In summary, if SR > SRU then SR =
SRU and !e = SRvnUdRd, but if SR < SRL, then SR =
SRL, !e= !idle, and the clutch is engaged.
In this section, the control algorithm of PS-CVT speed ratio and its input torque and speed was presented. The optimization will be accomplished through controlling PS-CVT by this algorithm. 2.3. Optimization of the power train
According to Eqs. (1)-(10), speed ratios of FR mecha-nisms and PG can be changed to increase the overall power train eciency and therefore decrease the vehicle FC in the driving cycle. In the present study, for the full-toroidal CVT part, the optimum geometry proposed in [17] is used. Its SR range is
[-0.9,-Table 2. The allowable range of the optimization parameters.
FR1; FR2; FR3; FR4 [1/8-8]
PG [0.1-10]
0.3]. Therefore, the optimization parameters are the speed ratios of FR1, FR2, FR3, FR4 and PG. Their
allowable ranges in the optimization process are shown in Table 2. These ranges are determined according to the geometrical constraints.
The aim of the optimization is to minimize the selected vehicles' FC in dierent driving cycles includ-ing ECE, EUDC, FTP and Urban Dynamometer. One of the chief concerns about optimization is that if the values of optimized parameters will be dierent in various conditions. In order to resolve this concern, a specic driving cycle which is the collection of the mentioned driving cycles, is considered. In this cycle, the vehicles' motion is considered in ECE, EUDC, FTP and Urban Dynamometer, subsequently. Since the travelled distance in these cycles are dierent, the value of FC in each of them is normalized with respect to the distance travelled in it. The sum of these values is chosen as the objective function. First, the optimiza-tion is implemented on the introduced parameters by considering the vehicles' motion in this cycle. Then, the vehicles' FC is calculated in each of the mentioned driving cycles, through using the optimized power train. Afterwards, the second stage, introduced in the following section, is applied. As mentioned, in the rst optimization, the optimization objective function is the FC of the vehicles in the combined driving cycle (collection of mentioned cycles). The optimization is carried out using Particle Swarm Optimization (PSO). In this method, each set of solutions is considered as a particle which has specic velocity and position. At each iteration, a new velocity for each particle is computed considering its distance from the global best position, the distance from its previous best position and its present velocity. Then, the new velocity is used to compute the resulting position of the particle in the search zone. This process is then repeated for a set number of times or until a minimum convergence rate is achieved [19]. This method is described in [20] comprehensively.
There are two constraints during the optimization process. The rst is on the SR range created by the optimized power train. As stated, this range is denite and is achieved considering the vehicle desired grade ability, cruise speed, and the engine fuel-optimal rpm. This range is [0.31-1.34] and [0.3-1.28] for vehicles A and B, respectively. During the optimization process, SR of the power train elements must be changed to create this range.
The second constraint is on the relation between
maximum and minimum of CVT and PS-CVT speed ratios. As stated, the necessary condition to achieve type 1 power ow is presented in Eqs. (3) and (4). Therefore, the optimization parameters must satisfy these equations.
In the case of violating the introduced constraints, an innite value is assigned to the objective function, and the optimization will start again.
In summary, the optimization problem can be described as follows:
Minimize FC subject to:
for vehicle A 8 < :
g1= PS-CVT(min) 0:31 = 0
g2= PS-CVT(max) 1:34 = 0
for vehicle B 8 < :
g1= PS-CVT(min) 0:3 = 0
g2= PS-CVT(max) 1:28 = 0
g3=PS-CVT(max) FR1FR4
PGFR3+ (1 PG)FR2CVT(max)= 0;
g4=PS-CVT(min) FR1FR4
PGFR3+ (1 PG)FR2CVT(min)
= 0; where: X = 8 > > > > < > > > > : FR1 FR2 FR3 FR4 PG 9 > > > > = > > > > ; :
2.3.1. Optimization results
After several runs, the optimized parameters for each of the vehicles are achieved. These values are shown in Table 3. As shown in this table, none of FR's speed ratios is close to 1, and it seems that embedding them in the exhibited places has signicant eects on the amount of optimization.
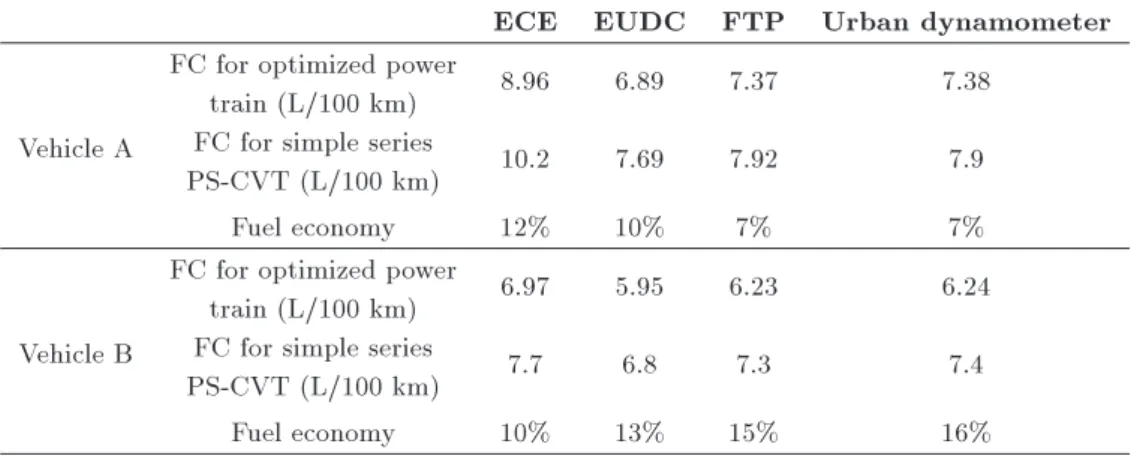
In order to precisely evaluate the eect of employ-ing FRs, the value of FC through utilization of a simple PS-CVT (Figure 1) for both vehicles is calculated in dierent driving cycles. As illustrated, for the specic geometry of CVT, there is no exible parameter in
Table 3. The optimized parameters in the combined driving cycle for vehicles A and B.
FR1 FR2 FR3 FR4 PG
Vehicle A 1.19 -4.32 1.14 0.97 1.4 Vehicle B 1.44 1.46 0.72 1.16 -3.1
Table 4. The vehicles' FC in dierent driving cycles for the case of using simple series PS-CVT, the optimized power train, and their dierences.
ECE EUDC FTP Urban dynamometer
Vehicle A
FC for optimized power
train (L/100 km) 8.96 6.89 7.37 7.38
FC for simple series
PS-CVT (L/100 km) 10.2 7.69 7.92 7.9
Fuel economy 12% 10% 7% 7%
Vehicle B
FC for optimized power
train (L/100 km) 6.97 5.95 6.23 6.24
FC for simple series
PS-CVT (L/100 km) 7.7 6.8 7.3 7.4
Fuel economy 10% 13% 15% 16%
simple series PS-CVT to optimize. Therefore, this PS-CVT does not need to be optimized in order to compare it with the proposed PS-CVT. The vehicles' FC for the case of using simple series PS-CVT and the optimized power train besides their dierences are shown in Table 4.
As clearly shown, a remarkable decrease in the ve-hicles' FC is observed when substituting the optimized PS-CVT for the simple one in all the driving cycles. Thus embedding FR mechanisms in the exhibited places and optimizing them has a signicant eect on the improvement of the vehicles' FC. Moreover, although the aim of optimization was to minimize the vehicles' FC in the combined driving cycle, there is also a considerable fuel economy in each of the driving cycles.
In the second stage of the optimization, the optimization is accomplished in case of considering the vehicles' motion in each of ECE, EUDC, FTP and Ur-ban Dynamometer cycles, and the minimal FC values are obtained. Finally, these values are compared with the values achieved in the rst stage of optimization. If the dierence between these values is negligible, it can be concluded that there is a specic power train that gives a remarkable fuel economy in all the mentioned driving cycles. The values of the vehicles' FC equipped with the optimized power train, and the amounts of FC reduction compared to the application of simple series PS-CVT are shown in Table 5.
The results shown in Tables 4 and 5, reveal that there is no signicant dierence in the amounts of the fuel economies between the rst and second optimization results, for each of the vehicles and for any of the driving cycles. For example, in the FTP driving cycle, the values of fuel economies of vehicle A for stages 1 and 2 of optimization are 7% and 8%, respectively. Therefore, the vehicles power train can be designed according to the parameters shown in Table 4.
3. Conclusion
The present study aimed to introduce the series PS-CVT in which four additional xed ratio mechanisms are embedded as the vehicle power train, and then to optimize the added xed ratio mechanisms. Af-ter presenting the governing dynamics of this power train, the proposed power train was optimized for two considered vehicles. A combined driving cycle which was a collection of ECE, EUDC, FTP and Urban Dynamometer was introduced and an optimization was accomplished in this driving cycle for both considered vehicles. FC values of the vehicles equipped with the optimized power trains were calculated. Then, the optimization was repeated for each of the mentioned driving cycles. Finally, it was investigated whether there is a remarkable dierence in the vehicles' FC between the rst and second optimization results. It was shown that, the optimized power train achieved
Table 5. The optimization results for vehicles A and B.
ECE EUDC FTP Urban dynamometer Vehicle A
FC for optimized power
train (L/100 km) 8.87 6.87 7.32 7.31
Fuel economy 13% 11% 8% 8%
Vehicle B FC for optimized powertrain (L/100 km) 6.83 5.67 6.22 6.16
from the rst optimization gives a fuel economy near to the case of using the second optimization results in each of driving cycles and for each of the considered vehicles. Therefore, it seems that there is a specic power train for each of the vehicles that gives a remarkable fuel economy in each of the mentioned driving cycles.
Nomenclature Speed ratio !e Engine rpm
A Vehicle frontal area
CD Aerodynamic drag coecient
Rd Wheel's radius
m Vehicle mass
nd Speed ratio of nal drive
P Power T Torque
Mechanical eciency
fr Rolling resistance coecient of the
vehicle
P Gel Gear pairs eciency in planetary gear
train
v Vehicle speed
References
1. Srivastava, N. and Ul-Haque, I. \On the transient dynamics of a metal pushing V-belt CVT at high speeds", Int. J. of Vehicle Des, 37(1), pp. 46-66 (2005).
2. Belore, N.P. and Stefani, G.D. \Ball toroidal CVT: A feasibility study based on topology, kinematics, statics and lubrication", Int. J. of Vehicle Des, 32(3), pp. 304-331 (2003).
3. Mangialardi, L. and Mantriota, G. \Power ows and eciency in innitely variable transmissions", J. of Mech. Mach. Theory, 34(7), pp. 973-994 (1999).
4. Brockbank, C. and Burtt, D. \Innitely and continu-ously variable full toroidal traction drive transmissions for transverse applications in sub A, A & B sector vehicles", Int. Conf. Transmission, Paris, France, pp. 12-17 (2007).
5. Mantriota, G. \Case study: Innitely variable trans-missions with automatic regulation", P I MECH ENG D-J AUT, 215(12), pp. 1267-1280 (2001).
6. Mantriota, G. \Performances of a series innitely variable transmission with type I power ow", J. of Mech. Mach. Theory, 37(6), pp. 579-597 (2002).
7. Mantriota, G. \Performances of a parallel innitely variable transmissions with a type II power ow", J. of Mech. Mach. Theory, 37(6), pp. 555-578 (2002).
8. Delkhosh, M., Saadat Foumani, M. and Boroushaki M. \Geometrical optimization of parallel innitely variable transmission to decrease vehicle fuel consump-tion", J. of Mechanics Based Design of Structures and Machines, 42(4), pp. 483-501 (October 2014).
9. Bottiglione, F., De Pinto, S. and Mantriota, G. \In-nitely variable transmissions in neutral gear: Torque ratio and power re-circulation", Mechanism and Ma-chine Theory, 74, pp. 285-298 (2014).
10. Fen Zhu, J. and Hao Hua, D. \The transmission perfor-mances of traction innitely variable transmission used in electric vehicle power train", Applied Mechanics and Materials, 271-272, pp. 1239-1243 (2012).
11. Pan, H. and Cai, X. \Study on characteristics of metal V-Belt innitely variable power-split transmission", Advanced Materials Research, 383-390, pp. 785-789 (2011).
12. Carbone, G., Mangialardi, L. and Mantriota, G. \A comparison of the performances of full and half toroidal traction drives", Mechanism and Machine Theory, 39(9), pp. 921-942 (2004).
13. Delkhosh, M. and Foumani, M.S. \Optimisation of full-toroidal continuously variable transmission in conjunc-tion with xed ratio mechanism using particle swarm optimisation", Vehicle Syst. Dyn., 51(5), pp. 671-683 (2013).
14. Del Castillo, J.M. \The analytical expression of the ef-ciency of planetary gear trains", Mech. Mach. Theory, 37(2), pp. 197-214 (2002).
15. Pennestr, E. and Valentini, P.P. \A review of formulas for the mechanical eciency analysis of two degrees-of-freedom epicyclic gear trains", J. of Mech. Design, 125, pp. 602-608 (2003).
16. Maggiore, A. \The eciency of epicyclic two DOF gear trains", Int. Conf. Theoretical and Applied Mechanics (1971).
17. Delkhosh, M. and Saadat Foumani, M. \Multi-objective geometrical optimization of full toroidal CVT", Int. J. of Automot Techn., 14(5), pp. 707-715 (2013).
18. Jazar, R.N., Vehicle Dynamics: Theory and Applica-tion, Springer, pp. 187-200, US (2008).
19. Delkhosh, M., Foumani, M.S., Boroushaki, M., Ekhtiari, M. and Dehghani, M. \Geometrical optimiza-tion of half toroidal continuously variable transmission using particle swarm optimization", Scientia Iranica, 18(5), pp. 1126-1132 (2011).
20. Clerc, M., Particle Swarm Optimization, John Wiley & Sons (2010).
Biographies
Mojtaba Delkhosh received his BSc and MSc degrees in Mechanical Engineering from Sharif University of
Technology in 2009 and 2011, respectively. Presently, he is PhD student of Applied Mechanical Engineering, Sharif University of Technology, Tehran, Iran. His elds of interests are vehicle dynamics, machine design, vibration analysis, power transmission systems and optimization algorithms.
Mahmoud Saadat Foumani received his PhD degree in Mechanical Engineering from Sharif University of
Technology, Tehran, I.R. Iran, in 2002. He was a Faculty member at Semnan University from 2002 to 2006, and is now a faculty member of Sharif University of Technology, Mechanical Engineering De-partment. He teaches courses in `Applied Design group' at undergraduate and graduate levels. His teaching focuses on mechanical Engineering design, vehicle dynamics, chassis design and advanced math-ematics.