Design and Experimental Validation of Continuous DNA Separation using
ITP-Based Microfluidic Device
N. C. M. Goscinski, M. E. Rosa, E. K. Wheeler, M. Shusteff
Abstract:
We have demonstrated a chip-based microfluidic device suitable for rapid and high-throughput DNA separation and purification for downstream analysis. The glass-based device incorporates a transverse free-flow isotachophoresis (tFF-ITP) that overcomes the volume limitations of CE approaches, and allows continuous sample processing in contrast to batch-mode solid-phase extraction (SPE). The device is able to focus DNA at flow rates up to 100 uL/min, and sample conductivity up to 2 mS/cm. Downstream of the chip, 30-40% of DNA from the input sample is recovered as a result of ITP focusing, and preliminary results indicate that this design is able to purify DNA from contaminating species, particularly those that inhibit PCR.
Introduction:
Developing rapid methods of purifying DNA for downstream analysis continues to be important. While sample preparation requirements vary for different DNA applications (compare next-generation sequencing (NGS) to short-tandem repeat (STR) profiling), solid-phase extraction (SPE) methods continue to dominate [refs], especially among commercially-available technologies. Many microfluidic approaches have been explored to attempt to overcome the limitations inherent to the large-volume batch-based processes of SPE. Prominent among these are DNA microelectrophoresis methods [refs], including capillary-based and chip-based techniques. Capillary methods are high-sensitivity and relatively simple to implement, but are limited to small injection volumes (~100 nL) [refs]. Isotachophoresis (ITP) is a promising method due to the high sample concentration ratios that are achievable [ref Jung]. In addition a number of recent microfluidic free-flow electrophoresis (FFE) devices have demonstrated processing of larger sample volumes by a variety of methods including IEF, CZE, and ITP [refs]. Most such devices have analyzed small dye molecules, and concentration and purification of DNA has not been demonstrated. This work takes advantage of the concentration and purification advantages of ITP in combination with the high-volume, continuous-throughput processing of FFE devices. We have designed, fabricated and tested a microfluidic device to continuously extract and isolate DNA from liquid samples in a high-throughput fashion. This approach can be useful in many applications requiring non-specific extraction of total nucleic acid content. It is particularly advantageous for recovering and purifying DNA where it is present in low copy numbers in contaminated matrices, such as in forensic samples.
The device described here uses a geometry which applies the electric field transversely to the flow direction (characteristic of FFE). The input sample is spiked with a suitable concentration of trailing electrolyte (TE) and flows side by side with a stream containing the leading electrolyte (LE), and electromigration of all species perpendicular to the flow direction results in a band of focused analyte which exits via a dedicated chip outlet, with TE and LE and any unfocused contaminants to either side of it. The chemistry used is PCR-compatible, and there is much flexibility in choosing buffers to optimize for DNA separation from specific contaminant types.
Chemicals and Reagents
: Acrylamide/Bis-Acrylamide (19:1; 40% (v/v)), 3-(Trimethoxysilyl)-
propyl
methacrylate (98%) , acetic acid (glacial), humic acid (technical grade), porcine hematin, HEPES (99.5%), and Tris base (99.8%) were purchased from Sigma Aldrich (St. Louis, MO). Deionized ultra-filtered water was purchased from Fisher Scientific (Waltham, MA). Human genomic DNA (HGD) was purchased from Applied Biosystems (Carlsbad, CA) and sheared salmon sperm DNA (SSD) was purchased from Ambion (Carlsbad, CA). The intercalating DNA dye Quant-iT Picogreen, Platinum Taq polymerase, PCR buffer, and MgCl2 were purchased from Invitrogen (Carlsbad, CA). dNTPs werepurchased from New England Biolabs (Ipswitch, MA). VA-086 photoinitiator was purchased from Wako Chemicals (Richmond, VA), fluorescein (standard grade) was purchased from Fluka Chemicals
(Steinheim, Germany) and 10 mM Tris/1 mM EDTA (“1x TE”) was purchased from Teknova (Hollister, CA).
Chip Fabrication:
ITP separation chips were fabricated using standard glass wet-etching microfabrication methods. Briefly, borofloat glass wafers were RCA cleaned, then thin-film metal (Cr-Au, total thickness 320 nm) sputter deposited on both sides of the wafer for use as an etch mask. The metal layer was patterned by standard photolithography followed by wet-etching by standard Au and Cr etchants (Transene, Cyantek). Electrode insertion channels were etched to a depth of 100 um by isotropic etching in 22% hydrofluoric acid (HF) with 78% acetic acid with stirring. HF is extremely toxic and corrosive, and should only be used with the proper personal protective equipment in appropriate chemical hoods by trained personnel. After stripping the Cr-Au mask, the entire metal masking, and patterning process was repeated with a second mask to generate the ITP fluid channels. This pattern overlays the first one and was etched to a depth of 70 um, deepening the electrode-insertion channels to a total depth of 170 um. A second
borofloat glass wafer was pre-drilled with cylindrical through-holes for fluid ports. This pre-drilled wafer was likewise sputtered with Cr-Au, and patterned for electrode-insertion channels, which were etched to a depth of 170 um. After stripping all metal masks, the wafer pair was RCA cleaned, aligned using an EVG-620 aligner, then and thermally fusion bonded together at 640 deg. C in a nitrogen atmosphere. Finally, Pt 0.01” diameter electrode wires (vendor ) were inserted into the electrode slots, and glued in place with UV-curable adhesive (Norland).
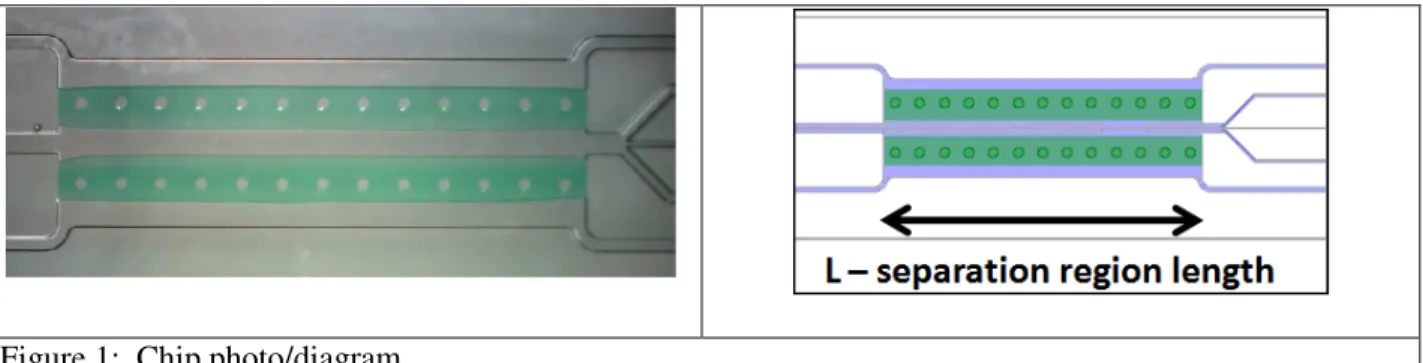
Figure 1: Chip photo/diagram
Instrumentation: A 2000 UV flood lamp (Dymax, Torrington, CT) was used to cure polyacrylamide gels. An Axiovert S100 inverted epifluorescence microscope (Zeiss, Oberkochen, Germany ) equipped with a CoolSnap HQ CCD camera (Photometrics, Tuscon, AZ ) was used to visualize the chip. Images were obtained using WinView 32 (Princeton Instruments) and processed with ImageJ (NIH). A PS350 power supply from Stanford Research Systems (Sunnyvale, CA) was used to induce ITP.Off-chip quantitation of DNA was performed with a Qubit Fluorometer (Invitrogen, Carlsbad, CA) and off-chip PCR was performed on an iCyclerthermocycler (Bio-Rad, Hercules, CA).
Procedures
:
Isolation of DNA via Isotachophoresis: Upper and lower electrode chambers on the chip were filled with TE (2 M HEPES-NaOH, pH 7.6, σ 10.7 mS/cm) and LE (2 M Tris-HCl, pH 8.6, σ 28.7 mS/cm) respectively. Dilute LE (100 mM Tris-HCl, pH 8.3, σ 3.3 mS/cm) and TE (10 mM HEPES-NaOH, pH 6.8, σ 0.34 mS/cm) were introduced into the central channel of the chip. The DNA to be focused was spiked into the TE at various concentrations, ranging from 10 ng/mL to 32 ug/mL. For work requiring visualization of DNA behavior on-chip, the DNA was labeled with 1x Picogreen fluorescent dye before being spiked into the TE.
All solutions were introduced to the chip via positive pressure from syringe pumps. The outer (electrode) channels were run at 100-200 uL/min, while the inner (separation) chamber’s fluid was pumped through at 10-100 uL/min. DNA focusing was achieved by applying potentials ranging from 20 V to 150 V across the electrodes, resulting in fields of 234-2728 V/cm across the separation channel (Figure 1). Balanced flow was achieved by attaching ~30 cm lengths of 150 µm ID capillary tubing to the 3 center outlets to provide flow restriction.
Off-Chip Quantitation: The concentration of DNA in chip effluent was determined by fluorometric quantitation. Effluent was diluted 1:10 into a solution of 1x Tris-EDTA buffer/1x PicoGreen, allowed to incubate for 2 minutes, and the intensity of fluorescence at 520 nm was measured. Although the
fluorometer used was capable of calculating nucleic acid concentrations, an external eight-point curve was used to determine DNA concentrations in chip effluents, as the relative error for the external curve was smaller than that of the two-point internal curve the utilized by the instrument (data not shown).
Off-Chip PCR: The purity of DNA isolated via ITP was determined by amplifying chip effluent via qPCR (Tables S-A, B). This assay was performed on effluent containing 133 ng HGD/mL and on effluent containing 133 ng HGD/mL spiked with a PCR inhibitor mix based on that used by (Brevnov 2009). All samples bound for PCR were blanked with a solution consisting of 1:10 1x Tris-EDTA buffer in 10 mM HEPES-NaOH, which had been run through the chip (0 V) after the chip had been flushed with the electrolyte system described above (at a potential of 864 V/cm) for thirty minutes (Flow rates used for flushing were 50 µL/min in the separation chamber and 200 µL/min in the electrode chambers).
Results and Discussion:
Efficiency of Focusing and Delivery:
standards containing 0, 2.5, 5, 10, 15, 20, 25, 30 ng PicoGreen-labeled HGD/mL 10 mM HEPES; its equation was y=12.86x+22.68 (R2=0.9995).
Relatively low potentials were required to achieve focusing of DNA. Focusing occurred when potentials greater than 234 V/cm were applied, and the focusing became ‘tight’ (over 66% of PCR-ready DNA exited from center outlet) above 864 V/cm (figures 2,3). All voltages above this focused the DNA marginally more sharply. The best focusing of DNA into the center channel occurred at 864 V/cm, when both PCR and fluorometry indicated that >70% of total DNA exited via the center channel (Table 1). At higher voltages, the DNA began to focus into the bottom outlet rather than the center.
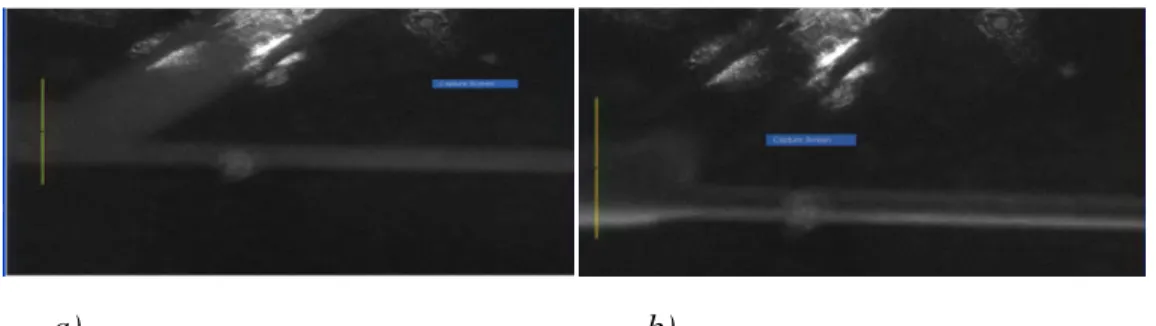
a)
b)
Figure 2: PicoGreen-labeled Salmon Sperm DNA (2 µg/mL) at 0 V (a) and 50 V/cm (b).a) b)
Figure 3: Fluorescence Intensity vs Relative Channel Location for 2 µg SSD/mL at 0 V (a) and 50 V (b)
Table 1: Focusing Efficiencies of 13 mm ITP Chip
PCR Fluorometry
Potential (V/cm) Average Focusing Efficiency (133 ng HGD /mL) (%)
Average Focusing Efficiency: (10 ng HGD/mL) (%)
Average Focusing Efficiency (133 ng HGD /mL) (%)
Average Focusing Efficiency: (10 ng HGD/mL) (%)
0 36.8 21.4 38.2 Incalculable
([DNA]center<
LOQ)
518 40.2 71.5 65.7 100
692 62.6 95 78.2 100
Minimal concentrations of DNA were needed to achieve focusing: for camera detection, the LOD for focused DNA was 2 µg/mL, while PCR indicated that 10 ng HGD/mL focused well at 15 V/cm (Table 1). Additionally, lower concentrations of DNA actually focused more sharply than higher concentrations of DNA (Table 1). This may be because at lower concentrations, the strands of DNA are able to move freely in the electric field, without encountering interference from fellow nucleic acids.
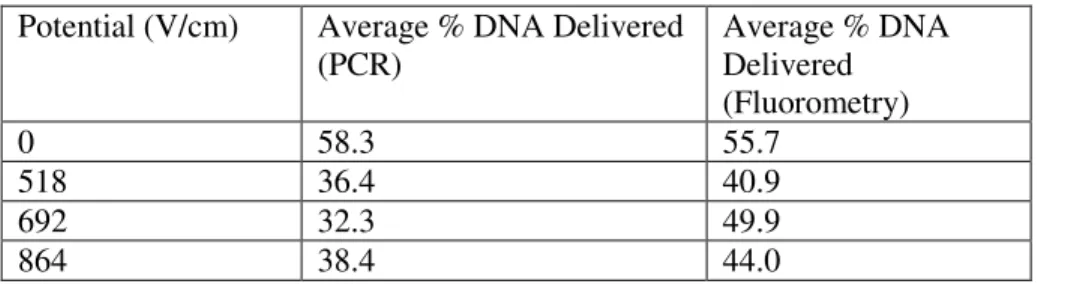
Delivery efficiencies for the chip varied with electrical potential, with the maximum amount of DNA actually delivered when no potential was applied (Table 2).
Table 2: Average Delivery Efficiencies of 13 mm ITP Chip
Potential (V/cm) Average % DNA Delivered (PCR)
Average % DNA Delivered (Fluorometry)
0 58.3 55.7
518 36.4 40.9
692 32.3 49.9
864 38.4 44.0
The significant fraction of DNA that does not exit the chip may be migrating into the polyacrylamide gels flanking the separation chamber, due to the fact that at high voltages, DNA tends to isotachophoretically migrate toward the anode (Janasek 2006). This presumption is supported by the observation of
fluorescence in the leading gel after a potential has been applied, even though the main stream of focused DNA remained in the center of the separation channel.
Table 3: Post-ITP Inhibition of PCR
Sample (all in 10 mM HEPES-NaOH)
Post-Chip Effluent, 0 V/cm Post-Chip Effluent, 864 V/cm Outlet % DNA
Exiting*
% DNA Delivered
Outlet % DNA
Exiting*
% DNA Delivered
HGD (133 ng/mL)
Top 45.5 40.7 Top 15.9 26.4
Center 45.4 Center 69.5
Bottom 9.1 Bottom 26.1
HGD (133 ng/mL) with inhibitor mix
Top 0 Incalculable,
due to complete inhibition of pre-chip DNA.
Top 54.7 Incalculable,
due to complete inhibition of pre-chip DNA.
Center 0 Center 0
Bottom 100 Bottom 45.3
*Percentages in this table refer to the relative amount of DNA that was amplified via PCR
separation chamber flow rate of 20 μL/min, our device allows for isolation of DNA 2-400x more rapidly than previously reported devices (Janasek 2006, Frost 2010)
Quality of Focusing:
Increasing the ratio of electrode chamber flow to separation chamber flow resulted in more stable focusing of DNA, due to the fact that more rapid removal of bubbles (generated by the hydrolysis of water at voltages above 3 V [Albrecht 2006]) led to a more stable electric field across the chip. With an outer flow rate of 200 µL/min and an inner flow rate of 20 µL/min, DNA remained focused for over three minutes at both 351 and 703 V/cm. However, when the inner flow was outside the range of 20-30
µL/min, the DNA stream would fluctuate rather than remain relatively stationary and DNA was delivered to multiple outlets.
Purity of Focused DNA:
DNA was separated from fluorescein via ITP at 1455 V/cm (figure 4); however, this was done using a non-standard buffer system consisting of ε-amino-caproic acid, with aspartate as a non-fluorescent spacer between the DNA and fluorescein. (See S-E for LE and TE compositions.)
Off-chip PCR amplified pre- and post-chip HGD successfully, with the most amplifiable DNA exiting via the center sample outlet. When PCR inhibitors were run through ITP with HGD, a small amount of DNA in the bottom channel was amplified at 0 V, and amplification occurred in the top and bottom channels at 518, 692 and 864 V/cm, indicating that the inhibitors present focused sharply in the center channel, and that any unfocused inhibitors in the top and bottom channels were present below their minimum
inhibitory concentration. The small quantities of amplifiable DNA detected in top and bottom channels were comparable to those found in said channels when no inhibitors were present, indicating that the inhibitors did not affect the focusing of DNA.
a)
b)
Figure A: Separation of fluorescein and SSD at 1455 V/cm (a); fluorescence intensity vs location (b)
Conclusion:
A free-flow microfluidic device utilizing isotachophoresis for the continuous isolation of DNA has been developed. The device focuses 70-100% of output DNA into the central output channel, depending upon the applied potential. Lower concentrations of DNA focus more accurately than higher concentration samples, perhaps due to lower intermolecular effects on nucleic acid mobility. The device is capable of extracting 30-40% of DNA from the sample when an electric field is applied. The chip’s internal geometry permits small differences in electrophoretic mobility to be exploited in separating nucleic acid from other molecules. A PCR-friendly chemistry permits amplification and analysis of outputs.
Additionally, the chemistries used to induce ITP in this device are flexible, and preliminary results suggest that removal of impurities is readily achievable. The continuous manner of extraction coupled with tight analyte focusing make this device suitable for high-throughput isolation of DNA in sample preparation applications where purity is a major concern in downstream analysis and total extraction efficiency is of lesser importance
Abbreviations Used:
HGD: Human Genomic DNA SSD: sheared Salmon Sperm DNAAcknowledgements:
This work was performed under the auspices of the U.S. Department of Energy by Lawrence Livermore National Laboratory under Contract DE-AC52-07NA27344. Release number LLNL-JRNL-522419.
References:
Albrecht, J., Jensen, K. (2006). Micro Free-Low IEF Enhanced by Active Cooling and Functionalized Gels. Electrophoresis 27:4960-4969.
Brevnov, M., Pawar, H., Mundt, J., Calandro, L., Furtado, M., Shewale, J. (2009).
Developmental Validation of the PrepFiler™ Forensic DNA Extraction Kit for Extraction of Genomic DNA from Biological Samples. J. Foren. Sci. 54 (3): 599-607.
Frost, N., Bowser, M. (2010). Using Buffer Additives to Improve Analyte Stream Stability in Micro Free Flow Electrophoresis. Lab on a Chip 10: 1231-1236.
Janasek, D., Shilling, M., Franzke, J., Manz, A. (2006). Isotachophoresis in Free-Flow Using a Miniaturized Device. Analytical Chemistry 78: 3815-3819.
Marshall, L., Santiago, J. (2011). Extraction of DNA from Malaria-Infected Erythrocytes Using Isotachophoresis. Analytical Chemistry (ja)
Prest, J. et al. (2007). Miniaturized Isotachophoresis of DNA. Journal of Chromatography A, 1156:154-159.
Qi, L., et al. (2009). Rapid and Efficient Isotachophoretic Preconcentration in Free Solution Coupled with Gel Electrophoresis Separation on a Microchip Using a Negative Pressure Sampling Technique. Journal of Chromatography A 1216: 4510-4516.
Supplementary Information:
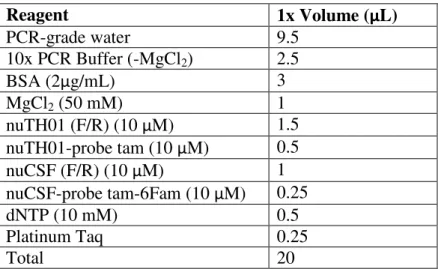
Table S-A: PCR Mix composition
Reagent
1x Volume (μL)
PCR-grade water
9.5
10x PCR Buffer (-MgCl
2)
2.5
BSA (2
μ
g/mL)
3
MgCl
2(50 mM)
1
nuTH01 (F/R) (10
μ
M)
1.5
nuTH01-probe tam (10
μ
M)
0.5
nuCSF (F/R) (10
μ
M)
1
nuCSF-probe tam-6Fam (10
μ
M)
0.25
dNTP (10 mM)
0.5
Platinum Taq
0.25
Total
20
Table S-B: Thermal Parameters for PCR
Sample Volume: 25.00 uLCollecting Well Factors 95°C for 00:30 95°C for 00:30 (2x)
Cycle
1:
95°C for
03:00
Cycle
3:
72°C for
02:00
Cycle
4:
15°C HOLD