Megan H. Slemons. Design Standards for LibGuides: Does Better Design Lead to Greater Use? A Master’s paper for the M.S. in L.S. degree. March, 2013. 54 pages. Advisor: Jeffrey Pomerantz
Web-based research guides are a major service provided by academic libraries, which require a significant investment of staff time to create and maintain. These guides, however, are not heavily used. Librarians need to understand the factors influencing the use a guide receives in order to make improvements that will increase usage. The literature suggests many design standards for guides to follow, but no quantitative assessment has been undertaken to determine whether good design really does increase research guide use.
In a case study of LibGuides at Kennesaw State University, use of guides is regressed against a specific list of design and usability standards based on the library science and web design literature. The results demonstrate the effect each variable has on use and how well design predicts use overall. A list of standard design recommendations is presented, and other factors influencing guide use are also considered.
Headings:
Academic libraries
Computer assisted instruction
DESIGN STANDARDS FOR LIBGUIDES: DOES BETTER DESIGN LEAD TO GREATER USE?
by
Megan H. Slemons
A Master’s paper submitted to the faculty of the School of Information and Library Science of the University of North Carolina at Chapel Hill
in partial fulfillment of the requirements for the degree of Master of Science in
Library Science.
Chapel Hill, North Carolina March 2013
Approved by
Table of Contents
Introduction ... 3
Literature review ... 5
Need for standardization ... 5
Need for assessment ... 5
Specific design and usability recommendations ... 6
Clean Design... 6
Avoid Clutter ... 6
Authority and Professional Appearance ... 7
Front-Load Content ... 7
Provide Alternate Navigation ... 8
Organizational Structure ... 9
Tabs ... 9
Labeling ... 10
Annotations ... 11
Librarian Profile ... 11
Links ... 12
Weeding ... 12
Web 2.0 Features ... 13
Other Factors Influencing Use Besides Design... 13
Course Guides vs. Subject Guides ... 13
Access Point ... 14
Marketing... 15
In Instruction and Reference Sessions ... 15
With Faculty... 16
In the Library ... 16
Data gathering ... 18
Regression model ... 19
Expected Coefficient Signs ... 21
Other Important Statistics... 22
Limitations of this study ... 22
Data Summary and Analysis ... 25
Subject Guides... 25
Course Guides ... 27
Library Guides... 28
Discussion ... 31
Specific Design Recommendations ... 32
Further Research ... 34
Conclusion ... 36
References ... 37
Appendix A: Subject Guides Regression Results ... 42
Appendix B: Course Guides Regression Results ... 45
Appendix C: Library Guides Regression Results ... 49
List of Tables
Table 1. Subject Guides Regression Results (All Design Variables) ... 25Table 2. Subject Guides Correlation between USE and STUDENTS ... 26
Table 3. Course Guides Correlation between USE and STUDENTS ... 28
Table 4. Library Guides Correlation between USE and INSTR ... 30
Introduction
Online research guides are a standard service in academic libraries, as well as some school, public, and special libraries. These guides are created by librarians to help patrons locate reliable resources in a given subject area. Research guides require a good deal of time to create and maintain; however, the library science literature reveals that they tend to not be heavily used. Students still turn in droves to the familiarity of Google to complete their research assignments, either unaware or unwilling to use the library guides. Librarians need to understand the factors that influence the use of these guides in order to adapt them to better serve the needs of their patrons.
To analyze whether adherence to design and usability standards increases the use of online research guides, I propose a case study of online research guides at the Horace W. Sturgis Library at Kennesaw State University, a public university of over 23,000 students located in the northwest suburbs of Atlanta. The results of the Sturgis Library’s 2010 LibQUAL survey revealed that undergraduates, graduate students, faculty, staff, and even library staff desire improved online resources to help them find information on their own. For all five groups, the “perceived” level of service was less than the
“desired” level for three topics relevant to this study: “A library Web site enabling me to locate information on my own,” “Easy-to-use access tools that allow me to find
a great tool for librarians serving patrons who are increasingly self-sufficient and “have grown to expect Google’s immediacy and accessibility” (Anello & Bonfield, 2007, p. 32).
In July 2010, KSU’s Sturgis Library implemented LibGuides, a
content-management system for research guides that has taken the academic library world by storm. KSU currently has 62 published LibGuides, which received a total of 44,578 hits from January 2011 through December 2012. Librarians have steadily added to KSU’s LibGuides collection, with guides for general subjects, individual courses, and library research skills. Data also reveal that the guides have received continually increasing use since implementation and that visits have increased 39 percent from 2011 to 2012. While this data is positive and demonstrates a good deal of use, visits to LibGuides still make up only a small percentage of traffic to the library’s website. There is still room to greatly increase use of KSU’s LibGuides.
This paper includes three parts. First, a literature review of previous library studies and recommendations from web usability experts is presented. Second, a regression analysis is conducted to determine the effect of selected design variables on use. Third, a set of recommended design guidelines is proposed to target some
fundamental areas of need in standardizing and improving LibGuides both at KSU and other institutions.
Literature review
Need for standardization
The need for standardization of the look and feel of LibGuides is well-covered in the literature (Jackson & Pellack, 2004, p. 320, 324) (Hintz et al., 2010, p. 42). Having a standard appearance and format across all guides helps users “begin to recognize them as a library product” (Adebojono, 2010, p. 404). Furthermore, studies have found that a consistent format is a key usability desire for students, who prefer sites like Wikipedia, because “their goals are speed and simplicity” and “they know what to expect of the Wikipedia format and know how to navigate quickly” (Strutin, 2008, para. 24).
Consistent layout between guides seems to be a key issue. A LibGuides usability study at the University of Washington found that “inconsistent layouts confused the users” and “made it hard for them to find resources” (Hungerford et al, 2010, p. 6).
Need for assessment
The creation and maintenance of LibGuides represent a significant time
on them as tools for introducing students to library materials” (Reeb & Gibbons, 2004, p. 123).
Specific design and usability recommendations
A review of previous library studies, as well as guidelines from web usability experts, suggests several topics that are key for creating the most efficient and beneficial LibGuides.
Clean Design
Numerous studies have found that ease of use, simplicity, and clarity are among users’ top usability concerns with LibGuides (Ouellette, 2011, p. 436, 444) (Hintz et al., 2010, p. 45). Researchers have found that “the most consistently noted problem with subject guides is that users are overwhelmed by clutter” (Ouellette, 2011, p. 444). Users desire a clean layout, clear navigation, simple and concise wording, and brevity (Hintz et al., 2010, p. 47) (Springshare, 2013). Hintz et al. found that “while content and
comprehension are important, visual appeal can be a deciding factor in determining which guides students would most likely use” (2010, p. 45).
Avoid Clutter
only a few quality resources are highlighted, another option to create easier navigation is to split them into separate guides based on more narrow sub-topics (Gilmour, 2010, p. 357)(Ouellette, 2011, p. 445)(Staley, 2007, p. 130). Studies have even found that the presence of white space increases comprehension and improves users’ satisfaction (Fadeyev, 2009).
Authority and Professional Appearance
Librarians have an opportunity to reinforce their credibility with quality
LibGuides, as students approach them seeking “authoritative information from accepted experts” (Hintz et al., 2010, p. 47). Since the guides are a part of the library website, they should be current, free of typos, and have active hyperlinks (Judd & Montgomery, 2009, p. 17). Jackson and Pellack explain that “it seems irresponsible of libraries to offer their users outdated or inaccurate guides” and “if librarians want their users to look to their guides as a more authoritative alterative to search engines, then offering poor guides is contradictory to that goal” (2004, p. 325).
Studies have indicated that users judge a website’s credibility in part based on its design, including layout, consistency, typography, color, style, errors, update rate, and ease of use (Fadeyev, 2009). Springshare (2013) also reminds guide creators that a professional, easily-read font should be defined system-wide, and certainly should not be customized within boxes. Furthermore, they advise authors to use bold, italics, and color sparingly, and to avoid underlining unless the item is a hyperlink.
Front-Load Content
should include the most important information and that users will “probably read more of the first paragraph than the second.” There is substantial evidence that users are willing to scroll down a page, despite the traditional belief that scrolling is not preferred
(Tarquini, 2007) (Fadeyev, 2009). However, users will only scroll down the page if the content appears worthwhile – “if it is compelling, users will follow where it leads” (Tarquini, 2007). It is key to make clear to users up front what content is included, because “if they have to scroll to even discover what the site is, its success is unlikely” (Tarquini, 2007).
Research has definitively shown that students use subject guides primarily to access databases, because their goal is to find articles to complete their assignments quickly (Ouellette, 2011, p. 443-444). Given these findings, databases should be clearly highlighted in research guides among the most important information. Ouellette suggests possible solutions as placing the top three databases on the guide’s homepage or making the databases tab the default (2011, p. 445, 448).
Provide Alternate Navigation
Organizational Structure
Librarians must decide on a consistent organization scheme for each guide, either by type of resource or subdivisions within a subject area, but not both (Ouellette, 2011, p. 446) (Jackson & Pellack, 2004, p. 326) (Nielsen, 2007). One study pointed out that organization by sub-disciplines has “the advantage of following the way that practitioners think about their discipline rather than the way librarians think about it” (Gilmour, 2010, p. 351) and that students “do not approach research by format” but rather by topic or task and are only interested in format organization within sub-topics (Sinkinson et al, 2012, p. 79). Librarians must also consider the organization of materials within tabs, because “having a random arrangement can stymie patrons looking for a specific link” (Jackson & Pellack, 2004, p. 322). Gilmour explains that users who are accustomed to Google assume the most relevant results come first and “will focus on the first few links and give decreasing attention to those farther down the page” (2010, p. 357). Web usability expert
Jakob Nielsen emphasizes that the most important information needs to be above the “page fold,” or the area initially viewable when a page is opened, since this is where users spend 80 percent of their time (2010). Library patrons, like other computer users, have a general aversion to scrolling down a page (Hintz et al., 2010, p. 45).
Tabs
relationship between the top row and those below (Gube, 2009) (Conradie, 2008, p. 7). Tabs should appear in a logical order (Mifsud, 2011) and group information “so users can easily predict what they'll find when they select a given tab” (Nielsen, 2007). Finally, tabs should function like file folder tabs in the real world – they should organize information within the page and never link to a new webpage (Nielsen, 2007) (Mifsud, 2011) (Pittsley and Memmott, 2012, p. 55).
Labeling
Labels within the guides must be carefully chosen and then standardized across guides, as users prefer short, jargon-free labels and descriptions (Hintz et al., 2010, p. 45) (Springshare, 2013). Experts recommend that labels consist of one to three words, and some even say two is the maximum (Mifsud, 2011) (Nielsen, 2007) (Springshare, 2013) (Gube, 2009) (Conradie, 2008, p. 8). Jakob Nielsen asserts that when reading on the web, users only see about the first two words of any list item, or maybe three if the words are very short, for a total of about eleven characters (Nielsen, 2009). LibGuides usability testing has confirmed this finding as students tend to miss the last words in long tab names, even if they contain key information about the content (Hungerford et al, 2010, p. 19.) Librarians should consider how easily a new student could understand their
Annotations
Students do not simply want to be pointed to resources – they want help learning how to use them (Sinkinson et al, 2012, p. 76). Students have consistently expressed a preference for annotations of resources – and even LibGuides in general – including why the resource is useful, authorship information, searching tips, and any limitations or restrictions (Gilmour, 2010, p. 357) (Jackson & Pellack, 2004, p. 322) (Courtois, Higgins, & Kapur, 2005, p. 195) (Little, 2010, p. 62) (Hungerford et al, 2010, p. 11-12). Hintz et al. explain that students “[do] not want to simply be pointed to a resource; they wanted to be told how best to make use of it” (2010, p. 46). However, these annotations need to be short, preferably not more than a sentence or two (Hintz et al., 2010, p. 46). Annotations are especially crucial when resource names are acronyms or otherwise do not make clear their scope and purpose (Hungerford et al, 2010, p. 9). Furthermore, usability testing has indicated that students prefer static resource annotations over the rollover or hover display options (Hungerford et al, 2010, p. 10).
Librarian Profile
Links
Guide authors must choose the appropriate level of link specificity. Some websites, such as those of government agencies, are so vast that a link to the homepage may not be helpful to students. Gilmour recommends that librarians “should provide some tips on how the visitor should proceed” or “better yet, link directly to pages of interest” (2010, p. 351). Links must also be current and active, which should be simple with the integrated “Link Checker” tool provided as part of the LibGuides platform. Studies have suggested checking links at least twice per semester (Courtois, Higgins, & Kapur, 2005, p. 195) (Jackson & Pellack, 2004, p. 324). The guides administrator must decide whether they, the individual authors, or student assistants will be responsible for checking links. This is an essential upkeep for the guides, as “links that go nowhere destroy the credibility of the library faculty” (Adebojono, 2010, p. 400).
Weeding
Weeding is an essential part of a LibGuides collection. Pages with little use should either be improved or removed (Jackson & Pellack, 2004, p. 326). The presence of outdated or irrelevant guides threatens the credibility of the entire collection with students. Guides cannot be created and forgotten; they must be constantly reviewed and updated to ensure not only that the information is still accurate, but also to regularly look for new authoritative material to add (Adebojono, 2010, p. 403) (Casey & Savastinuk, 2006, p. 42).
outdated information and to find new information. Furthermore, Springshare recommends unpublishing or deleting guides for courses not offered in the current semester and for past events. At one university, a list was kept to categorize guides as temporary or permanent, which simplifies the weeding process at the end of the semester (Gonzalez & Westbrock, 2010, p. 654).
Web 2.0 Features
“Web 2.0” options are a highly-promoted feature of the LibGuides platform, allowing an increasingly interactive and social experience for users. These features have largely been viewed as a positive by librarians (Hintz et al., 2010, p. 42). However, research has shown that students largely “appeared skeptical about rating systems, discussion forums, student recommendations, and they showed little interest in
personalization features” and even “found these features confusing” (Hintz et al., 2010, p. 46-47). One study found that students go to LibGuides seeking “authoritative
information from accepted experts” rather than to interact with peers and generate knowledge socially (Hintz et al., 2010, p. 47).
Other Factors Influencing Use Besides Design
Course Guides vs. Subject Guides
The literature overwhelmingly suggests that students are more inclined to use course-specific guides over subject guides, and that course guides more specifically meet student needs (Kerico & Hudson, 2008, p. 40) (Ouellette, 2011, p. 436, 438-439)
409) (Gonzalez & Westbrock, 2010, p. 649) (Strutin, 2008, para. 8) (Staley, 2007, p. 132). Course guides are more useful to today’s students, who approach library research in terms of coursework rather than disciplines, and usability studies have found that they have difficulty matching their information needs with a disciplinary subject guide (Reeb & Gibbons, 2004, p. 124-128). Furthermore, subjects are becoming increasingly
interdisciplinary, and the “blending of disciplines is not usually reflected in the
categorization of subject guides, only adding to students’ confusion about how to address their information needs within the context of discipline-based subject guides” (Reeb & Gibbons, 2004, p. 125) (Strutin, 2008, para. 9).
These guides customized to the level of specific courses, assignments, or
instruction sessions match the “world of customization and personalization” that college students have grown accustomed to and meet them at the point of need (Reeb & Gibbons, 2004, p. 125) (Ouellette, 2011, p. 448) (Strutin, 2008, para. 16). Furthermore, students view these guides as “current and relevant” and then have the opportunity to hone their
skills using the most appropriate and relevant resources for their current coursework, rather than muddling through the huge collection of available material on a given subject (Gonzalez & Westbrock, 2010, p. 649).
Access Point
Studies have shown that a major factor influencing use and usability of LibGuides is their access point from the library homepage (Jackson & Pellack, 2004, p. 321)
(Jackson & Pellack, 2004, p. 326). One study recommends that for quicker navigation, there should be a dropdown menu on the main page with subdivisions for subject guides and course guides (Strutin, 2008, para. 11). Furthermore, previous studies have
recommended having multiple access points to the research guides, from several strategic locations where students most frequently look for information (Lindsay, Cummings, Johnson, & Scales, 2006, p. 444). In addition to the homepage, these include the databases page (Adebojono, 2010, p. 399) (Courtois, Higgins, & Kapur, 2005, p. 190) (Reeb & Gibbons, 2004, p. 127) and the electronic course reserves page (Reeb & Gibbons, 2004, p. 128).
Marketing
Whether or not guides are marketed also plays a role in the use they receive. This marketing can be approached in a variety of ways.
In Instruction and Reference Sessions
One effective way to market the library’s guides collection is to use and
recommend them in instruction sessions and one-on-one reference interactions (Ouellette, 2011, p. 447). One study found after reviewing their statistics that “in-person instruction at our institution is the direct cause of most visits to guides” (Foster, Wilson,
Allensworth, & Sands, 2010, p. 613). Furthermore, when a guide is customized to the course level and introduced during an instruction session, “students are introduced to the guides in context, and the guides are seen as relevant and helpful” (Gonzalez &
Westbrock, 2010, p. 652). Students also become familiar and comfortable with the guides as a portal to the library’s resources, with some students “expecting to see a
instruction” when they open the library’s website (Foster, Wilson, Allensworth, & Sands, 2010, p. 613).
With Faculty
Another highly effective marketing opportunity is to promote the guides with faculty, who are in a unique position of influence with students. If faculty recommend that their students use a resource, it is likely the students will do so (Ouellette, 2011, p. 443). Also, outreach to faculty members opens the door to a new network, as instructors who have positive experience with library subject or course guides are likely to
recommend these resources to other faculty in their departments and across campus and to request additional guides for other courses they teach (Adebojono, 2010, p. 411) (Gonzalez & Westbrock, 2010, p. 649). Direct marketing emails to department faculty are one way of promotion (Foster, Wilson, Allensworth, & Sands, 2010, p. 608, 610). Course guides provide a unique marketing opportunity, as they are immediately relevant to students, faculty can become involved in their creation, and they reinforce librarians’ value in the research process and status as research partners (Gonzalez & Westbrock, 2010, p. 649) (Kerico & Hudson, 2008, p. 40).
In the Library
Finally, the guides should also be marketed within the library, including on the library website and around the physical building with posters and fliers. Lack of
posts. The greatest success they found was with direct emails to faculty members
(Foster, Wilson, Allensworth, & Sands, 2010). Another marketing technique of note is to promote the time-saving benefit of helping users efficiently select the best resources without the trial-and-error approach (Lindsay, Cummings, Johnson, & Scales, 2006, p. 444).
Methodology
To determine the impact of design on the use a guide receives, a linear regression will be conducted. Nine design variables have been determined, based on the literature review and available data for KSU’s LibGuides. Two other variables will also be included: First, the number of students enrolled in the departments or classes a guide is associated with should be taken into account, as some guides may be heavily used by a small department or lightly used by a large department. Second, whether or not a guide is used in instruction sessions is accounted for, as the literature suggests that guides
promoted in instruction receive more use.
Data gathering
I omitted eight guides from this study, because they were not actually created in the LibGuides platform. Clicking the link for the guide automatically redirects to KSU’s institutional repository, DigitalCommons@Kennesaw State University, where these materials are stored. As this is a study of design within the LibGuides platform, these materials are irrelevant.
Regression model
In this study, I will conduct a linear multiple regression to determine the impact of several design factors on the use an individual LibGuide receives. The models differ slightly between Subject and Course Guides and Library Guides. For Subject and Course Guides, I will control for the number of students in the program or class. This is not necessary for Library Guides, as the audience can be assumed to be the total student population. For Library Guides, I will control for whether or not the guide is used in instruction sessions. This is not necessary for the other categories, as no Subject Guides are used in instruction, and all Course Guides are. The regression models are as follows:
Subject Guides and Course Guides:
USEi = β0 + β1STUDENTSi + β2ONEROWi + β3PAGESi + β4JARGONi + β5WORDSi + β6LINKSi + β7PROFILEi + β8ORGi + β9LABELSi + β10ANNOTATEi + β11ϵi
Library Guides:
USEi = β0 + β1INSTRi + β2ONEROWi + β3PAGESi + β4JARGONi + β5WORDSi + β6LINKSi + β7PROFILEi + β8ORGi + β9LABELSi + β10ANNOTATEi + β11ϵi Where, for the ith guide:
STUDENTSi = the number of students enrolled in the programs or class with which a guide is associated
INSTRi = a binary variable indicating whether a guide is used in instruction sessions (as determined by KSU’s Assistant Director for Library
Instructional Services)
ONEROWi = a binary variable indicating whether all of the main navigation tabs fit on one row (not including drop-downs)
PAGESi = the total number of pages (tabs) on a guide (proxy for clutter) JARGONi = the Flesch-Kincaid Reading Ease score for the homepage
(well-known readability score, measured by an online tool, proxy for jargon) WORDSi = the word count for the homepage (measured by an online tool, proxy
for clutter)
LINKSi = the link count for the homepage (measured by an online tool, proxy for clutter)
PROFILEi = a binary variable indicating whether a librarian profile box with a recognizable photo is included on the homepage
ORGi = a binary variable indicating whether a guide is organized consistently by subject or format
LABELSi = a binary variable indicating whether main tab labels are all 1-2 words ANNOTATEi = a binary variable indicating whether annotations are provided for
key resources
Expected Coefficient Signs
I expect STUDENTS to have a positive coefficient, as more students in a
discipline should result in more guide hits. INSTR should have a positive coefficient, as the literature indicates guides promoted in instruction receive greater use. ONEROW should be positive, as this is a common design recommendation. PAGES is being used here as a proxy for clutter (i.e. too many tabs), so I expect a negative coefficient.
JARGON is measured here by the Flesch-Kincaid Reading Ease score. The score ranges from 0 to 100, with 0 being difficult to read and 100 being easy. Therefore, the higher the score, the more use should be expected. Therefore JARGON should have a positive coefficient. The coefficient for WORDS is ambiguous. It is being used here as a proxy for clutter, and thus should have a negative coefficient. However, a page could have a high word count and be filled with well-organized, useful information. On the whole, though, I will associate more words with a busier interface that necessitates scrolling and could overwhelm the user. LINKS is a proxy for clutter as well, and therefore is
predicted to have a negative coefficient. The remaining four binary variables –
PROFILE, ORG, LABELS, and ANNOTATE – are design recommendations that should positively impact use, and therefore a positive coefficient is expected.
My null hypothesis for STUDENTS, INSTR, ONEROW, JARGON, PROFILE, ORG, LABELS, and ANNOTATE is that the coefficient is less than or equal to zero:
H0: β1 < 0 HA: β1 > 0
H0: β1 > 0 HA: β1 < 0
Other Important Statistics
I will look for whether any of these variables have a statistically significant relationship with USE at the 5% level, determined by a p-value of less than .05. I will also be interested in the Adjusted R2 for the model as a whole, which will tell how well the independent variables together explain the variation in USE. This will give some idea as to how complete the model is. The overall F-statistic will give the significance of the model as a whole. If |F|< .05, then the model is considered significant.
Limitations of this study
There are several limitations with the model and the variables. First, it is difficult to determine what USE is actually measuring. I am considering more hits to indicate that someone arrived at a guide, found it useful, and continued using it or returned later. However, hits on a guide could simply be many people visiting the homepage of the guide, finding nothing useful, and leaving for another website. It could also be one frustrated user who is having difficulty finding helpful material on the guide but is
found that “the average number of visits per day…represents, in part, user satisfaction and, therefore, the quality of web sites perceived by users” (Yeh et al., 2008, p. 586).
Another limitation is that the data was collected after the end of the time period being analyzed. Therefore, the usage statistics reflect the two years being studied, but the design measurements are current. A librarian could have easily have improved the guide’s design during that time or even after.
Perhaps the main limitation of this study is the small sample size. With only 62 observations total, and even fewer when the guides are split into the 3 categories, it is difficult to gain statistical significance. Other complications also arise, such as unreliable coefficients. Furthermore, some of the design variables do not apply to every guide in a category (for example, a guide with no tabs cannot be evaluated for having short tab labels). These guides must be omitted from certain regressions, further reducing the already small sample size. This is further complicated by the fact that the regression models have ten independent variables, which is rather large especially given the sample size.
proxies, word count (WORDS) and link count (LINKS) have been suggested as important measures by past studies correlating web page design with use (Ivory et al., 2001, p. 4) (Yeh et al., 2008, p. 589-590), although the impact of these variables on use has not been clearly determined. Yeh et al. describe this complexity regarding word count: “The total word count on a web page may represent or contribute to the richness of the information on the page. However, too many words result in a cognitive burden on users” (2008, p. 590).
Data Summary and Analysis
Subject Guides
The results of the Subject Guides regression including all variables, in Table 1, reveal a few interesting points. Several variables have the expected coefficient signs. ONEROW, JARGON, and PROFILE are all positive, and PAGES and WORDS are both negative. I can reject the H0 for these variables.
The only statistically significant variable is LINKS, although ORG is very close. The Adjusted R2 for the overall model is 0.0993, meaning that almost ten percent of the variation in USE can be explained by the independent variables in the model.
Table 1
The regression was also run with USE, STUDENTS, and each of the nine design variables independently. The results, however, did not provide significant additional explanation and are thus included in Appendix A.
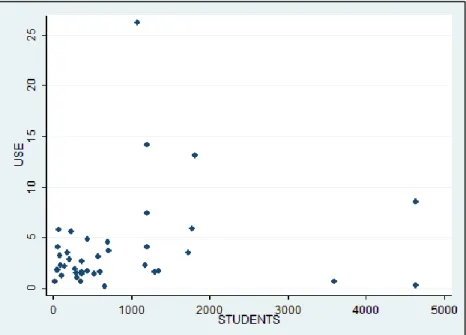
It is interesting to note that the correlation between the number of students
enrolled in a discipline and the use the corresponding guides receive is quite low, as seen in Table 2. Correlations can range from -1 (perfect negative correlation) to 1 (perfect positive correlation), with 0 meaning no correlation at all. Therefore, .16 is not a very significant observation and is lower than expected.
Table 2
Subject Guides Corrleation between USE and STUDENTS
Figure 1. Subject Guides Correlation between USE and STUDENTS
Course Guides
The results of the Course Guides regressions are not as informative, due to an extremely small sample size. The regression of USE with all of the independent
variables is not useful, because Stata omits several of the binary variables as having high multicollinearity. Logically, none of the variables should be highly correlated with one another. This is likely the result of chance with such a small sample for the Course Guides (only six). This prevents us from calculating the Adjusted R2 to determine the predicting power of the model overall.
The regression was then run with USE, STUDENTS, and each of the design variables independently to determine the effect of each design variable on use. The variables that had the expected coefficients include STUDENTS, ORG, and
There are no statistically significant variables. Most of the models have a negative Adjusted R2, which is a common occurrence with a small sample size, and actually means that variables are included which have no predictive power over the dependent variable. Two variables, however, have a fairly high Adjusted R2: PROFILE (0.3534) and ORG (0.1217). It seems most likely that this, too, is the result of chance from the small sample, especially given the insignificant results for all other variables. The regression results for the Course Guides can be found in Appendix B.
Finally, it is interesting to note that the correlation between USE and STUDENTS is slightly higher for the Course Pages – around 21 percent, as seen in Table 3. This is still in the range with the observation from the Subject Guides and still a relatively low correlation overall, though.
Table 3
Course Guides Correlation between USE and STUDENTS
Library Guides
The results of the regression for the Library Guides involving all of the
logically correlated with one another. This again prevents us from obtaining the Adjusted R2 for the model as a whole.
The regression was then run with USE, INSTR, and each of the design variables independently to determine the effect of each design variable on use. The variables that had the expected coefficients include ONEROW, ORG, LABELS, and ANNOTATE (all positive) and WORDS (negative). I can reject the H0 for these variables. INSTR
alternates between a positive and negative sign in the individual regressions, so its sign is inconclusive without the overall regression.
There are no statistically significant variables. Similar to the Course Guides, most of the models have a negative Adjusted R2. Two variables have interesting Adjusted R2 values, compared with the other variables. PROFILE is again much higher than its peers (0.0819) and fairly strong for one variable. ANNOTATE, however, stands out with the highest Adjusted R2 by far, 0.2096. Again it seems most likely that these high values can be attributed to the effects of a small sample size.
Finally, it is interesting to note that the correlation between USE and INSTR (see Table 4) is quite low, only around five percent. This is surprising, given that the
Table 4
Discussion
The regression results indicate that several of the design variables have the predicted outcome on the use a guide receives, indicating that adherence to design standards does increase guide usage. The only variable with the expected sign for all 3 groups is WORDS. This indicates that more words generally leads to less use, as patrons most likely become overwhelmed by trying to locate relevant information amid large amounts of text. Variables with the expected signs for two groups include ONEROW, ORG, ANNOTATE, and PAGES. In other words, having all tabs fit on a single row, consistently organizing pages in a guide by either subject or format, and providing annotations for key resources all positively impact guide usage. Having more pages on a guide generally decreases use, as patrons may be overwhelmed by the amount of
information presented. These five characteristics may be design variables to focus on as a priority.
with faculty, within the library, and in instruction classes would likely significantly increase guide usage.
Specific Design Recommendations
Based on the literature review, there are some clear, concrete standards that are a good foundation for any library starting to implement a set of institutional LibGuides design standards. This list is by no means comprehensive, but it includes some
fundamental design issues that are also fairly straightforward to implement. In addition to the standards below, guide authors should keep in mind some less measurable but highly important factors to users, such as keeping the webpage clean, clutter-free, and easy to navigate. Remember, students often judge the authority and reliability of the content – and whether they will pursue using it – based on its presentation. The goal is to create a set of resources with a standard appearance and format, so that students will become comfortable with the interface and know where to find the resources they need.
1. All tabs should fit on one row, so that they function like real-world file folder
tabs. If there is too much content to achieve this, consider breaking the material up into more narrowly-focused guides.
2. Keep tab labels short. They should be one to two words that clearly reflect the
content in that page.
3. Avoid library jargon. The language on your guide should be easily understood
by a first-time user of the library.
4. Include a librarian profile with contact information. This should at least
recognizable photo, as it makes them feel more comfortable asking the librarian for help.
5. Keep the tab organization consistent. Material should be organized either by
subject or format, but not a mixture. If there are tabs within a History guide for both “Colonial History” and “Articles,” students will not know where to look for an article on colonial history. Furthermore, students prefer organization by
subject, as this is how they approach their coursework.
6. Put the most important information up front. Students are used to the most
relevant results displaying at the top of the page. Students primarily use LibGuides to access the key databases for their subject. Consider a “key
resources” section featured prominently on the homepage or as a tab on the guide.
7. Provide alternative navigation to the tabs. Many users do not immediately
recognize the tab navigation. Include a box on the homepage that functions as a table of contents and links to each of the pages in the guide while providing a brief description of the contents of each page.
8. Tabs should never redirect to a new webpage. Tabs are a metaphor for real
world file folders; therefore, they should organize material within the page only.
9. Provide annotations for resources. Students do not only want to be told that
resources exist – they want to know what information they provide, how and when they might use them, and their strengths and weaknesses.
10. Font and formatting should be professional in appearance. A professional
within boxes. Colors, bold, and italics should be used sparingly. Underlining is limited to hyperlinks.
11. Link to specific pages when appropriate. For large websites, such as
government agencies, a link to specific pages of interest will better serve users than a link to the agency’s homepage.
12. Keep your guides collection current. Just like a print collection, guides must be
reviewed to add new material and weeded to remove what is outdated. Ideally this should be done on a regular schedule. This applies to both material within guides and to whole guides themselves. For example, course guides for classes not currently being taught should be unpublished.
13. Avoid Web 2.0 features. Students have largely responded negatively to features
such as ratings, student recommendations, and discussion forums. They use these guides to receive research guidance from people they view as experts, not from their peers. Students do not view guides as a social destination.
Further Research
Even within the LibGuides statistics provided, a closer analysis could be performed. For example it would be interesting to measure the proportion of hits on secondary pages rather than average hits per page, to capture users coming to a guide and staying to look around, as suggested by Pittsley and Memmott (2012, p. 53). It may also be useful to analyze which links are accessed most frequently within guides, to help librarians prioritize and organize the resources.
There are also other quantitative measures of design, such as font count, color count, graphics count, and body versus header text that are used more traditionally in the web design field and would require specialized tools to measure. However, these
variables may provide insight on the importance of the professional, standard font
recommended by Springshare or may provide a recommended ratio of words to images to maximize usage. It would also be insightful to do a more focused quantitative study on the impact of some of the other variables discussed on use, for example the impact of marketing or the impact of the access points for the guides.
This study has assessed use of KSU’s LibGuides. To assess usability or usefulness, a survey or user study is in order. As recommended by Ouellette (2011, p. 436), “librarians should consult with students and faculty to assess their needs and wants to create guides that are more useful, and more used” (Ouellette, 2011, p. 436).
Conclusion
Good design is difficult to quantify. It often falls under the category of “you know it when you see it.” This study has demonstrated some positive correlation between quantifiable measures of design and the use a research guide receives. The results also indicate that there are many other factors than design contributing to guide use. Whether or not they are backed by statistical evidence, design standards still hold a great deal of value as they are solidly backed by the literature and by usability studies.
Implementing the design standards recommended here, which were compiled from previous library science and web design studies, should have a positive impact on the use of LibGuides at Kennesaw State University. This will help librarians there meet the requests of their users for better online resources to help them find information on their own.
References
Anello, K., & Bonfield, B. (2007). Providing reference service in our sleep: Using a FAQ database to guide users to the right sources. Reference & User Services Quarterly, 46 (3), 28-33.
Association of Research Libraries. (2011). LibQUAL+® 2011 survey results – Horace W. Sturgis Library, Kennesaw State University. Retrieved from
http://kennesaw.edu/library/surveyresults/surveyfull.pdf
Adebojono, L.G. (2010). LibGuides: Customizing subject guides for individual courses.
College & Undergraduate Libraries, 17 (4), 398-412.
Casey, M.E. & Savastinuk, L.C. (2006). Library 2.0: Service for the next-generation library. Library Journal, 131 (14), 40-42.
Center for Plain Language. (2013). Plain language checklist. Retrieved from http://centerforplainlanguage.org/about-plain-language/checklist/
Child, D. (2013). Readability-Score.com. Retrieved from http://www.readability-score.com/
Conradie, P. (2008, January 21). Introduction to good usability: An e-book by peterpixel. Retrieved from http://www.peterpixel.nl/writings/introduction-to-good-usability/ Courtois, M.P., Higgins, M.E., & Kapur, A. (2005). Was this guide helpful? User’s
Fadeyev, D. (2009, September 24). 10 Useful usability findings and guidelines. Retrieved from http://uxdesign.smashingmagazine.com/2009/09/24/10-useful-usability-findings-and-guidelines/
Foster, M., Wilson, H., Allensworth, N., & Sands, D.T. (2010). Marketing research guides: An online experiment with LibGuides. Journal of Library Administration, 50 (5-6), 602-616.
Freeman, C.A. (2004). The relationship of undergraduate students’ self-assessment of library skills to their opinion of library instruction: A self-reporting survey.
Southeastern Librarian, 52 (3), 39-46.
Ghaphery, J. & White, E. (2012). Library use of web-based research guides. Information Technology and Libraries, 31 (1), 21-31.
Gilmour, R. (2010). Old wine in new skins: Thoughts on academic library Web guides.
College & Research Libraries News, 71 (7), 350-373.
Gonzalez, A.C. & Westbrock, T. (2010). Reaching out with LibGuides: Establishing a working set of best practices. Journal of Library Administration, 50 (5-6), 638-656.
Gube, J. (2009, June 24). Module tabs in web design: Best practices and solutions. Retrieved from http://www.smashingmagazine.com/2009/06/24/module-tabs-in-web-design-best-practices-and-solutions/
Hintz, K., Farrar, P., Eshghi, S., Sobol, B., Naslund, J., Lee, T., Stephens, T., &
McCauley, A. (2010). Letting students take the lead: A user-centered approach to evaluating subject guides. Evidence Based Library and Information Practice, 5
Hungerford, R., Ray, L., & Tawatao, J. W. (2010). LibGuides Usability Testing: Customizing a Product to Work for Your Users. University of Washington
Libraries Research Works Archive. Retrieved from
https://digital.lib.washington.edu/dspace/handle/1773/17101
Ivory, M. Y., Sinha, R. R., & Hearst, M. A. (2001). Empirically Validated Web Page Design Metrics. CHI ’01: Proceedings of the SIGCHI conference on human
factors in computing systems, 53-60. New York, NY: ACM. Retrieved from
http://webtango.berkeley.edu/papers/chi2001/chi2001.pdf
Jackson, R. & Pellack, L.J. (2004). Internet subject guides in academic libraries: An analysis of contents, practices, and opinions. Reference & User Services Quarterly, 43 (4), 319-327.
Judd, C. & Montgomery, N.M. (2009). LibGuides and librarians: Connecting content and community. Kentucky Libraries, 73 (3), 14-17.
Kerico, J., & Hudson, D. (2008). Using LibGuides for outreach to the disciplines. Indiana Libraries, 27 (2), 40-42.
Lindsay, E.B., Cummings, L., Johnson, C.M., & Scales, B.J. (2006). If you build it, will they learn? Assessing online information literacy tutorials. College & Research Libraries, 67 (5), 429-445.
Little, J. J. (2010). Cognitive load theory and library research guides. Internet Reference Services Quarterly, 15 (1), 53-63.
Mifsud, J. (2011, October 17). 14 Guidelines for web site tabs usability. Retrieved from http://usabilitygeek.com/14-guidelines-for-web-site-tabs-usability/
Nielsen, J. (2009, April 6). First 2 words: A signal for the scanning eye. Jakob Nielsen’s
Alertbox. Retrieved from
http://www.nngroup.com/articles/first-2-words-a-signal-for-scanning/
Nielsen, J. (2007, September 17). Tabs, used right. Jakob Nielsen’s Alertbox. Retrieved from http://www.nngroup.com/articles/tabs-used-right/
Nielsen, J. (2006, April 17). F-shaped pattern for reading web content. Jakob Nielsen’s
Alertbox. Retrieved from
http://www.nngroup.com/articles/f-shaped-pattern-reading-web-content/
Ouellette, D. (2011). Subject guides in academic libraries: A user-centered study of uses and perceptions. The Canadian Journal of Information and Library Science, 35
(4), 436-451.
Pittsley, K. A. & Memmott, S. (2012). Improving independent student navigation of complex educational web sites: An analysis of two navigation design changes in LibGuides. Information Technology and Libraries, 31 (3), 52-64.
Reeb, B. & Gibbons, S. (2004). Students, librarians, and subject guides: Improving a poor rate of return. Libraries and the Academy, 1 (4), 123-130.
Sinkinson, C., Alexander, S., Hicks, A., & Kahn, M. (2012). Guiding design: Exposing librarian and student mental models of research guides. Libraries and the Academy, 12 (1), 63-84.
Springshare. (2013). Best practices for building guides. Retrieved from http://help.springshare.com/guidebestpractices
Staley, S.M. (2007). Academic subject guides: A case study of use at San José State University. College & Research Libraries, 68 (2), 119-140.
Strutin, M. (2008). Making research guides more useful and more well used. Issues in Science and Technology Librarianship, (no. 55). Retrieved from
http://www.istl.org/08-fall/article5.html
Studenmund, A. H. (2006). Using econometrics: A practical guide (5th ed.). Boston, MA: Pearson Education, Inc.
Submit Express. (2013). Link counter tool. Retrieved from http://linkcounter.submitexpress.com/
Tarquini, M. (2007, July 24). Blasting the myth of the fold. Retrieved from http://boxesandarrows.com/blasting-the-myth-of-the-fold/
Yeh, D., Tsai, R., Sun, P. C., & Lee, J. W. (2008). Linear regression models for assessing the ranking of web sites based on average number of visits. Journal of
Appendix A: Subject Guides Regression Results
Table A1
Regression Output for ONEROW
Table A2
Regression Output for PAGES
Table A3
Table A4
Regression Output for WORDS
Table A5
Regression Output for LINKS
Table A6
Table A7
Regression Output for ORG
Table A8
Regression Output for LABELS
Table A9
Appendix B: Course Guides Regression Results
Table B1
Regression Output for All Variables
Table B2
Table B3
Regression Output for PAGES
Table B4
Regression Output for JARGON
Table B5
Table B6
Regression Output for LINKS
Table B7
Regression Output for PROFILE
Table B8
Table B9
Regression Output for LABELS
Table B10
Appendix C: Library Guides Regression Results
Table C1
Regression Output for All Variables
Table C2
Table C3
Regression Output for PAGES
Table C4
Regression Output for JARGON
Table C5
Table C6
Regression Output for LINKS
Table C7
Regression Output for PROFILE
Table C8
Table C9
Regression Output for LABELS
Table C10