Original article
Simultaneous estimation of degree of crystallinity in combination
drug product of abacavir, lamivudine and neverapine using X-ray
powder diffraction technique
Pavan Kommavarapu
*, Arthanareeswari Maruthapillai, Ravikiran Allada,
Kamaraj Palanisamy, Praveen Chappa
Department of Chemistry, SRM University, Kattankulathur 603203, Tamil Nadu, India
a r t i c l e i n f o
Article history: Received 19 August 2013 Accepted 18 October 2013 Available online 14 November 2013
Keywords: Crystallinity Drug product
X-ray powder diffraction Regressions statistics Analysis of variance
a b s t r a c t
Objective: In the present study, simultaneous determination of degree of crystallinity content in abacavir (ABC), lamivudine (3TC) and neverapine (NVP) from there combination drug product using X-ray powder diffraction (XRPD) technique is developed and validated.
Methods: The X-ray procedure for the identification and determination of the degree of crystallinity in ABC, 3TC and NVP drug product is developed and validated. It is based on the X-ray diffraction from crystalline region of the drug product. The characteristic peaks of the three drugs were characterized using XRPD.
Results: ABC, 3TC and NVP concentrations ranging from 70% to 130% in drug product were prepared and linearity in this concentration range is described. The % coefficient of variation (%CV) was found to be 0.9982 for ABC, 0.9978 for 3TC and 0.9984 for NVP. The mean recoveries were found to be 100.3% for ABC, 99.0% for 3TC and 100.8% for NVP. Regressions statistics and Analysis of variance (ANOVA) table results were evaluated and found to be satisfactory.
Conclusions: The method has been applied to unknown mixtures of drug formulations and stability samples. The proposed method can be useful in the quality control of combination drug products.
CopyrightÓ2013, InPharm Association, Published by Reed Elsevier India Pvt. Ltd. All rights reserved.
1. Introduction
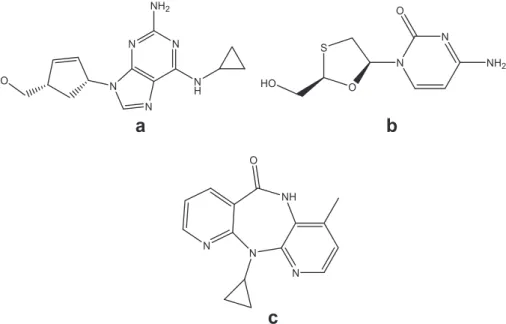
The managing of human immunodeficiency virus (HIV) includes the use of multiple antiretroviral, since single drug therapy becomes ineffective due to development of HIV resistant strains. According to treatment guidelines antiretroviral regimen should contain at least two nucleoside analogue reverse transcriptase inhibitors (NRTIs) and one non-nucleoside reverse transcriptase inhibitor (NNRTI) in afixed dose combination.1,2An example of such combination is ABC, 3TC and NVP, which is very efficient in the treatment of HIV. Abacavir (ABC) is a nucleoside reverse transcriptase inhibitor (NRTI) with activity against Human Immunodeficiency Virus Type 1 (HIV-1). ABC is phosphorylated to active metabolites that compete for incorporation into viral DNA. Intracellularly, ABC is converted by cellular enzymes to the active metabolite carbovir triphosphate, an analogue of deoxy-guanosine-50-triphosphate (dGTP). Chemically ABC is [(1S,
4R)-4-[2-amino-6-(cyclopropylamino)-9H-purin-9-yl] cyclopent-2-en-1-yl] methanol.3e5Lamivudine (3TC) is a nucleoside reverse transcriptase inhibitor (NRTI) with activity against Human Immunodeficiency Vi-rus Type 1 (HIV-1) and hepatitis B (HBV). 3TC is a synthetic nucleoside analogue and is phosphorylated intracellularly to its active 50 -triphosphate metabolite, lamivudine -triphosphate (L-TP). Chemically 3TC is 4-amino-1-[(2R, 5S)-2-(hydroxymethyl)-1, 3-oxathiolan-5-yl]-1, 2-dihydropyrimidin-2-one.6e8 Neverapine (NVP), is a non-nucleoside reverse transcriptase inhibitor (NNRTI) used to treat HIV-1 infection and AIDS. Neverapine falls in the non-nucleoside reverse transcriptase inhibitor (NNRTI) class of antiretrovirals.9 Chemically NVP is 11-cyclopropyl-4-methyl-5,11-dihydro-6H-dipyr-ido[3,2-b:20,30-e][1,4]diazepin-6-one.
The objective of the present study is to describe an X-ray diffraction quantitative method for the simultaneous estimation of degree of crystallinity of ABC, 3TC and NVP in a triple composition drug product. The X-ray diffraction pattern consists of information about peak positions and intensity, which are indicative of the crystal structure, composition and symmetry of the contributing phase. The peak intensities reflect the total scattering from the each
*Corresponding author. Tel.:þ91 8106791313.
E-mail address:[email protected](P. Kommavarapu).
Contents lists available atScienceDirect
Journal of Young Pharmacists
j o u r n a l h o me p a g e : w w w . e l s e v i e r . c o m / l o ca t e / j y p
plane in the phase’s crystal structure, and are directly dependent on the distribution of particular atoms in the structure. The diffraction intensity equation is summarized below:
IðhklÞa ¼
I0
l
364
p
re2 mec2
2M ðhklÞ
V2 a
FðhklÞa
2
1þcos2ð2
q
Þcos2ð2q
mÞsin2
q
cosq
hkl va
m
swhere,I(hkl)ais the Intensity of reflection of hkl in phase
a
,I0is the incident beam intensity,ris the distance from specimen to detector,l
is X-ray wavelength, (e2/mec2)2is the square of classical electron radius,m
s is linear absorption coefficient of the specimen,Va isvolume fraction of phase
a
,Mhklis multiplicity of reflection hkl of phasea
,y
a
is volume of the unit cell of phasea
, 2q
m is the diffraction angle of the monochromator andF(hkl)ais the structurefactor for reflection hkl of phase
a
(i.e., the vector sum of scattering intensities of all atoms contributing to that reflection).10Methods have been developed which use peak intensities for quantitative analysis of diffraction data. Some of the quantitative Methods based on Intensity Ratios of diffraction data are Absorption-Diffraction Method, Method of Standard Additions, Internal Standard Method, Reference Intensity Ratio Methods and Full-Pattern Analysis e the Rietveld Method.11,12 In the present study regression analysis is carried out to establish the equation that best describes the linear relationship between instrument response (y) and analyte level (x). The relationship is given by the equation of the line,y¼mxþcwheremis the gradient of the line andcis its intercept with they-axis. Linear regression establishes the values ofmandc, which best describes the relationship be-tween the data sets. The equations for calculatingmandcare given as follows:
m ¼
Pn
i¼1fðxixÞðyiyÞg Pn
i¼1ðxixÞ2
c ¼ ymx
The correlation coefficient (R) is a measure of the strength of the degree of correlation between theyandxvalues.Rcan take any value betweenþ1 and1; the closer it is to 1, the stronger the correlation.Ris given by the following equation.
R ¼
Pn
i¼1fðxixÞðyiyÞg nhPn
i¼1ðxixÞ2ihhPni¼1ðyiyÞ2 iio1=2
wherexiandyiare the value onx-axis andy-axis,xandyare the mean ofxiandyivalues andnis the number of calibration points. The parameters related toRareR2and adjustedR2.R2is often used to describe the fraction of the total variance in the data which is contributed by the line that has beenfitted. Ideally, if there is a good linear relation, the majority of variability can be accounted for by the fitted line. R2 value is close to 1. The adjusted R2 value is interpreted in the same way asR2but is always lower. It is useful for assessing the effect of adding additional terms to the equation of thefitted line (e.g., if a quadraticfit is used instead of a linearfit). TheR2value always increases on the addition of an extra term to the equation, but this does not mean that the extended equation is necessarily a betterfit of the data. The adjustedR2value is more useful in such cases as it takes account of the reduction in the de-grees of freedom, which occurs each time an additional term is added to the equation of the line and therefore does not auto-matically increase on addition of extra terms. Another important
parameter in regression analysis is Residual standard deviation (or standard error), which is a statistical measure of the deviation of the data from thefitted regression line. It is calculated using the following equation:
sðrÞ ¼
ffiffiffiffiffiffiffiffiffiffiffiffiffiffiffiffiffiffiffiffiffiffiffiffiffiffiffiffiffiffiffiffi Pn
i¼1ðyibyiÞ2 n2
s
whereyiis the observed value ofyfor a given value ofxi,^yiis the value ofypredicted by the equation of the calibration line for a given value ofxiandnis the number of calibration points. Analysis of variance (ANOVA) table for the regression is produced in regression analysis. In ANOVA table the sum of squares terms (SS) represent different sources of variability in the calibration data. The regression term represents the variability in the data that can be accounted for by thefitted regression line. The residual term is the sum of the squared residuals. Each mean square (MS) term is simply the sum of squares term divided by its degrees of freedom. The F value is the ratio of the regression MS term to the residual MS term. The significance F value represents the probability of obtaining the results in the ANOVA table if there is no correlation betweenyandxvalues, i.e., obtaining the results by chance. A small value indicates that the results were unlikely to have happened by chance, indicating that it is highly likely that there is a strong relationship between theyandxvalues. For a calibration curve to be of any use the significance F value should be extremely small. This value is also known as thep-value.13e17
To our knowledge, based on extensive review, no efforts have been made in published literature to determine the degree of crystallinity simultaneously in ABC, 3TC and NVP combination drug product, determination of regression statistics and evaluation of ANOVA table parameters.
2. Experimental
The three drugs ABC, 3TC and NVP were conformed using PXRD. The required concentrations ranging between 70% and 130% were prepared accurately using high Sensitive Microbalance (Mettler Toledo XP2U, Max 2.1 g-Min-1
m
g).2.1. PXRD analysis
Diffraction patterns were collected using Bruker D8 advance X-ray diffractometer with Cu anode and Lynx eye detector. ABC, 3TC and NVP were scanned from 32qto 452q, with step size 0.012qand time per step of 0.1 s for the identification purpose. After selecting the non-interfering peak, the patterns of spiked standards were collected from 122
q
to 212q
, with step size 0.012q
and time per step of 0.72 s. The instrument was operated at 40 kV generator voltage and 40 mA generator current. Variable divergent slit and Anti scattering slit were used of V20mm, Nickelfilter was used in secondary beam path. Eva software was used for data processing and evaluation.% Concentration of ABC, 3TC and NVP in Standard-1 is 69.9, 130.1 and 129.9; Standard-2 is 75.1, 125.3 and 125.2; Standard-3 is 80.1, 120.3 and 120.1; Standard-4 is 84.7, 114.9 and 115.2; Standard-5 is 90.1, 110.2 and 109.7; 6 is 95.3, 105.1 and 105.3; Standard-7 is 100.4, 100.1 and 100.2; Standard-8 is 110.1, 90.1 and 90.3; Standard-9 is 115.1, 85.2 and 85.1; Standard-10 is 120.2, 80.1 and 80.2 and Standard-11 is 129.8, 70.1 and 70.3.
2.2. Method validation
The proposed method was validated with respect to selectivity, linearity, precision and recovery.18
2.2.1. Selectivity
The selectivity of the method was determined to make sure that ABC, 3TC and NVP characteristics peaks were well separated and free from interference of Placebo in the drug product.
2.3. Linearity
Standard sample preparations with concentration range of 70%e130% were prepared by spiking ABC, 3TC and NVP in placebo. Standard calibration curve was constructed by plotting the peak
areas of ABC, 3TC and NVP against the corresponding
concentrations of standard samples. Linear regression equation and correlation coefficient were determined.
2.4. Precision
The precision of this analytical method is expressed as the relative standard deviation of a series of measurements. Spiked standard concentrations of ABC, 3TC and NVP at 95%, 105% and 110% concentration levels were prepared and scanned for three times.
2.5. Recovery
Three concentrations of ABC, 3TC and NVP in placebo i.e., 95%, 105% and 110% were prepared and three replicates of each con-centration are scanned.
3. Results and discussion
The three drugs ABC, 3TC and NVP were identified and charac-terised using PXRD and the overlay of the diffractogram of the drugs are represented inFig. 2. The characteristics peaks with their corresponding intensity % of the three drugs are represented in
NH
N N N
O HO
N N
N N
N H NH2
a
c
N
N O
O S
HO
NH2
b
Fig. 1.Chemical structure of Abacavir (a), Lamivudine (b) and Neverapine (c).
Table 1
Weights of ABC, 3TC, NVP & Placebo taken for the preparation of standard blend mixtures.
Standard blend mixtures
ABC (mg)
3TC (mg)
NVP (mg)
Placebo (mg)
Total weight of the blend (mg)
Standard-1 61.51 49.44 81.84 307.29 500.08 Standard-2 66.09 47.61 78.88 307.52 500.10 Standard-3 70.49 45.71 75.66 308.19 500.06 Standard-4 74.54 43.66 72.58 308.50 499.27 Standard-5 79.29 41.88 69.11 309.90 500.18 Standard-6 83.86 39.94 66.34 310.22 500.36 Standard-7 88.35 38.04 63.13 310.42 499.94 Standard-8 96.89 34.24 56.89 311.85 499.87 Standard-9 101.29 32.38 53.61 311.98 499.26 Standard-10 105.78 30.44 50.53 312.54 499.28 Standard-11 114.22 26.64 44.29 313.94 499.09
Table 2. Form this information we can select non-interfering peaks of ABC, 3TC and NVP which are used in the creation of calibration curves.
The standard calibration curves (Fig. 3.) were constructed by plotting spiked standard preparations against Net area (counts per seconds (Cps)2
q
). Overlaid diffractograms of different spiked standard preparations are represented inFig. 4. The standard cali-bration curve for ABC, 3TC and NVP was linear over a concentration range of 70%e130%. The correlation coefficient (R2) was 0.9982 for ABC, 0.9978 for 3TC and 0.9984 for NVP, which are well within acceptable limit.18Linear regression equations of ABC, 3TC and NVP were found to be y ¼ 0.0578x e 0.1, y ¼ 0.219x e 14.511 andy¼0.0832xe4.9302 respectively.
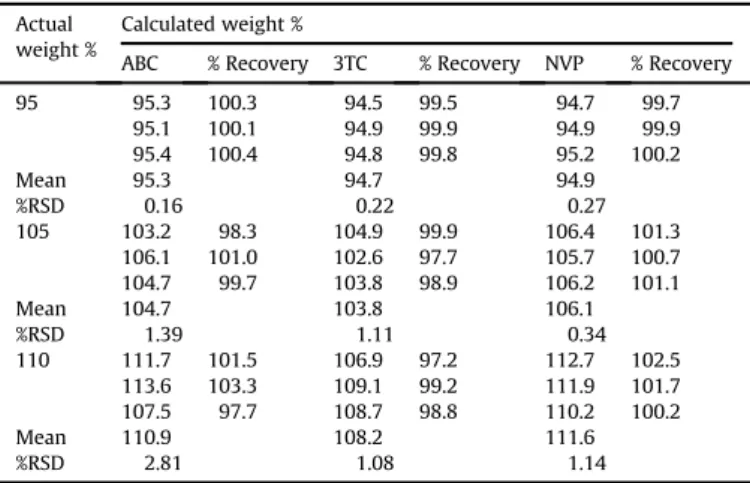
Three standard preparations at 95%, 105% and 110% level were prepared and measurements are collected for three replicates and
corresponding peaks of ABC, 3TC and NVP were integrated for the evaluation of precision, recovery, accuracy and reproducibility (Table 3). The mean recovery values of 100.3% for ABC, 99.0% for 3TC and 100.8% for NVP were obtained. Average recovery for each drug was above 99%. The low %RSD value obtained by the triplicate measurement of each of the concentration of ABC, 3TC and NVP indicates that the method is precise and reproducible.
Regression statistics are evaluated for prepared spiked standard concentrations versus Net area obtained. Parameters like multiple R,R2, AdjustedR2and Standard error are assessed. The correlation coefficientR(MultipleR),R2and AdjustedR2values for ABC, 3TC and NVP are tabulated inTable 4.
The correlation coefficient (R) for ABC, 3TC and NVP is 0.999083539, 0.998905611and 0.99918471 respectively indicating the stronger relationship.R2and adjustedR2are the parameters related toRand they provide us the information about fraction of the total variance in data added by thefitted line. AdjustedR2value is always lower thanR2value.
Table 2
Characteristics peaks of ABC, 3TC and NVP.
Abacavir Lamivudine Neverapine
Angle (2q) Intensity % Angle (2q) Intensity % Angle (2q) Intensity %
8.736 5.0 10.666 2.2 9.285 50.3
9.37 81.9 12.143 4.4 10.295 2.7
12.138 34.2 13.396 8.6 12.662 15.6
12.385 19.6 14.279 5.4 13.096 75.6
17.253 21.9 14.731 4.8 13.495 53.2
17.628 80.1 15.836 4.4 15.439 23.3
17.884 80.4 16.816 5.4 15.745 11.7
18.381 17.9 17.529 11.7 16.773 14.8
18.859 26.2 19.669 3.3 17.255 28.9
19.392 17.5 20.612 100.0 17.441 13.8
20.245 6.3 21.426 33.2 18.523 7.5
20.603 15.6 22.124 2.3 18.937 41.4
20.988 94.3 22.597 2.7 19.072 56.6
21.425 100.0 23.005 2.8 20.372 25.1
22.685 68.1 23.746 6.0 20.754 38.0
23.053 25.6 24.418 11.7 20.878 30.5
24.492 30.5 24.922 32.5 21.106 23.7
24.635 42.5 25.683 2.0 21.624 8.1
24.985 13.0 26.491 13.6 22.658 50.4
25.257 29.6 27.669 5.9 23.258 41.4
26.009 7.3 28.39 2.2 23.787 22.4
26.585 40.8 28.771 2.8 25.126 61.3
27.586 16.4 28.875 2.8 25.544 100.0
28.471 98.0 29.096 1.8 26.506 51.7
28.885 12.5 29.697 1.8 26.738 60.0
29.244 27.1 30.656 5.7 27.235 21.4
29.976 15.6 30.885 4.2 27.733 20.7
30.203 8.5 31.297 6.3 28.265 12.3
30.467 6.1 31.442 8.6 28.874 26.9
31.652 6.9 31.964 3.4 29.248 14.2
Fig. 3.The standard calibration curves for ABC, 3TC and NVP.
Fig. 4.Overlaid diffractrograms of Spiked standard preparations of ABC, 3TC and NVP.
Table 3
Precision, Accuracy and Reproducibility data.
Actual weight %
Calculated weight %
ABC % Recovery 3TC % Recovery NVP % Recovery
95 95.3 100.3 94.5 99.5 94.7 99.7
95.1 100.1 94.9 99.9 94.9 99.9 95.4 100.4 94.8 99.8 95.2 100.2
Mean 95.3 94.7 94.9
%RSD 0.16 0.22 0.27
105 103.2 98.3 104.9 99.9 106.4 101.3 106.1 101.0 102.6 97.7 105.7 100.7 104.7 99.7 103.8 98.9 106.2 101.1
Mean 104.7 103.8 106.1
%RSD 1.39 1.11 0.34
110 111.7 101.5 106.9 97.2 112.7 102.5 113.6 103.3 109.1 99.2 111.9 101.7 107.5 97.7 108.7 98.8 110.2 100.2
Mean 110.9 108.2 111.6
%RSD 2.81 1.08 1.14
Table 4
Regression statistics of ABC, 3TC and NVP.
Regression Statistics
ABC 3TC NVP
MultipleR 0.999083539 0.998905611 0.99918471 R2 0.998167918 0.997812419 0.998375602 AdjustedR2 0.997964354 0.997569355 0.998195114 Standard Error 0.051067604 0.211444399 0.068830267
Analysis of variance (ANOVA) table for the regression is con-structed and is represented inTable 5. The sum of squares terms (SS) and the regression term represents different sources of vari-ability in the calibration data that can be accounted by thefitted regression line. The SS values for ABC, 3TC and NVP are 12.78769363, 183.535355 and 26.20613828 respectively. Since these values are large we conclude that there is a good linear
relationship and thefitted line will describe majority of variability in response with concentration and this is also confirmed by the low residual values i.e., 0.023471102 for ABC, 0.402378604 for 3TC and 0.04263845 for NVP. The mean square term is the ratio of SS term to its degree of freedom (df) and the F value (which is the ratio of the regression MS term to the residual MS term) for ABC, 3TC and NVP are found to be 4903.444352, 4105.134271 and 5531.515396 Table 5
ANOVA table for the regression of ABV, 3TC and NVP.
df SS MS
ABC 3TC NVP ABC 3TC NVP
Regression 1 12.78769363 183.535355 26.20613828 12.78769363 183.535355 26.20613828
Residual 9 0.023471102 0.402378604 0.04263845 0.0026079 0.044708734 0.004737606
Total 10 12.81116473 183.9377336 26.24877673
F Significance F
ABC 3TC NVP ABC 3TC NVP
4903.444352 4105.134271 5531.515396 1.24841E-13 2.77336E-14 7.26413E-15
Coefficients Standard error
ABC 3TC NVP ABC 3TC NVP
Intercept 0.10002267 14.511249873 4.930170812 0.081841343 0.357311531 0.116918398 X variable 1 0.057820554 0.218989614 0.083193883 0.000825718 0.003417904 0.001118586
t-Stat p-value
ABC 3TC NVP ABC 3TC NVP
Intercept 1.22215334 40.61231897 42.16762188 0.252691399 1.656845E-12 1.1832827E-11 X variable 1 70.02459819 64.07132175 74.37415812 1.24841E-13 2.77336E-14 7.26413E-15
Lower 95% Upper 95%
ABC 3TC NVP ABC 3TC NVP
Intercept 0.28516065 15.31954471 5.194658604 0.085115309 13.70295504 4.665683021 X variable 1 0.055952651 0.211257779 0.080663466 0.059688457 0.22672145 0.08572430
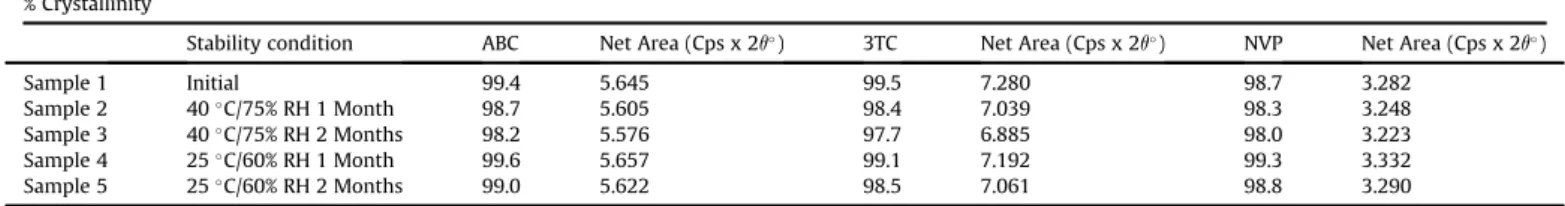
Table 6
% Crystallinity determination of unknown samples.
% Crystallinity
Stability condition ABC Net Area (Cps x 2q) 3TC Net Area (Cps x 2q) NVP Net Area (Cps x 2q)
Sample 1 Initial 99.4 5.645 99.5 7.280 98.7 3.282
Sample 2 40C/75% RH 1 Month 98.7 5.605 98.4 7.039 98.3 3.248
Sample 3 40C/75% RH 2 Months 98.2 5.576 97.7 6.885 98.0 3.223
Sample 4 25C/60% RH 1 Month 99.6 5.657 99.1 7.192 99.3 3.332
Sample 5 25C/60% RH 2 Months 99.0 5.622 98.5 7.061 98.8 3.290
respectively. The larger F values and the larger values of regression MS term compared to residual MS term indicate the good linear relationship. The significance F values (p-values) for ABC, 3TC and NVP are found to be 1.24841E-13, 2.77336E-14 and 7.26413E-15 respectively. The extreme small significance F values for ABC, 3TC and NVP indicate that the results were unlikely to have happened by chance representing the strong relationship between data values. The standard error for each coefficient of ABC, 3TC and NVP are found to be 0.000825718, 0.003417904 and 0.001118586 respectively. The lower and upper confidence limits for the gradient and intercept at confidence level 95% for ABC, 3TC and NVP are given inTable 5. These represent the extremes of the values that the gradient and intercept could take. Since thet-stat value is larger number andp-value greater than 0.05 for regression at 95% confi -dence level we can say that they are statistically significantly different from zero.
In order to assess the validity of the developed XRPD method it has been applied in the determination of crystalline content of drug formulation of unknown compositions initially and kept at different stability conditions. The results are evaluated from their respective calibration models. The results obtained are tabulated in Table 6. From the results obtained we conclude that the proposed method can be applied easily to analyse large number of samples to determine crystallinity content of drug product. Ideal residual plots are obtained for ABC, 3TC and NVP and are scattered randomly around zeroFig. 5.
4. Conclusion
Powder X-ray diffraction can be a viable method to monitor % crystallinity stability of the active pharmaceutical ingredient in tablet formulations. Here it is shown that XRD measurements of the drug formulations under study were able to detect crystallinity content truly. Regression statistics and ANOVA table results dem-onstrates the adequacy of the method.
Conflicts of interest
All authors have none to declare.
References
1. Peter KQ. HIV drug resistance and the advent of integrase inhibitors.Curr Infect Dis Rep. 2013;15:85e100.
2. Gallant JE. Initial therapy of HIV infection.J Clin Virol. 2002;25:317e333. 3. Clercq DE. New anti-HIV agents and targets.Med Res Rev. 2002;22:531e565. 4. Lewis RJ, Tsai FT, Wigley DB. Molecular mechanisms of drug inhibition of DNA
gyrase.Bioessays. 1996;18:661e671.
5. Yuen GJ, Weller S, Pakes GE. A review of the pharmacokinetics of abacavir.Clin Pharmacokinet. 2008;47:351e371.
6. Overington JP, Al-Lazikani B, Hopkins AL. How many drug targets are there? Nat Rev Drug Discov. 2006;5:993e996.
7. Imming P, Sinning C, Meyer A. Drugs, their targets and the nature and number of drug targets.Nat Rev Drug Discov. 2006;5:821e834.
8. Fox Z, Dragsted UB, Gerstoft J, et al. A randomized trial to evaluate continuation versus discontinuation of lamivudine in individuals failing a lamivudine-containing regimen: the COLATE trial.Antivir Ther. 2006;11:761e770. 9. Patel SS, Benfield P. New drug profile: nevirapine.Clin Immunotherapeutics.
1996;6:307e317.
10.James RC.Introduction to X-ray Powder Diffraction. 2012. EPS400e002. 11. Jenkins R, Snyder RL.Quantitative Analysis, in Introduction to X-ray Powder
Diffractometry. vol. 138. Hoboken, NJ, USA: John Wiley & Sons, Inc.; 1996. http://dx.doi.org/10.1002/9781118520994.ch13.
12.Bish DL, Howard SA. Quantitative phase analysis using the Rietveld method. J Appl Crystallography. 1988:86e91.
13.Ronald AF.Statistical Methods for Research Workers. 12 ed. Edinburgh: Oliver and Boyd; 1954. ISBN: 0-05-002170-2.
14.Draper NR, Smith H. Applied Regression Analysis. 3rd ed. John Wiley; 1998. ISBN: 0-471-17082-8.
15.Bedson P, Mike S. The development and application of guidance on equipment qualification of analytical instruments.Accred Qual Assur. 1996:265e274. 16.Miller JN, Miller JC.Statistics and Chemometrics for Analytical Chemistry. 4th ed.
2000. ISBN: 0-130-22888-5.
17.Barwick VJ.Preparation of Calibration Curves: A Guide to Best Practice. 2003. LGCVAM2003032.