Abstract—In the effort of getting a better understanding on urea release mechanism, a multi-diffusion model is used to simulate the diffusion of urea through coating layer and to environment. Based on the multi-diffusion model for "constant release" stage, the effect of particle size (R0) and coating thickness (l) on diffusive flux, release rate and release time are investigated by using Finite Element Method (FEM) and 2D-geometry. Results show that an increase in particle size or coating thickness also leads to an increase in release time. However, adjusting on particle size is more economical than coating thickness. In addition, there is no relationship between the product R0 × l with the diffusive flux or release rate. A linear relationship between the product R02 × l-1andrelease rate has been found instead.
Index Terms—Urea Release, urea diffusion, finite element method, multi-diffusion modeling.
I. INTRODUCTION
The aim of slow release or controlled release fertilizer (SRF/CRF) is to prevent nutrient loss and enhance nutrient utilization efficiency by plants [1]. Plant can only recover 30-50% of the nutrient in conventional fertilizer, while CRFs make least possible losses of the fertilizer through volatilization, leaching. Besides, CRFs help preventing the seedling damage and better protecting of the ecosystem in the case of biodegradable carriers [2].
Manuscript received August 5, 2013; revised November 6, 2013. This work was supported in part by the One BAJA LRGS Grant.
Fick‟s law. However, the first stage of release process was neglected, and “trial and error” method was used to estimate diffusion coefficient [9]. Modeling has proved that it is the fast and cost effective way of predicting release of nutrients from CRFs.
There are many factors influencing nutrient release from CRFs, such as coating material, coating thickness, particle size, shape, coating surface irregularity, etc. [10]. The rate of nutrient release from a polymer coated product can be controlled not only by varying the type and the thickness of the coating but also by changing the ratio of different coating materials [10], [11]. Understanding the effect of these factors is very important to the longevity target (release profile) for crop application and quantity of coating material used for coated CRFs. A finite element based model has been used to study the effect of particle size and coating thickness on "constant release" stage using COMSOL Multiphysics 4.3a software.
II. METHODOLOGY
This study consists of two parts. The first part describes how to simulate the release of urea by mean of Finite Element Method (FEM) and its validation process. The second part investigates the effect of coating thickness, saturated concentration and effective diffusivity during the "constant release" stage.
A. Model Development
Model used for studying the effect of particle size and coating thickness is based on multi-diffusion model from our previous study [12], [13]. Fig. 1 shows the dissolution model of urea particle in water. Urea particle consist of a solid urea core and a coating layer on the surface of this core. Water surrounds the urea particle, and penetrates through the coating layer. An assumption is made that urea particle is spherical in shape. Urea is quickly dissolved in water so that the solute‟s concentration at the sphere‟s surface is saturated. Because the coated urea particle is immersed in a large fluid volume, the concentration far from the sphere is zero [14].
When coating layer is saturated with water, urea begins to release by mean of diffusion through the coating layer. Based on mass transport equation in porous medium, a transition state for urea diffusion through the coating could
t C ε r C r r
C De
2
2 2
(1)
where C is the concentration of urea in mol/m3, De is effective diffusivity (diffusion coefficient) of urea in porous medium
Thanh H. Trinh, Ku Zilati Ku Shaari, Abdul Basit, and Babar Azeem
Effect of Particle Size and Coating Thickness on the
Release of Urea Using Multi-Diffusion Model
be written as below [9], [15]: Urea was selected as the material to be coated because of
its high nitrogen content, low cost, and commercial availability [3]. The first study on the application of controlled release technology to fertilizers was conducted in 1962 by Ortil et al. [4]. The release of coated CRF is usually controlled by the diffusion through the coating layer. Many modeling efforts were based on the assumption that the release of nutrients from coated fertilizer is controlled by simple solute diffusion [2], [5]-[8]. Based on Raban‟s experiments, the release from a single granule of a polymer coated CRFs consists of three stages: an initial stage during which no release is observed (lag period), a stage of constant release, and finally a phase of gradual decay of the release rate [4]. In 2007, Lu proposed a mathematical model for the release of a scoop of polymer coated urea, which took into account the effect of sample population. This model was based on mass balance equation of pseudo-steady state of
TABLE I: SIMULATION DATA
No. Coating Material
Urea Radius
(mm)
Coating Thickness
(mm)
Lag time t0
(days)
1 MPOa 1.2 0.0375 0.5
2 MPOa 1.2 0.0917 4
3 MPOa 1.2 0.1833 7
a.
Modified Polyolefin
Amount of urea released is defined as the integral of diffusive flux at the outer shell of urea particle.
m M A J dt
t t Urea diff
urea
released
0
where Murea is molar mass of urea, g/mol
Adiff is diffusion surface area, m2
JUrea is the diffusive flux of urea at outer shell of urea particle, mol/(m2s)
Total urea of the urea particle is calculated as
mtotalureaVcoredurea
where mtotal urea is total urea of the urea particle in g
Vcore is volume of urea core, m3
durea is urea density, g/m3
At time t, amount of urea inside urea core is
3 2
V urea urea total
core m M CdV
m (6)
where C is concentration of urea, mol/m3
V2+3 is volume of coating layer and water domain
“Constant release” stage is considered from the time of beginning of the release to the time when solid urea is totally dissolved. At that time, the amount of urea in the core is
core sat urea sat
core m M C V
m (7)
where
msat is urea mass of the urea core when solid urea is totally dissolved,
Csat is saturated urea concentration, mol/m3
This is defined as the stop condition for “constant release” stage. This model focuses only on the “constant release” stage, and the lag time (t0) is determined based on each experiments.
Validation process uses experiment data from Shaviv literature [4]. Data are extracted using Engauge Digitizer 4.1. Based on information from these papers and extracted data, simulation and experiment data are plotted to confirm our model results.
Validated model is then used to study the effect of particle sizes and coating thickness on the release of urea particle. In this model, diffusion coefficient of urea in liquid is defined as a function of urea concentration, and coupled in fluid field domain.
in m2/s, is porosity of the coating in percentage (%).
Water domain
(fluid zone)
Urea release flux
Urea particle
Fig. 1. Dissolution model of a spherical urea particle.
Since the urea pellet is motionless, it is assumed that urea flux from the interface of coating to the liquid is controlled by the diffusion of urea into the liquid, and calculated based on mass transport equation of urea in water. The equation for urea diffusion can be written as:
t C r C r D r
C
Durea urea
2
2 2
(2)
In this model, Durea is a function of urea concentration [14]:
2
510 × 00464 0 0782 0 380
1
. . C . C
Durea cm2/s
(3)
Three simulations are run following the input data summarized in Table I. These data are based on previous publication from Shaviv et al. [4]. Geometry and meshing steps are done for urea particles with radius and coating thickness as following
Table I and Fig. 2. Fluid zone which is defined as the distance from center of the urea particle to outer boundary of water domain is set to 22 times of the radius of urea core ( see Fig. 1), [12]. Initial values and boundary conditions are specified for the model. At the time t0, urea concentration at the surface of urea core is saturated, and concentration is zero at the outer layer of fluid field. In these simulations, calculation time depends on the amount of urea (size and shape) and coating material (thickness and properties).
z
r
B. Effect of Particle Size (R0) on the Release of Urea Based on the model set up for urea diffusion model, simulations are done for five particle sizes such as 2.0, 2.5, 3.0, 3.5, and 4.0 mm with the same coating thickness. Diffusivity for these simulations is 10-14 m2/s. By defining different geometries which are different in particle radius, five simulations are set up and run. Diffusive fluxes are drawn from these simulations, and release times are based on the stop condition for constant release stage (Eq. 7).
C. Effect of Coating Thickness (l) on the Release of Urea Based on the model set up for urea diffusion model, simulations are done for five coating thickness such as 0.050, 0.075, 0.100, 0.125, and 0.150 mm with the same particle radius (2 mm). Diffusivity for these simulations is 10-14 m2/s. Diffusive fluxes are drawn from these simulations, and release times are based on the stop condition for constant release stage (Eq. 7).
particle sizes. Diffusive fluxes in these cases are around 1.0 × 10⁻⁶ mol/ (m2.s). Release time ranges from 34.84 days to 118.98 days as the particle size increases from 1 to 3 mm. Hence it can be deduced that the release time proportionally depends on the particle size. This relationship is a linear relationship as in Fig. 4 (R2 = 1). Release rate is from 1.04 × 10⁻¹⁰ mol/s to 4.07 × 10⁻¹⁰ mol/s as particle size changes from 2 to 4 mm.
As shown in Fig. 4 and Fig. 5, although the diffusive fluxes are almost the same (1.0 × 10⁻⁶) in these cases with a specific coating thickness, release time increases as particle size increases. The reason of this phenomenon comes from the change in overall mass of the urea particle. Moreover, the time for urea diffusing through coating layer depends on the amount of total urea inside the core. Therefore, the bigger the urea particle, the more release time it gains. So, urea particle needs more time for urea release. From this point, if one would like to increase the release time, changing in particle size is an easier way to adjust the release time within a small range. This conclusion was also mentioned by Shaviv et al. that increasing in the radius is more economical and technically feasible [4].
Fig. 4. Effect of particle size on urea release time when coating thickness is 0.1mm.
Fig. 5. Effect of particle size on diffusive flux when coating thickness is 0.1mm.
C. Effect of Coating Thickness on the Release of Urea III. RESULTS AND DISCUSSION
A. Model Development and Validation
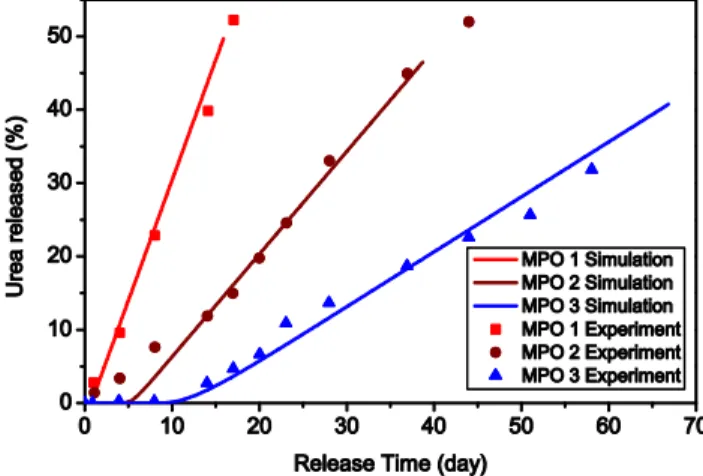
Simulations are conducted using information in Table I following experimental data from Shaviv et al. [4]. Their work was focused on MPO coating material, and experiments were conducted with three samples with the thickness as 0.0375, 0.0917, 0.1833 mm. Effective diffusivity, in all three simulations, is 1 ×10⁻⁵cm2/day. In Fig. 3, simulation data correspond with experiments from Shaviv et al.This proves that model has well simulated the release of urea during “constant release” stage.
Fig. 3. Simulation released profile and validation based on Shaviv et al.
experiments during “constant release” stage.
TABLE II: EFFECT OF PARTICLE SIZE ON THE RELEASE OF UREA
Particle
size
(mm)
Product
R0× l
(mm2)
Diffusive flux (mol/(m2.s))
Release
time (days)
Release
rate (mol/s)
1.0 0.10 9.52E-7 34.84 1.45E-11
1.5 0.15 9.82E-7 55.79 3.16E-11
2.0 0.20 9.98E-7 76.85 5.53E-11
2.5 0.25 1.00E-6 97.92 8.56E-11
3.0 0.30 1.01E-6 118.98 1.22E-10
B. Effect of Particle Size on the Release of Urea
Table II summarizes simulation results for different
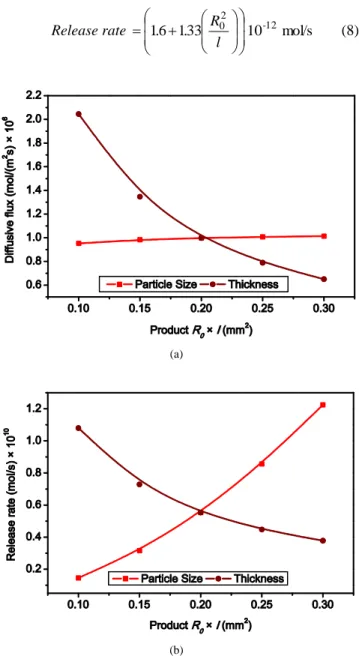
urea. Diffusive flux is 2.04 × 10⁻⁶ mol/(m2.s) as coating thickness is 0.050 mm, and it decreases to 0.65 × 10⁻⁶ mol/(m2.s) with a 0.150 mm of coating thickness. Release rate also decreases due to an increase on coating thickness.
Effect of coating thickness on the release time is plotted in Fig. 6. Release time changes from 76.85 days to 93.75 days when thickness changes from 0.1 mm to 0.125 mm. The difference between two thicknesses is 0.025 mm but release time increases 22%.
This change leads to a difficulty in coating technology when producing controlled release urea. If coating technique is not good, the release time of CRF will be varied and cannot be controlled because of the variation of the coating layer. From the above discussion, to get a well-controlled release urea, one not only concentrate on the material but also on the coating techniques. As a result, in design coating application, coating thickness must be identified for crop application, and particle size is used to obtain a release time suitable for crop period.
Fig. 6. Effect of coating thickness on urea release time when the particle size is 2 mm.
Fig. 7. Effect of coating thickness on diffusive flux when the particle size is 2 mm.
TABLE III: EFFECT OF COATING THICKNESS ON THE RELEASE OF UREA
Thickness
mm
Product
R0 × l
Diffusive flux mol/(m2.s)
× 106
Release
time days
Release rate mol/s
× 1010
0.050 0.1 2.04 40.28 1.08
0.075 0.15 1.35 59.03 0.73
0.100 0.2 1.00 76.85 0.55
0.125 0.25 0.79 93.75 0.45
0.150 0.3 0.65 109.84 0.38
D. Relationship Between Product R0 × l with Diffusive Flux, Release Rate
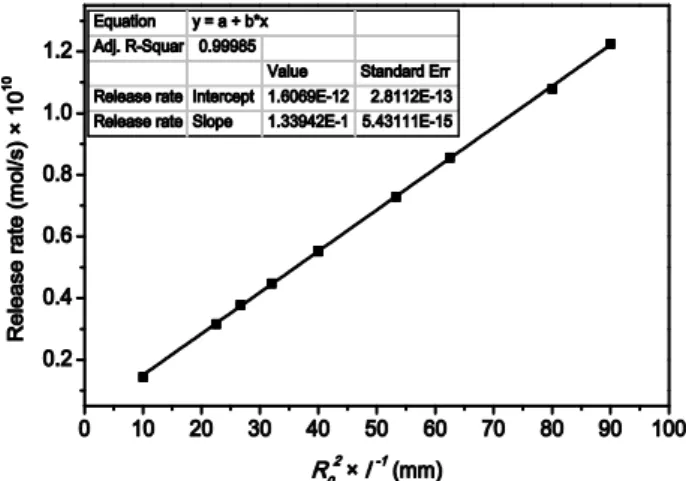
The effect of particle size and coating thickness on release rate also mentioned by Shaviv on modified polyolefin (MPO) and polyurethane-like coating (PULC) [4] but they act on difference ways as in our discussion. They stated: “Release rate inversely depends on the product of granule radius R0 and coating thickness l” [4]. It means that release rate increases when particle size or coating thickness decreases. From our results (Fig. 8), release rate increases due to a decrease of product R0 × l when changing the thickness (l), while the change in radius (R0) leads to an increase in release rate as the product R0 × l increases. There is no relationship between the product R0 × l with diffusive flux or release rate. However, a linear relationship between the product R02 × l-1 and release rate has been found as in Eq. 8 and Fig. 9.
Release rate 16 133 1012 mol/s 2
0 l R .
.
-
(8)
(a)
(b)
Fig. 8. Relationship between product R0 × l with diffusive flux (a) and release rate (b) when changing radius or thickness.
release rate also inversely depends on this thickness. Besides, release rate depends on diffusion surface area which equivalents to square of particle size R0. So, Eq. 8 can be used to estimate the effect of particle size and coating thickness of coated urea during constant release stage when effective diffusivity is 10-14 m2/s.
Fig. 9. Relationship between product R02 × l-1 and release rate.
IV. CONCLUSION
By using multi-diffusion model and 2D-FEM method, the effect of urea particle radius and coating thickness on urea release time are investigated. Release time is proportional to coating thickness and particle size but their mechanisms are different. Results also show that an adjustment in particle size is easier and more economical than coating thickness. Moreover, there is no relationship between product R0 × l with diffusive flux or release rate. However, a linear relationship between product R02 × l-1 and release rate has been found, and is in good agreement with diffusion theory.
ACKNOWLEDGMENT
Thanks to Ministry of Higher Education (MOHE) for financial support in this research.
REFERENCES
[1] M. E. Trenkel, Controlled-release and stabilized fertilizers in agriculture. Paris: International Fertilizer Industry Association, 1997. [2] S. M. Al-Zahrani, “Controlled-release of fertilizers: modelling and
simulation,” International Journal of Engineering Science, vol. 37, no. 10, pp. 1299-1307, August 1999.
[3] J. A. Kent, Kent and Riegel’s Handbook of Industrial Chemistry and Biotechnology, 11th ed., vol. 1&2, Verlag: Springer, 2007.
[4] A. Shaviv, S. Raban, and E. Zaidel, “Modeling controlled nutrient release from polymer coated fertilizers: diffusion release from single granules,” Environ. Sci. Technol., vol. 37, no. 10, pp. 2251-2256, 2003. [5] W. M. Jarrell and L. Boersma, “Release of urea by granules of sulfur-coated urea,” Soil Sci. Soc. Am. J., vol. 44, no. 2, pp. 418-422, 1980.
[6] V. Glasser, P. Stajer, J. Vidensky, P. Svandova, and V. Knor, “Urea-formaldehyde resins as packaging materials for industrial fertilisers with protracted action. part 4,” International polymer science and technology, vol. 14, no. 7–12, p. 127, November 1987.
[7] S. Gambash, M. Kochba, and Y. Avnimelech, “Studies on slow-release fertilizers: II. a method for evaluation of nutrient release rate from slow-releasing fertilizers,” Soil Science, vol. 150, no. 1, pp. 446 - 450, 1990.
[8] S. M. Lu and S. F. Lee, “Slow release of urea through latex film,” J. Controlled Release, vol. 18, no. 2, pp. 171-180, 1992.
[9] S. M. Lu, S.-L. Chang, W.-Y. Ku, H.-C. Chang, J.-Y. Wang, and D.-J. Lee, “Urea release rate from a scoop of coated pure urea beads: unified
extreme analysis,” Journal of the Chinese Institute of Chemical Engineers, vol. 38, no. 3–4, pp. 295-302, July 2007.
[10] M. E. Trenkel, "Slow- and Controlled-release and Stabilized Fertilizers: An Option for Enhancing Nutrient Use Efficiency in Agriculture," IFA, International fertilizer industry association, 2010.
[11] A. Shaviv, “Controlled release fertilizers,” presented at IFA International Workshop, Frankfurt, Germany, 2005.
[12] H. T. Trinh, K. Z. K. Shaari, A. S. Shuib, and L. Ismail, “Modeling of urea release from coated urea for prediction of coating material diffusivity,” in Proc. of the 6th International Conference on Process Systems Engieering, Kuala Lumpur, Malaysia, 2013, pp. 20. [13] T. H. Thanh, Ku Zilati Ku Shaari, Abdul Basit, and Babar Azeem, “Use
of multi-diffusion model to study the release of urea from urea fertilizer coated with Polyurethane-like coating (PULC),” in Proc. 2013 4th International Conference on Agriculture and Animal Science (CAAS), Phuket, Thailand, 2013.
[14] E. L. Cussler, Diffusion: Mass Transfer in Fluid Systems, Cambridge University Press, 2009.
[15] S. Savithri and M. S. Manju, “Kinetics of the carbothermal reduction of ilmenite: grain pellet model,” Excerpt from the proceedings of the COMSOL Conference 2009, Bangalore, 2009.
Thanh H. Trinh was born in Ho Chi Minh city, Vietnam on May 28th, 1981. He graduated Bachelor of Engineering in Chemical Engineering on 2004, and Master in Chemical Engineering on 2007 in Ho Chi Minh City University of Technology (HCMUT), Vietnam. Major fields: processes and units operations, simulation, and analytical chemistry.
He started his work in HCMUT from 2004 in courses of processes and units operations, optimization, modeling and simulation. Besides, he cooperated with Agilent and Bruker companies in Vietnam as a customer support, responsible in chromatography applications, FT-IR and FT-NIR applications. From 2010 to 2011, he also worked as an application manager in Key Laboratory of Chemical Engineering and Petroleum Processing - HCMUT. From 2011 until present, he study as a PhD candidate in University of Technology PETRONAS in ONEBAJA project for a new nitrogen based enhanced efficiency fertilizer production and utilization.
Ku Zilati Ku Shaari is an associate professor at the Chemical Engineering Department, Faculty of Engineering, Universiti Teknologi PETRONAS (UTP) and is affiliated to the Chemical Engineering Department as a Reaction Engineering Cluster Leader. She holds a degree in Chemical Engineering (Hons.) (University of Detroit Mercy, MI, USA) and Master in Chemical Engineering (West Virginia University, WV, USA). She completed her Ph.D in 2007 at West Virginia University, WV, USA. Her areas of expertise are particle technology, coating and computational fluid dynamic.
She is a member of BEM, IEM, IChemE and AIChE. She was an internship coordinator at UTP for 3.5-years‟ and has 6 years industrial experience as an engineer. She is also active in research and is currently a project leader of Long Term Research Grant Scheme. She has secured more than RM3 millions research grants, presented in more than 20 international conferences and published her research work in more than 30 indexed journals.
Abdul Basit was born in November, 1985 in Lahore, Pakistan. He received his degree in M. Sc. Engineering (Chemical Engineering) from University of the Punjab Lahore, Pakistan in 2012.
He served at the Institute of Chemical Engineering and Technology, University of the Punjab, Lahore, Pakistan as Lecturer from September, 2009 to May, 2012. He is currently studying as a PhD candidate in Universiti Technologi PETRONAS in Department of Chemical Engineering under ONEBAJA project for the production and utilization of a new nitrogen based enhanced efficiency fertilizer. His major filed is computational fluid dynamics modeling of „droplet spreading on porous surfaces‟.
Babar Azeemwas born in Gujranwala-Pakistan on Feb. 15, 1982. He received his BS-Engg. (Chemical) and MS-Engg. (Chemical) from the most prestigious seat of learning in Pakistan, the University of the Punjab, Lahore, in 2006 and 2011 respectively. Accomplished research projects focused mainly on environmental pollution control.
He enjoyed the privilege & honor of working as a Research Officer and a Lecturer at the esteemed University of the Punjab, Lahore-Pakistan for a period of more than 5 years. He also had been the coordinator for Skills Development Program of the University of the Punjab, aimed to train the engineers to have better
Professional skills. Currently he is doing his PhD from the Department of Chemical Engineering, Universiti Teknologi Petronas, Malaysia. The axis of his research interests (past & present) is the Process Economy and Environmental Pollution Control.