MICROSTRUCTURAL FEATURES ON APPARENT RATE
by Joshua J. Kane
A dissertation
submitted in partial fulfillment of the requirements for the degree of
Doctor of Philosophy in Materials Science & Engineering Boise State University
BOISE STATE UNIVERSITY GRADUATE COLLEGE
DEFENSE COMMITTEE AND FINAL READING APPROVALS
of the dissertation submitted by
Joshua J. Kane
Dissertation Title: An Intrinsic Model for Graphite Oxidation and the Effects of Microstructure on Apparent Rate
Date of Final Oral Examination: 02 July 2013
The following individuals read and discussed the dissertation submitted by student Joshua J. Kane, and they evaluated his presentation and response to questions during the final oral examination. They found that the student passed the final oral examination. Darryl P. Butt, Ph.D. Chair, Supervisory Committee
Rick Ubic, Ph.D. Member, Supervisory Committee
William E. Windes, Ph.D. Member, Supervisory Committee Karthik Chinnathambi, Ph.D. Member, Supervisory Committee Hui (Claire) Xiong, Ph.D. Member, Supervisory Committee
iv DEDICATION
This dissertation is dedicated to my wife.
Love suffers long and is kind; love does not envy; love does not parade itself, is not
puffed up; does not behave rudely, does no seek its own, is not provoked, thinks no evil;
does not rejoice in iniquity, but rejoices in the truth; bears all things, believes all things,
endures all things. Love never fails. 1 Corinthians 13:4-8a NKJV
v
ACKNOWLEDGEMENTS
Behind every PhD dissertation is a countlessly large group of individuals that have made the work possible in some way, shape, or form. I am very thankful to you all for your advice, guidance, and words of encouragement when I was ready to tear my hair out. There are a few groups and individuals, however, I would like to acknowledge specifically.
First, I would like to acknowledge that this dissertation is based on work supported by the Department of Energy [National Nuclear Security Administration] under Award Nos. 00041394/00026 and DE-NE0000140. Scanning and transmission electron microscopy studies were carried out at the Boise State Center for Materials Characterization and supported by the Department of Energy [National Nuclear Security Administration] under Award Number DE-NE0000338 and the National Science
Foundation Major Research Instrumentation Program, Award No. 0521315, respectively. Furthermore, I would like to acknowledge the funding of the Nuclear Regulatory
Commission under the Nuclear Materials Fellowship Program (NRC-38-08-955).
vi
I’d also like to thank Dr. Elisa Barney Smith of the Electrical and Computer Engineering department here at Boise State University for introducing me to the wealth of information obtainable through image processing and analysis as well as for advice on how to code the extraction of this information.
vii ABSTRACT
The very high temperature reactor (VHTR) is the latest generation of
high-temperature gas-cooled reactors (HTGR). The VHTR has higher outlet high-temperatures than a traditional HTGR with outlet temperatures up to 1000 °C. This high outlet temperature permits emissions-free process heat in the form of high-quality steam for high
temperature industrial applications. Moreover, the high temperatures of the reactor could potentially be used for hydrogen production from water or high efficiency electrical power production (~50% efficiency of thermal to electrical power conversion).
The VHTR is designed to employ helium as its coolant and uses graphite for its neutron moderator and as a key structural component for the core. Graphite is used because of it excellent structural stability at high temperatures, high thermal inertia, and the relatively low cost of its production. Since graphite is a key component to the VHTR, the integrity of the graphite is critically linked to the operable lifetime of the reactor. Thorough characterization of the graphite material used, as well as a complete
viii
radiation environment, and thus many of the phenomena responsible for degradation are well known.
Unfortunately, graphite is a complicated/complex material in that the properties are highly dependent upon the initial source of carbon, as well as variations in the coke type, size and relative quantities of filler and binder, and the manufacturing process used. Thus, each graphite used for nuclear applications is in some sense a new material with unique properties that must be thoroughly characterized before use in a reactor.
This dissertation research is focused on the pre-irradiation characterization of IG-110, PGX, NBG-18, and PCEA commercial graphites, the atomic level defects involved in irradiation induced shrinkage and swelling of these graphite materials, and finally the development of a unified reaction model for the oxidation of all high-purity nuclear graphites with oxygen. While similar characterizations and mechanistic studies have been made, many of the techniques used in this study such as electron energy loss spectroscopy (EELS), image processing and analysis, and filtering of high resolution lattice images were either impractical or unavailable in the past. This dissertation seeks to build on past studies of classical reactor grade graphites and use modern experimental techniques to further our understanding of the specific graphites examined and the underlying mechanism that contribute to graphite degradation.
ix
and later swelling, were found to vary significantly in size, shape, and quantity with graphite grade.
Chapter Three examines the atomic scale defects responsible for irradiation induced swelling and microcrack closure via transmission electron microscopy under electron beam irradiation. Utilization of noise-filtering in the frequency domain of lattice images and videos allowed analysis of the formation of vacancy loops, interstitial loops, and resulting dislocations with unprecedented clarity. The dislocations were observed to undergo positive climb resulting in the formation of extra basal planes. This in addition with the reduction in atomic density evidenced by electron energy loss spectroscopy is believed to be responsible for the graphite swelling in the c-direction and microcrack closure.
Using optical microscopy, the macro-scale features of the filler particles and macro-porosity were characterized in Chapter Four. The average size and shape of the two-dimensional cross-sections of the filler particles for each grade was determined. A qualitative trend was found between the aspect ratio of the particles and the degree of alignment of the particle crystallites. To characterize the porosity, image analysis was performed using code written in matlab. Probability densities were determined for the size and shape of the macroporosity. Furthermore, a preferred orientation was observed for all grades characterized. The code for two-dimensional analysis used for the
corresponding publication is currently being modified to analyze three-dimensional input data from µX-ray CT scans and will be published in a future journal article.
x
xi
TABLE OF CONTENTS
DEDICATION ... iv
ACKNOWLEDGEMENTS ... v
ABSTRACT ... vii
LIST OF TABLES ... xv
LIST OF FIGURES ... xvii
LIST OF ABBREVIATIONS ... xxii
CHAPTER ONE: INTRODUCTION ... 1
1.1 Graphite In Nuclear Reactor Applications ... 2
1.2 Need for Characterization of Candidate Nuclear Graphites ... 2
1.2.1 Irradiation-Induced Property Change ... 3
1.2.2 Bulk Microstructure Changes ... 4
1.3 Oxidation of Nuclear Graphite... 5
1.3.1 Significance of Carbon Combustion ... 5
1.3.2 Graphite Oxidation In Nuclear Reactors... 5
1.3.3 Complications in Determining a Graphite-Oxygen Gas-Solid Reaction Rate ... 6
1.3.4 Approach to Nuclear Graphite Oxidation ... 10
1.4 References ... 10
xii
Abstract ... 16
2.1 Introduction ... 16
2.2 Materials and Methods ... 20
2.3 Results and Discussion ... 20
2.4 Conclusions ... 30
2.5 Author Justification ... 30
2.7 References ... 31
CHAPTER THREE: IN-SITU TRANSMISSION ELECTRON MICROSCOPY OF ELECTRON-BEAM INDUCED DAMAGE IN NUCLEAR GRADE GRAPHITE* ... 34
Abstract ... 36
3.1 Introduction ... 36
3.2 Experimental ... 38
3.3 Results and Discussion ... 39
3.4 Conclusions ... 50
3.5 Supplementary Materials ... 51
3.6 Author Justification ... 51
3.7 Referenences ... 51
CHAPTER FOUR: MICROSTRUCTURAL CHARACTERIZATION AND PORE STRUCTRURE ANALYSIS OF NUCLEAR GRAPHITE* ... 56
Abstract ... 58
4.1 Introduction ... 58
4.2 Experimental ... 60
4.2.1 Sample Preparation ... 61
xiii
4.3 Results and Discussion ... 64
4.3.1 Filler Particle Size Analyses ... 64
4.3.2 Pore Structure Analysis... 71
4.4 Conclusions ... 79
4.5 Author Justification ... 80
4.6 References ... 81
CHAPTER FIVE: AN OXYGEN TRANSFER MODEL FOR HIGH PURITY GRAPHITE OXIDATION* ... 84
Abstract ... 86
Nomenclature ... 86
Coefficients, Constants, and Variables ... 87
5.1 Introduction ... 89
5.1.1 Nuclear Application ... 89
5.1.2 Oxidation Complications ... 90
5.1.3 Carbon-Oxygen Reaction Kinetics ... 94
5.2 Experimental ... 99
5.2.1 Graphite Powder ... 99
5.2.1 Powder Oxidation Experimental Setup ... 100
5.2.2 Electron Microscopy ... 101
5.2.3 Arrhenius Parameter Estimation ... 102
5.3 Results/Discussion ... 103
5.3.1 Shrinking Cylindrical Platelet Model ... 103
5.3.2 Effective Kinetics Parameters ... 108
xiv
5.4 Conclusions ... 125
5.5 Author Justification ... 126
5.6 References ... 126
CHAPTER SIX: CONCLUSIONS ... 137
xv
LIST OF TABLES
Table 4.1 Grain Size Comparison. Grain size refers to filler particle size. ... 60 Table 4.2 Measurements of Observed Filler Material. Major axis length (MAL),
standard deviation (σ), aspect ratio (AR). ... 64
Table 4.3 Statistical Summary of Pore Analysis. Mean is arithmetic mean. W. mean is weighted mean based on each pore’s fraction contribution to total porosity. ... 71 Table 4.4 Density Comparison. Summary of experimental and manufacturer
apparent density values versus theoretical density calculated from lattice parameters. ... 72 Table 4.5 Tabulated standard deviations for pore orientation distributions. Normal
distribution assumed, confidence interval given for α = 0.05. Slight
preferential orientation of major axis of pore observed. Sample population per face ranged from a minimum of ~87,000 to 327,000 pores. ... 74 Table 4.6 Porosity Size Distribution per Unit Area. The coefficients for distribution
of each grade given by equation 4.2. X is pore area in µm2. Y is
frequency per cm2. ... 76 Table 4.7 Parameters for Johnson SB Fit of Pore Eccentricity for Each Grade. ... 78
Table 5.1 Twelve Largest Impurities in NBG-18. Elemental analysis performed via ICP-MS. The quantities are given in terms of mass fraction. ... 100 Table 5.2 Absolute Relative Error Between Model and Experimental Data. The
average, standard deviation, and maximum residual error are tabulated to show the effect of the three optimizations (All, 1-10 kPa, and 10-40 kPa isobars) on the residual error for each individual isobar as well as the entire set of experimental data. ... 114 Table 5.3 Arrhenius Parameter Optimization of all Isobars. Activation energies
xvi
Table 5.4 Arrhenius Parameter Optimization of 1, 5, and 10 kPa Isobars. Activation energies expressed in kJ/mol. Dimensions for pre-exponential factors vary (see nomenclature section). Activation energies are given in kJ/mol. ... 114 Table 5.5 Arrhenius Parameter Optimization of 10, 20, and 40 kPa Isobars.
xvii
LIST OF FIGURES
Figure 1.1 Oxidized NBG-18 Graphite Density Profiles. All samples initially started out at approximately 4.75 mm in thickness. ... 7 Figure 1.2 Effect of Size on Apparent Oxidation Rate. X represents the thickness of
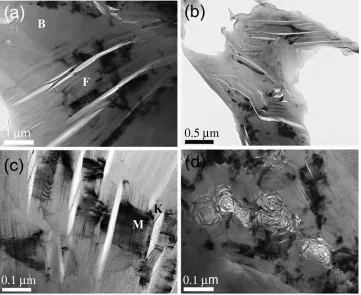
each set of graphite plates indicated next to the corresponding data set trend line. ... 8 Figure 1.3 Oxidized 4.75 mm Thick Graphite Plates ... 9 Figure 2.1 Schematic showing the layered crystal structure of graphite along with the unit cell outline. ... 17 Figure 2.2 Bright-field TEM micrographs of IG-110 grade graphite: (a) interface
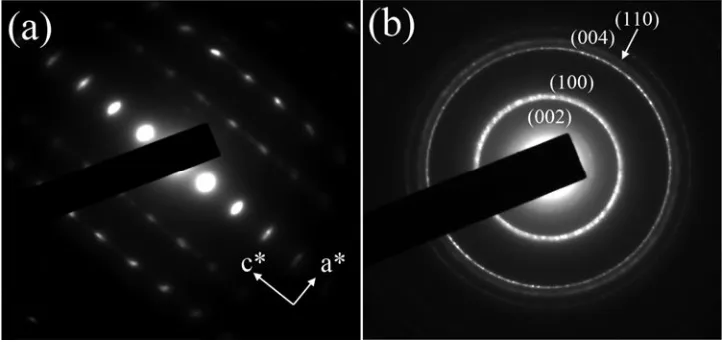
region between a filler particle (marked F) and binder (marked B), (b) filler particle at high magnification, (c) filler particle with kink boundaries (marked K) and moire fringes (marked M), and (d) binder region. ... 22 Figure 2.3 SAED diffraction pattern recorded from (a) filler particle and (b) rosette in
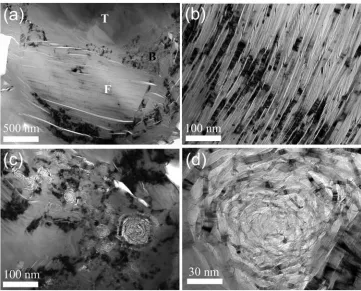
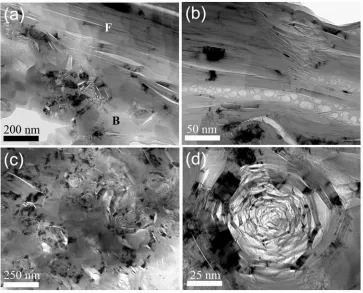
the binder region of IG-110 graphite. ... 23 Figure 2.4 Bright-field TEM micrographs of NBG-18 grade graphite: (a) interface
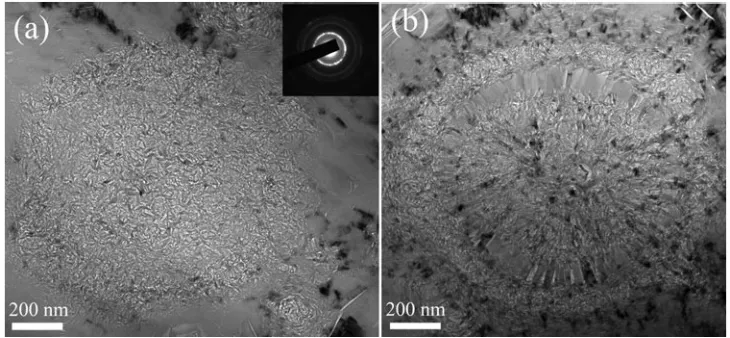
region constituting filler (marked F), binder (marked B), and turbostratic graphite (marked T), (b) filler particle at higher magnification, (c) binder region, and (d) rosette (QI particle) at high magnification. ... 25 Figure 2.5 Bright-field TEM micrographs of spherical chaotic structures in NBG-18
grade graphite. Inset in (a) shows a typical SAED pattern recorded from these structures. ... 26 Figure 2.6 Bright-field TEM micrographs of PCBA grade graphite: (a) interface
region constituting filler (marked F) and binder phase (marked B), (b) filler particle with cracks filled with porous amorphous carbon, (c) binder region, and (d) a rosette at high magnification. ... 27 Figure 2.7 (a) Bright-field TEM micrograph of turbostratic graphite recorded from
xviii
Figure 2.8 (a) Bright-field TEM micrograph and (b) SAED pattern recorded from powdered sample of IG-110 showing the presence of turbostratic carbon. ... 29 Figure 3.1 Bright field TEM micrographs showing the microstructure of NBG-18
nuclear-grade graphite recorded from (a) filler and (b) binder region. ... 40 Figure 3.2 Bright field TEM micrographs showing the effect of electron irradiation
on nuclear graphite; (a) shows a microcrack present in the as-prepared sample and (b) the same crack after ~ 1 dpa irradiation. ... 41 Figure 3.3 High resolution TEM images showing the effect of electron irradiation on
the graphite lattice. (a)-(c) Recorded sequentially from as–prepared, ~0.5 dpa, and ~1 dpa irradiated samples. Inset in (a) shows the nucleation of vacancy loops. (d) Close up view of the lattice recorded after ~0.25 dpa showing the creation of dislocation dipoles; one such marked with a dashed circle... 42 Figure 3.4 FFT of HREM images recorded from (a) as-prepared and (b) ~1 dpa
irradiated sample. ... 43 Figure 3.5 Noise filtered HREM images showing the formation of dislocation dipoles
via vacancy loops (a) shows the nucleation of a vacancy loop (~0.25 dpa) dissociating itself into a set of dislocations as shown in (b) with the incomplete planes marked with arrows, (c) shows the growth of the incomplete planes via positive climb and (d) shows the accumulation of several dislocations at higher irradiation doses resulting in disordering of the graphite lattice. Distance between two black fringes corresponds to (0 0 0 2) inter-planar spacing (~0.36 nm). ... 45 Figure 3.6 (a) Nucleation and (b) growth of an interstitial loop. ... 46 Figure 3.7 (a) Los-loss and (b) core-loss EELS spectra of the graphite recorded from
the as-prepared and ~1 dpa irradiated graphite. ... 48 Figure 4.1 Basic image processing flow: (a) original colored micrograph, (b)
gray-scale micrograph of (a) hue and saturation removed, but luminance retained, (c) histogram of (b) prior to contrast stretching and thresholding, (d) final binary image, this image is ran through connective components algorithm to extract quantitative pore data. ... 62 Figure 4.2 Optical micrographs of IG-110 graphtie: (a0 typical bright field
xix
length of filler particles are shallow shrinkage cracks and (d) dark field micrograph. P-Porosity, F-Filler, B-Binder, C-Shrinkage crack. ... 65 Figure 4.3 Optical micrographs of PGX graphite: (a) typical bright field micrograph
of PGX showing filler, binder, and porosity, (b) dark field micrograph of filler in binder matrix, (c) bright field micrograph of filler with long shrinkage cracks running parallel to particle’s long axis, and (d) bright field micrograph magnifying (c) P-Porosity, F-Filler, B-Binder,
C-Shrinkage crack. ... 66 Figure 4.4 Optical micrographs of NBG-18 graphite: (a) bright field micrograph
showing filler particles, binder, and porosity, (b) bright field micrograph of filler surrounded by binder matrix, (c) bright filed micrograph
magnifying the inner region of filler particles in (a) , and (d) bright filed micrograph magnifying the outer perimeter of filler particle in (a). P-Porosity, F-Filler, B-Binder, C-Shrinkage crack. ... 67 Figure 4.5 Optical micrographs of PCEA graphite: (a) bright field image showing
filler particles with various shapes, (b) bright filed micrograph of filler with relatively high degree of crystalline alignment surrounded by binder matrix, 9c) bright field micrograph of roughly spherical filler particles, and (d) bright field image of relatively small acicular filler particle. P-Porosity, F-Filler, B-Binder, C-Shrinkage crack. ... 68 Figure 4.6 Log-log plot of frequency of pore size per cm2 as a function of pore size.
... 75 Figure 4.7 Continuous Probability Distribution of Porosity Shape Described by
Eccentricity of an Ellipse. Inset plot is the 2nd derivative of the density function over the range of e = 0.95-1. ... 77 Figure 4.8 3D surface plot of the probability density of various pore shapes
xx
Figure 5.2 NBG-18 plate cross-sections showing progression of oxidation at 700 °C. Hours of oxidation: (a) 2 h (b) 4 h (c) 8 h (d) 12 h. Samples were run in a high-purity mixture of 21% O2 balance N2 (atomic basis) with flow rate of
500 sccm. All plate dimensions were approximately 4.5 x 13 x 51 mm. The scale bar in (d) applies to (a–c) as well. ... 92 Figure 5.3 Scanning electron micrographs of powder showing (a) a graphite platelet
oriented as depicted in the inset, (b) a graphite platelet oriented on edge, (c) a platelet oxidized at 575 °C to α≈ 0.5 at PO2 = 20 kPa, and a
transmission electron micrograph of oxidized NBG-18 binder showing (d) quinoline insoluble particle oxidized at 700 °C for 5 min at PO2 = 20 kPa.
... 103 Figure 5.4 The experimental measurements at 650 °C for 1, 5, 10, 20, and 40 kPa O2
in N2 of 1 - (1 – α)1/2 vs. time. The error from individual data points and
linear fits are insignificant relative to the error between measurements. 105 Figure 5.5 The temperature deviation from the isothermal set point and EOR vs. time.
A sample temperature controller was used to minimize sample
temperature deviation... 107 Figure 5.6 (a) An Arrhenius plot of SCPM data for the five experimental oxygen
isobars. (b) A plot of the effects of oxygen partial pressure and
temperature on ". The reaction rate constants are plotted relative to
", . (c) A ln-ln plot of carbon flux vs. oxygen
concentration. The shaded regions represent the two sided 95% confidence interval for the linear fits of each temperature. The slopes from each isothermal set are plotted I (d) to show the change in effective reaction order with temperature. The shaded region and dotted line represent the two sided 95% confidence intervals for the linear fit and the individual data points, respectively. The error bars in all subplots
represent two sided 95% confidence intervals about the sampled mean. 109 Figure 5.7 Results from the OTM (a) compares " of the experimental and
fitted OTM using paramters from Table 5.4. The residual error between the experimental values and the OTM is shown in (b). The total surface complex coverage of the edge places (denoted e) is shown in (c). (d and
e) Show the surface coverage of the individual reactive surface complexes Ce(O2) and Ce(O), respectively. (f) Shows the fractional carbon
conversion to gaseous CO predicted by the OTM compared to empirical fits of experimental data for various carbon materials [17, 78, 79]. ... 116 Figure 5.8 The figure shows high resolution transmission electron micrographs of
NBG-18 graphite. The reaction progression along the edge plane steps appears uniform. (a) Shows terracing commonly observed in large
xxi
xxii
LIST OF ABBREVIATIONS
HTGR High Temperature gas-cooled Reactor VHTR Very High Temperature Reactor TEM Transmission Electron Microscopy HREM High Resolution Electron Microscopy EELS Electron Energy Loss Spectroscopy SAED Selected Area Electron Diffraction
FFT Fast Fourier Transformation
DFT Density Functional Theory
TSA Total Surface Area
BET Brunauer-Emmett-Teller
ASA Active Surface Area
RSA Reactive Surface Area
SCCM Shrinking Cylindrical Platelet Model
CHAPTER ONE: INTRODUCTION
This dissertation is composed of four papers published in three journals, Microscopy and Microanalysis (Chapter Two), Journal of Nuclear Materials (Chapters Three and Four), and Carbon (Chapter Five). Chapters Two and Three utilize
transmission electron microscopy to characterize the different microstructures in nuclear graphites and atomic level defects in an irradiation environment. Chapter Four utilizes optical microscopy to determine the size and shape of the filler material and macro-porosity within the different grades. The final Chapter focuses exclusively on the oxidation of nuclear graphite and the development of an intrinsic oxidation model applicable to all grades of nuclear graphite.
A more detailed introduction is given at the beginning of each chapter on the specific applications and motivation for the experimental work; however, a broad overview is given in the following sections of this chapter.
1.1 Graphite In Nuclear Reactor Applications
Nuclear reactors are one potential low-carbon emitting technology. Graphite is used in HTGRs as a moderator and structural component due to its exceptional
moderating properties (its high scattering and low neutron absorption cross section), compressive strength, high thermal stability, easy machinability, and cost effectiveness [1]. The future generation IV very high temperature reactor (VHTR) design is the most advanced very high-temperature reactor design. It will be helium cooled and operated with core outlet temperatures in the range of 850 to 1000 °C. The VHTR has the
potential to be quite versatile in application because of its range of end energy products. These include high-efficiency electricity production (~50% efficiency), hydrogen
production from water, and production of high-quality steam critical to many industrial high temperature applications. While graphites have been use in the past for high temperature gas reactor programs in the United States, these graphites are no longer available and newer generations of graphite must therefore be used.
1.2 Need for Characterization of Candidate Nuclear Graphites
Graphite is a complicated and complex material in that the initial source of carbon as well as variations in coke type, its quantity of filler (relative to binder and later
inherent variability must be tested and validated, prior to use in a nuclear reactor, for new nuclear graphites any time a previous carbon source material is no longer available. Some of the key properties of interest are the dimensional change, mechanical and thermal properties, and the oxidation resistance of graphite in an air or moist environment.
1.2.1 Irradiation-Induced Property Change
Irradiation-induced changes in graphite during reactor operation are strongly linked to the virgin microstructure of the graphite under investigation and are therefore affected by the carbon source material and processing.
Under irradiation, nuclear graphite undergoes complex dimensional changes. During irradiation of a graphite single crystal, carbon atoms are displaced, resulting in the accumulation of interstitial loops between the basal planes. This accumulation over time begins to increase the inter-planar distance between graphene sheets. The interstitial clusters eventually coalesce and rearrange to form new basal planes resulting in an overall expansion along the c-direction and contraction in the a-direction which is explained by the formation of vacancy loops.
In a bulk (polycrystalline) nuclear graphite the material will initially shrink with increasing irradiation dose before reaching a “turn-around” dosage after which the
material begins to swell. Presently this is believed to be explained by the accommodation of swelling provided by microcracks parallel to the basal plane. The microcracks
microcracks have closed and are no longer able to accommodate swelling (the “turn-around”), the bulk material begins to swell.
The major focus of Chapter Two and Three was the thorough pre-irradiation characterization of the nuclear graphite microstructures. This work when combined with thorough post-irradiation characterization will yield valuable information regarding the phenomena and mechanisms involved in irradiation shrinkage, swelling, and creep of nuclear graphite. Chapter Two focused on the microstructure and Chapter Three focused on the in-situ observation of the atomic level defects responsible for shrinkage and swelling using an electron beam. The work in both these chapters made extensive use of transmission electron microscopy.
1.2.2 Bulk Microstructure Changes
While Chapters Two and Three focus on characterization of nuclear graphite on the nano- and atomic-scale respectively, Chapter Four focuses on the initial
characterization of microstructural features of the filler particles and macro-porosity. Thorough examination of the size, shape, and orientation of these features can yield valuable insight as the link between properties and microstructure. Data from the original publication has already been used by Contescu et al. [8] to partially rationalize and
1.3 Oxidation of Nuclear Graphite
1.3.1 Significance of Carbon Combustion
The combustion of carbon is arguably the most important and extensively investigated high-temperature reaction. Modern society and the world as we know it would not be possible without its utilization. In 2009, it was estimated that
approximately 41% of worldwide electricity production, came from coal-fired power plants [9]. As energy demand continues to climb globally, governments and industries alike have begun to investigate alternative low-carbon emitting technologies to lessen the effects of emitted carbon dioxide on climate change. Nuclear power is one such viable alternative to fossil energy. Ironically, in nuclear reactors the oxidation of graphite (carbon) is still an important consideration.
1.3.2 Graphite Oxidation In Nuclear Reactors
Since helium is used as the coolant within the VHTR design, oxidation is not a concern for normal or ideal operation; however, if a significant quantity of air or water were to reach the graphite within the reactor, its long-term structural integrity could be compromised. Thus, the oxidation of reactor graphite is an important consideration in reactor design and safety analysis.
its integrity is compromised, 2) release of fission products that have been absorbed in the graphite structures, 3) exposure of fuel containment to oxygen and subsequent release of fission products after graphite fuel elements have been oxidized [10]. Also of interest is the long-term (chronic) exposure of the graphite to minor oxidizing impurities in the helium coolant such as O2 and H2O and their effects on the integrity of the graphite
components.
1.3.3 Complications in Determining a Graphite-Oxygen Gas-Solid Reaction Rate The oxidation literature for nuclear graphite shows a great deal of discrepancy from grade to grade and even within a grade between experimenters. Typical activation energies determined lie in the range of 170-210 kJ/mol [11-18], although activation energies as high as 505 kJ/mol and as low as 123 kJ/mol have been reported [19-22]. Much of this variation seen in the nuclear graphite literature can be attributed to three phenomena which are dependent upon the microstructures of the different grades as well as the size and geometry of the specimen.
1.3.3.1 Oxygen Transport Limitations
The first phenomenon is transport of oxygen to the interior of the graphite
primarily at the surface, which leaves the sample interior relatively unoxidized. Two samples that have lost the same amount of mass, but have been oxidized at different temperatures, will likely have markedly different density profiles and thus substantially different mechanical properties.
Figure 1.1 Oxidized NBG-18 Graphite Density Profiles. All samples initially started out at approximately 4.75 mm in thickness.
Figure 1.2 Effect of Size on Apparent Oxidation Rate. X represents the thickness of each set of graphite plates indicated next to the corresponding data set trend line.
As shown in Figure 1.2, the rate of oxidation changes with sample dimensions. As the sample volume increases the rate of reaction decreases. The 4.75 mm thick plates likely oxidized slightly faster than the 2.4 mm thick plates because of the available surface area for the chemical reaction.
1.3.3.2 Changing Surface Area
As oxygen diffuses into a graphite sample and reacts, carbon is removed from the surface of pores. Initially, the surface area increases due to the opening of pores
directly proportional to total surface area, see Chapter Five), the apparent rate of reaction per unit volume will decrease with decreasing surface area. Thus a uniform apparent rate cannot be determined for the oxidation of graphite.
Figure 1.3 Oxidized 4.75 mm Thick Graphite Plates
1.3.3.3 Filler Versus Binder Oxidation Rate
microstructure rather than an intrinsic difference in the oxidation rate (refer to Chapter Two).
1.3.4 Approach to Nuclear Graphite Oxidation
The effects discussed previously in section 1.3.3 make the determination of a rate of reaction very difficult to predict for a particular graphite. Assuming a rate can be determined, given the factors discussed above, the extrapolation of rates for lab sized samples to the monolithic material used in reactors would have a great deal of
uncertainty. Moreover, if an accurate rate were to be determined for one graphite material, in all likelihood it would not be accurate for other grades (Section 1.2).
At an atomistic level each nuclear graphite grade has the same graphitic structure (refer to Chapter Two). It is therefore probable that at the atomic scale each graphite reacts at a nearly identical rate (refer to Chapter Five). If this is indeed the case, the size, shape, and arrangement of graphitic structures or lack thereof (porosity) at the nano- and micro scale (refer to Chapters Two and Four) are solely responsible for the differences in observed apparent rates of oxidation for nuclear graphites. If an intrinsic model for the oxidation of high-purity graphites was available, an apparent rate could hypothetically be determined for well characterized graphite.
1.4 References
[1] T. R. Allen, K. Sridharan, L. Tan, W. E. Windes, J. I. Cole, D. C. Crawford, and G. S. Was, “Materials challenges for Generation IV nuclear energy systems,” Nucl. Technol., 162 [3] (2008).
ORNL/TM-2007/153-10-07 (INL/MIS-10-19427), Oak Ridge National Laboratory, July 28, 2010.
[3] W. P. Eatherly and E. L. Piper, “Manufacturing”; pp. 21-51 in Nuclear Graphite. Edited by R.E. Nightingale, Academic Press, 1962.
[4] R. E. Nightingale, “Structure”; pp. 87-115 in Nuclear Graphite. Edited by R.E. Nightingale. Academic Press, New York, 1962.
[5] W. Bollmann, “Electron Microscope Study of Radiation Damage in Graphite,” J. Appl. Phys., 32 [5] 869-876 (1961).
[6] C. Baker, A. Kelly, “An electron microscope study of radiation damage in single crystal graphite,” Phil. Mag., 11[112] 729-746 (1965).
[7] A. Kelly and R. M. Mayer, “The influence of boron on the clustering of radiation damage in graphite. I. Electron microscope observations,” Phil. Mag., 19[160] 701-719 (1969).
[8] C. I. Contescu, T. Guldan, P. Wang, T. D. Burchell, “The effect of microstructure on air oxidation resistance of nuclear graphite,” Carbon, 50[9] 5278-5285 (2012).
[9] World Coal Institute. The coal resource: a comprehensive overview of coal, 48. Available from: http://www.worldcoal.org/resources/wca-publications/; 2005 [cited 07.11.12].
[10] T. D. Burchell, R. Bratton, and B. Marsden, “Next Generation Nuclear Plant
[11] E. S. Kim and H. C. No, “Experimental study on the oxidation of nuclear graphite and development of an oxidation model,” J. Nucl. Mater., 349, 182-194 (2006).
[12] H. Yang, H. Eun, D. Lee, C. Jung, and K. Lee, “Analysis of combustion kinetics of powdered nuclear graphite by using a non-isothermal thermogravimetric method,” J. Nucl. Sci. Technol., 43, 1436-1439 (2006).
[13] H. Kawakami, “Air oxidation behavior of carbon and graphite materials or HTGR,” Tanso, 124, 26-33 (1994).
[14] S. Chi and G. Kim, “Comparison of oxidation rate and degree of graphitization of selected IG and NBG nuclear grades,” J. Nucl. Mater., 381, 9-14 (2008).
[15] E. S. Kim, H. C. No, B. J. Kim, and C. H. Oh, “Estimation of graphite density and mechanical strength variation of VHTR during air-ingress accident,” Nucl. Eng. Des., 238[4], 837-847 (2008).
[16] L. Xiaowei, R. Jean-Charles, and Y. Suyuan, “Effect of temperature on graphite oxidation behavior,” Nucl. Eng. Des., 227[3], 273-280 (2004).
[17] H. K. Hinssen, K. Kühn, R. Moorman, B. Schlögl, M. Fechter, and M. Mitchell, “Oxidation experiments and theoretical examinations of graphite materials relevant for PBMR,” Nucl. Eng. Des., 238[11], 2018-2025 (2008).
[18] E. L. Fuller and J. M. Okoh, “Kinetics and mechanisms of the reaction of air with nuclear grade graphites: IG-110,” J. Nucl. Mater., 240, 241-250 (1997).
[20] M. S. El-Genk and J. P. Tournier, “Comparison of oxidation model predictions with gasification data of IG-110, IG-430 and NBG-25 nuclear graphite,” J. Nucl. Mater., 420, 141-158 (2012).
[21] M. S. El-Genk and J. P. Tournier, “Validation of gasification model for NBG-18 nuclear graphite,” Nuc. Eng. Des., 250, 142-155 (2012).
CHAPTER TWO: MICROSTRUCTURAL CHARACTERIZATION OF NEXT GENERATION NUCLEAR GRAPHITE*
This chapter is published by Cambridge University Press in Microscopy and Microanalysis and should be referenced appropriately.
Reference:
C. Karthik, J. Kane, D. P. Butt, W. E. Windes, R. Ubic, “Microstructural Characterization of Next Generation Nuclear Graphites.” Micros. Microanal., 18,272-278(2012).
Reproduced/modified by permission of the Cambridge University Press.
MICROSTRUCTURAL CHARACTERIZATION OF NEXT
GENERATION NUCLEAR GRAPHITES
Chinnathambi Karthika,b Joshua Kanea,b Darryl P. Butta.b William E. Windesb,c
Rick Ubica,b
Accepted for publication in: Microscopy and Microanalysis
April, 2012
a
Department of Materials Science and Engineering, Boise State University,
1910 University Drive, Boise, ID 83725.
b
Center for Advanced Energy Studies,
995 University Boulevard, Idaho Falls, ID 83415.
c
Idaho National Laboratory,
Abstract
This article reports the microstructural characteristics of various petroleum and pitch based nuclear graphites (IG-110, NBG-18, and PCEA) that are of interest to the next generation nuclear plant program. Bright-field transmission electron microscopy imaging was used to identify and understand the different features constituting the microstructure of nuclear graphite such as the filler particles, microcracks, binder phase, rosette-shaped quinoline insoluble (QI) particles, chaotic structures, and turbostratic graphite phase. The dimensions of microcracks were found to vary from a few nanometers to tens of microns. Furthermore, the microcracks were found to be filled with amorphous carbon of unknown origin. The pitch coke based graphite (NBG-18) was found to contain higher concentration of binder phase constituting QI particles as well as chaotic structures. The turbostratic graphite, present in all of the grades, was identified through their elliptical diffraction patterns. The difference in the
microstructure has been analyzed in view of their processing conditions.
2.1 Introduction
Nuclear graphite will be used in the next-generation very- high-temperature gas-cooled reactors owing to its excellent moderating properties (a high scattering and low absorption cross-section), high thermal stability, compressive strength, easy
they exhibit acceptable properties in both the non-irradiated and irradiated state.
Furthermore, the microstructure-property relation in irradiated nuclear graphites is poorly understood, probably due to the complexity of the microstructure.
Figure 2.1 Schematic showing the layered crystal structure of graphite along with the unit cell outline.
Single crystalline graphite has a layered structure formed by stacking of sheets of hexagonal rings of carbon atoms (graphene). The commonly found hexagonal structure of bulk graphite results from the ABAB, stacking of these graphene sheets perpendicular to the c-axis (Figure 2.1). The distance between these sheets, also called as basal planes, is 0.335 nm. The bonding between the in-plane carbon atoms is strong, while the
interplanar bonding is relatively weak resulting in more open space between the layers and highly anisotrophic physical properties. Nuclear graphite is an artificially-produced high-purity, polycrystalline material with a complex microstructure [2]. It is
carbonaceous material containing lamellar domains of large polycyclic aromatic molecules along with small quantities of ash and other impurities. Filler particles are manufactured by calcining the raw coke at temperatures around 1300 °C to remove the volatile hydrocarbons. This calcined coke is then crushed and sized as needed. These filler particles are mixed with a pitch binder at 165 °C. Binder is a thermoplastic material, composed of thousands of different hydrocarbons (mostly aromatic
compounds), derived from the distillation of coal tar. The resulting filler-binder mixture is cooled and formed into a rigid green body (via extrusion, molding, or isostatic
pressing). The green body is baked at 1000 °C, which results in the pyrolysis of the pitch and hence the evolution of a large volume of volatile gas. The baked material is
impregnated further with pitch binder to increase the density and graphitized in an inert atmosphere at temperatures ranging from 2500 to 3000 °C for several weeks. This process results in a polycrystalline material with a complex microstructure constituting several different graphite phases such as filler particles, binder phase, and quinoline insoluble (QI) particles (from the binder) [2-5]. It also contains a large volume of macro- and micropores, resulting from gas evolution, as well as macro- and microcracks (also called Mrozowski cracks) [4]. Graphite has a very high c-axis thermal expansion
The fast neutron damage of graphite moderators leads to the displacement of carbon atoms that significantly modifies the microstructure and hence the bulk properties. Under irradiation, graphite crystallites undergo dimensional changes that involve
expansion along the c-axis and shrinkage parallel to the basal planes [2, 6]. The common explanation for these changes is that the ballistic displacement of carbon atoms, caused by irradiation, results in the accumulation of interstitials between the basal planes, forcing them apart [7-8]. These interstitial carbon clusters eventually rearrange to become new basal planes, resulting in the expansion along the c-axis with a concurrent shrinkage along the a-axis postulated to be due to the collapse of basal plane vacancies. In
polycrystalline graphite, the microcracks can accommodate the c-axis expansion resulting in net shrinkage at lower doses of irradiation [9].
Ballistic displacement of atoms also results in significant creep even at room temperature [10], whereas significant thermal creep requires very high temperatures in excess of 2000 °C. The irradiation induced point defects result in an increased Young’s modulus (attributed to the pinning of dislocations) and a decrease in thermal conductivity (due to increased phonon scattering by vacancy clusters) [11]. Since all of these
processes alter the microstructure, it is important to fully understand the virgin
2.2 Materials and Methods
Transmission electron microscope (TEM) samples of these graphites were
prepared by conventional sample preparation techniques. Bulk samples of NBG-18 (SGL Group, Wiesbaden, Germany), PCEA (GrafTech International, Parma, OH, USA), and IG-110 (Toyo Tanso Co., Kagawa, Japan) were obtained from the manufacturers. Disks of 3 mm diameters were cut from the as-received bulk graphite using a diamond saw. These disks were further thinned mechanically to approximately 20-30 µm thick. A precision ion polishing system (Gatan PlPS 691; Gatan, Inc., Pleasanton, CA, USA) was used to achieve the final electron transparency. Ion-milling conditions were optimized to minimize the ion-beam damage. Typically, the samples were milled for about 60-70 min at 5° followed by a low angle milling step at 2° for 10 min. Electron microscopy studies were performed at room temperature on a 200 kV JEOL-2100 high-resolution TEM (JEOL Ltd., Tokyo, Japan).
2.3 Results and Discussion
the length of the particles [2]. This means that the shape of the resultant filler particles depends on the crystallinity of the coke used. Petroleum coke is usually highly crystalline whereas pitch coke is usually less crystalline, resulting in more spherical filler particles. It should also be noted that the quality of the coke can vary depending on the crude oil/coal-tar pitch source used, affecting the shape distribution of the resultant filler particles significantly. Figures 2.2b and 2.2c are at a higher
magnification and show the filler particles in different regions. The filler particles (as well as the binder) contain cracks running parallel to the basal planes. Microcracks are believed to form through delamination of the basal planes as a result of thermal
Figure 2.2 Bright-field TEM micrographs of IG-110 grade graphite: (a) interface region between a filler particle (marked F) and binder (marked B), (b) filler particle at high magnification, (c) filler particle with kink boundaries (marked K) and moire fringes (marked M), and (d) binder region.
pattern clearly shows the arcing of the spots, indicating the presence of low-angle twist boundaries that may be a result of the delamination process.
Figure 2.3 SAED diffraction pattern recorded from (a) filler particle and (b) rosette in the binder region of IG-110 graphite.
spiraling of the graphitic strands, which is equivalent to texturing in a direction perpendicular to the c-axis.
QI particles are basically solid particles similar to carbon black, composed of high-molecular-weight hydrocarbons [13-14]. These are formed either during the decomposition of coal or through the condensation of small aromatic molecules on the walls of the cracking chamber. It is believed that the aromatic molecules result in rosette-shaped particles constituting a spiral of graphite strands during graphitization. These strands are more disordered at the center of the rosettes. It can also be seen that these rosettes act as templates inducing the graphitization of binder around them in the form of wide concentric strands of graphite (marked with a dotted arrow in Figure 2.2d) retaining the crystallographic orientation of the outermost strand of the rosette. The concentration of QI particles in coal tars can vary from 2 to 12 wt% depending on the type of coal used and the production conditions. Unfortunately, the exact concentrations are proprietary and so not revealed by the manufacturers.
The presence of QI particles has been known to affect the mechanical properties of graphite [15]. Studies have shown the compressive strength of graphite to vary significantly with QI particle concentration, and there appears to be an optimum concentration where compressive strength is maximized. During baking, QI particles provide paths facilitating the escape of volatile species that reduces cracking and hence increases the strength of the final product [15].
(marked B), and turbostratic graphite (marked T). Figure 2.4b shows the close-up view of a filler particle delaminated into several fine stands (~10 nm in width) of graphite
resulting in numerous microcracks.
Figure 2.4 Bright-field TEM micrographs of NBG-18 grade graphite: (a) interface region constituting filler (marked F), binder (marked B), and turbostratic graphite (marked T), (b) filler particle at higher magnification, (c) binder region, and (d) rosette (QI particle) at high magnification.
concentration of the QI particles could be the usage of coal-tar pitch (as the binder source) which naturally tends to have a high concentration of QI particles [2]. Figure 2.4d is a high-magnification image depicting the internal structure of a QI particle, and the diffraction pattern obtained was similar to that in Figure 2.3b. The interior of QI particles appears to be more chaotic in case of NBG-18 compared to other grades.
Figure 2.5 Bright-field TEM micrographs of spherical chaotic structures in NBG-18 grade graphite. Inset in (a) shows a typical SAED pattern recorded from these structures.
Apart from the QI particles, the binder phase in NBG-18 showed the presence of several other types of spherical chaotic structures as shown in Figure 2.5. These
Figure 2.6 Bright-field TEM micrographs of PCBA grade graphite: (a) interface region constituting filler (marked F) and binder phase (marked B), (b) filler particle with cracks filled with porous amorphous carbon, (c) binder region, and (d) a rosette at high magnification.
The microstructural features of PCEA graphite, which is a nearly-isotropic. Extruded, petroleum coke based graphite, are depicted in Figure 2.6. Figure 2.6a shows an interface region between a filler particle (marked F) and binder phase (marked B) with embedded QI particles. Figure 2.6b shows the structure of a filler particle with
microcracks. The microcracks in the case of PCEA appear to be wider than in other grades. Another distinct feature of PCEA is that the amorphous carbon filling the
microstructure of the binder phase and a QI particle, respectively. The concentration of QI particles is comparable to that of IG-110. It should be noted that, unlike NBG-18, petroleum based pitch is used in the production of both IG-110 and PCEA, so they are expected to have negligible amounts of QI particles.
Figure 2.7 (a) Bright-field TEM micrograph of turbostratic graphite recorded from IG-110 grade graphite and (b) the corresponding SAED pattern.
elongated spots that lie on one [16]. As pointed out by Vainshtein et al. [17], one could index the spots on one ellipse with the same hk indices but with different l indices as shown in Figure 2.7b. Turbostratic graphite can form during the process of graphitization or normal graphite can be converted to the turbostratic form by weakening the bonding between the layers by; for example, mechano-chemical activation [18]. There is also a possibility of the accidental insertion of Ar+ ions between the layers during ion-milling resulting in turbostratic graphite. To verify this, TEM studies were carried out on powdered samples of graphite by dispersing the flakes of graphite particles on a TEM grid. TEM studies (Figure 2.8) showed the turbostratic graphite to be present even in the case of the powder samples. It confirms that the turbostratic graphite is an inherent characteristic of the nuclear graphite microstructure and not an artifact created by ion-milling.
Figure 2.8 (a) Bright-field TEM micrograph and (b) SAED pattern recorded from powdered sample of IG-110 showing the presence of turbostratic carbon.
to identify the probable microstructural mechanisms [19-20]. These studies show that the changes in the physical properties under irradiation are highly dependent on the filler particle size as well as the porosity; however, the experimental results obtained from various test reactors have shown these changes to be highly complex providing very little insight into the microstructural mechanisms [10]. One of the reasons for the difficulty is the poor understanding of the part microstructure plays identifying the properties, and the authors hope that this article adds valuable information on that front.
2.4 Conclusions
The microstructure of various grades of next generation nuclear graphite has been studied by using transmission electron microscopy. Bright-field imaging was carried out to characterize the different constituents such as filler, binder, and microcracks that constitute the complex microstructure of the nuclear graphite. The size and shape of the microcracks were found to be different for different grades. The pitch based graphite contains higher concentration of binder phase as well as QI particles compared to other grades, which is attributed to the source of the binder (coal-tar pitch). The presence of turbostratic graphite in all of the grades under study was also observed.
2.5 Author Justification
the early drafts of the manuscript and remained critically engaged throughout the publication process in terms of editing and discussion. Joshua Kane’s research was carried out as a partial fulfillment of the requirements for a Doctoral degree in Materials Science and Engineering at Boise State University, under the advisement and supervision of Dr. Darryl P. Butt. Dr. Rick Ubic, Dr. William E. Windes, and Dr. Darryl P. Butt contributed greatly in terms of financial support, detailed discussion features observed with respect to processing routes, and provided in-depth critical reviews of the article throughout the writing process.
2.7 References
[1] T. R. Allen, K. Sridharan, L. Tan, W. E. Windes, J. I. Cole, D. C. Crawford, and G. S. Was, “Materials challenges for Generation IV nuclear energy systems,” Nucl. Technol., 162[3] (2008).
[2] R. E. Nightingale, “Structure”; pp. 87-115 in Nuclear Graphite. Edited by R. E. Nightingale. Academic Press, New York, 1962.
[3] A. N. Jones, G. N. Hall, M. Joyce, A. Hodgkins, K. Wen, T. J. Marrow, and B. J. Marsden, “Microstructure characterisation of nuclear grade graphite,” J. Nucl. Mater., 381[1-2] 152-157 (2008).
[4] K. Y. Wen, J. Marrow, and B. Marsden, “Microcracks in nuclear graphite and highly oriented pyrolytic graphite (HOPG),” J. Nucl. Mater., 381[1-2] 199-203 (2008).
[5] K. Y. Wen, T. J. Marrow, and B. J. Marsden, “The microstructure of nuclear graphite binders,” Carbon, 46[1] 62-71 (2008).
graphite,” J. Nucl. Mater., 353, 12-18 (1993).
[7] P. A. Thrower and W. N. Reynolds, “Microstructural changes in neutron irradiated graphite,” J. Nucl. Mater., 6, 221-226 (1963).
[8] M. Heerschap and E. Schüller, “Vacancy and interstial loops in graphite single crystals reactor-irradiated at 900 °C and 1200 °C,” Carbon 7, 624-625 (1969).
[9] W. Bollmann, “Electron Microscope Study of Radiation Damage in Graphite,” J. Appl. Phys., 32[5] 869-876 (1961).
[10] J.H.W. Simmons, “Radiation Damage in Graphite”; Pergamon Press, Oxford, 1965. [11] C. H. Wu, J. P. Bonal, and B. Thiele, “Thermal conductivity changes in graphites and carbon/carbon fiber material induced by low neutron damages,” J. Nucl. Mater., 212-215, 1168-1173 (1994).
[12] M. W. Baroum, A. Murugaiah, S. R. Kalidindi, T. Zhen, and Y. Gogotsi, “Kink bands, nonlinear elasticity, and nanoindentations in graphite,” Carbon, 42, 1435-1445 (2004).
[13] I. Mochida, K. Maeda, and K. Takeshita, “Comparative study of the chemical structure of the disk-like components in the quinoline insoluble,” Carbon, 16, 469-467 (1978).
[14] P. A.Peaden, M. L. Lee, Y. Hirata, and M. Novotny, “High performance liquid chromatographic separation of high-molecular-weight polycyclic aromatic compounds in carbon black,” Anal. Chem., 52, 2268-2271 (1980).
[16] G. Schiffmacher, H. Dexpert, P. Caro, and J. M. Cowley, “Elliptic electron diffraction patterns from the films of turbostratic graphite,” J. Microsc. Spectrosc. Electron., 5, 729-734 (1960).
[17] B. K. Vainshtein, B. B. Zuyagin, and A. V. Avilov, “Electron diffraction structure analysis” in Electron Diffraction Techniques I. Edited by J. M. Cowley. Oxford University Press, New York, 1992.
[18] F. Salver-Disma, J. M. Tarascon, C. Clinard, and J. N. Rouzaud, “Transmission electron microscopy studies on carbon material prepared by mechanical milling,” Carbon, 37, 1941-1959 (1999).
[19] G. Hall, B. J. Marsden, and S. L. Fok, “The microstructural modeling of nuclear graphite,” J. Nucl. Mater., 353[1-2] 12-18 (2006).
CHAPTER THREE: IN-SITU TRANSMISSION ELECTRON MICROSCOPY OF ELECTRON-BEAM INDUCED DAMAGE IN NUCLEAR GRADE GRAPHITE*
This chapter is published by Elsevier in Journal of Nuclear Materials and should be referenced appropriately.
Reference:
C. Karthik, J. Kane, D. P. Butt, W. E. Windes, R. Ubic, “In situ transmission electron microscopy of electron-beam induced damage process in nuclear grade graphite,” J. Nucl. Mater., 412[3] 321-326 (2011).
Reproduced/modified by permission of the Elsevier.
IN-SITU TRANSMISSION ELECTRON MICROSCOPY OF ELECTRON-BEAM INDUCED DAMAGE IN NUCLEAR GRADE GRAPHITE
Joshua. Kanea,b Chinnathambi. Karthika,b
Darryl. P. Butta,b William. E. Windesb,c
Rick. Ubica,b
Accepted for publication in: Journal of Nuclear Materials
August, 2011
a
Department of Materials Science and Engineering, Boise State University,
1910 University Drive, Boise, ID 83725.
b
Center for Advanced Energy Studies,
995 University Boulevard, Idaho Falls, ID 83415.
c
Idaho National Laboratory,
Abstract
Atomic level processes involved in the swelling and crack-closing in nuclear grade graphite under electron irradiation have been observed in real-time using
transmission electron microscopy. Noise-filtered lattice images show the formation of vacancy loops, interstitial loops and resulting dislocations with unprecedented clarity. The dislocation dipoles formed via vacancy loops were found to undergo climb resulting in extra basal planes. Concurrent EELS studies showed a reduction in the atomic density because of the breakage of hexagonal carbon rings. The formation of new basal planes via dislocation climb in addition to the bending/breaking of basal planes leads to swelling and closing of microcracks.
3.1 Introduction
Artificial polycrystalline nuclear graphite will be used as a major structural and moderator material in high-temperature gas-cooled next-generation nuclear reactors [1]. Nuclear graphite has a complex microstructure consisting of filler particles, binder and microcracks parallel to the basal planes [2–4]. Since the historic nuclear graphite grades are no longer available, it is necessary to develop an understanding of irradiation
induced dimensional and property changes in the current and future grades. For this reason, there has recently been renewed interest in the characterization of the properties of nuclear graphite [5–10].
of carbon atoms caused by irradiation results in the accumulation of interstitial loops in-between the basal planes forcing them apart. These interstitial clusters eventually rearrange to form new basal planes resulting in the expansion along the c-axis. The a-axis contraction is explained at present by the formation of vacancy loops. At present it is argued that the bulk changes in polycrystalline graphite can be explained by the orientation of the crystallites coupled with accommodation provided by micro- cracks oriented parallel to the basal planes [8]. The microcracks accommodate the c-axis expansion resulting in net shrinkage at lower doses of irradiation [11–13] provided by the a-axis shrinkage. However, this explanation was disputed by Tanabe et al. [14, 15], whose room temperature electron microscopic studies on carbon fibers did not show any evidence for the formation of interstitial basal planes and their existence at room
temperature is controversial to date.
Niwase [16, 17] proposed a convincing model to explain the dimensional change as well as irradiation induced amorphization at lower temperatures based on the
accumulation of partial dislocations, yet the nature of such dislocations remains unknown. The reasons for the lack of clear understanding of radiation induced
Nevertheless, the microscopic studies have shown the neutron-induced damage in graphite to be similar to that of electrons which is believed to be because of the large open space between the basal planes [18, 19]. The openness of graphite results in less dense neutron-induced cascade structures compared to other close-packed materials which combined with the lower neutron dose rates in usual reactor environments result in annealing of cascade structures leaving a small number of point defects between cascades. Koike and Pedraza [20, 21] have carried out detailed microscopic studies on HOPG as well as nuclear graphite and established the similarities between electron and neutron-induced damage processes. However, as pointed out by Pedraza [21] one should not directly compare the calculated dpa values because of the difference in the dose rates and the consequent difference in the rate of defect pairs generated.
In the present study, the room temperature electron irradiation induced swelling, crack-closing, and associated microstructural processes performed on next-generation nuclear-grade graphite (grade NBG-18) were observed in situ using a transmission electron microscope (TEM). The changes in the local lattice structure of nuclear grade graphite under electron irradiation, especially the evidence for the formation of
interstitial loops have been shown with unprecedented clarity with the aid of noise-filtered high resolution electron microscopic (HREM) images obtained from videos recorded in situ electron energy loss spectroscopy (EELS) was also been used to monitor the changes in the bonding environment as well as the atomic density of the graphite.
3.2 Experimental
with 3 mm diameters were cut from the as-received bulk graphite. These disks were further thinned mechanically to approximately 100 µm thick. An ion-slicer (EM09100-IS, JEOL) was used to achieve the final electron transparency. Compared to
conventional ion milling techniques, the ion-slicer is known to produce minimal beam damage to the samples. In situ electron irradiation and EELS studies were performed at room temperature on a 200 kV JEOL-2100 high resolution transmission electron
microscope fitted with an EELS spectrometer (Enfina, Gatan). Since the irradiation induced processes were rapid, the whole process was captured in the form of a video. The noise reduction of the videos was carried out via notch-pass filtering of fast Fourier transforms. The entire filtering process was carried out using a MATLAB® code developed at Boise State University.
3.3 Results and Discussion
Figure 3.1 Bright field TEM micrographs showing the microstructure of NBG-18 nuclear-grade graphite recorded from (a) filler and (b) binder region.
Figure 3.2 Bright field TEM micrographs showing the effect of electron irradiation on nuclear graphite; (a) shows a microcrack present in the as-prepared sample and (b) the same crack after ~ 1 dpa irradiation.
Fig 3.3a–c shows lattice images recorded along [1 0 0 0] depicting the sequential changes in the (0 0 0 2) basal planes associated with swelling and crack-closing
Figure 3.4 FFT of HREM images recorded from (a) as-prepared and (b) ~1 dpa irradiated sample.
During the initial stages of electron irradiation, the nucleation of numerous dislocation dipoles was observed, the concentration of which increased with increasing dpa. A high-magnification lattice image shown in Figure 3.3d depicts few of these dislocation dipoles (marked with arrows). These dislocations were created by the formation of vacancy loops (Figure 3.3a inset). These images are highly noisy due to the fast scan rate used to capture the rapid changes in the lattice structure. In order to observe these changes more clearly Figure 3.5a shows a noise-filtered HREM image, this clearly shows the nucleation of a vacancy loop (marked with arrows) which leads to the formation of a set of edge dislocations with opposite Burgers vectors as shown in Figure 3.5b. These two snapshots were captured at 1 s interval. Fig 5b also shows the nucleation of more vacancy loops. It should be noted that the ballistic displacement of carbon atoms under intense electron irradiation results in high concentration of
low-energy single stacking fault (one layer of rhombohedral stacking) with a Burgers vector of
0 0 0 1
1 2 1 0. Subsequent snapshots show that these dislocations
Figure 3.5 Noise filtered HREM images showing the formation of dislocation dipoles via vacancy loops (a) shows the nucleation of a vacancy loop (~0.25 dpa) dissociating itself into a set of dislocations as shown in (b) with the incomplete planes marked with arrows, (c) shows the growth of the incomplete planes via positive climb and (d) shows the accumulation of several dislocations at higher irradiation doses resulting in disordering of the graphite lattice. Distance between two black fringes corresponds to (0 0 0 2) inter-planar spacing (~0.36 nm).
cluster even though the loop is not resolvable by the Fourier analysis. According to Muto and Tanabe [15], the interstitial loops would require to be larger than half the sample thickness to be visible in HREM images. Fig 3.6b, a subsequent snap shot recorded after 1 s irradiation shows a more fully grown interstitial loop with a lateral length of about ~5 nm. Most of the loops observed in this work were of similar size. The interstitial loops of sufficient size are considered to introduce a new c layer in the ab stacking of hexagonal graphite. These types of interstitial loops, also referred to as prismatic dislocation loops are essentially partial dislocations with a Burgers vector of
0 0 0 1 [24]. These interstitial loops were found to be highly unstable and
destroyed by further electron irradiation. With the increased irradiation, the
concentration of dislocations also increased, leading to an increase in the concentration of broken graphite layers, eventually leading to more randomization as shown in Figure 3.5d. The complete real-time noise-filtered video of the above mentioned processes is provided in video 1.
In order to obtain a better understanding of the implications of the electron irradiation damage on the atomic bonding, EELS was used to study the changes in the bonding environment associated with breakage and randomization of the graphite layers. Figure 3.7 shows the low-loss and core-loss EELS spectra recorded for as-prepared and after 1 dpa irradiation corresponding to the microstructures shown in Figure 3.3a and c. The low-loss spectrum shown in Figure 3.7a has two prominent features, a π-plasmon peak around 6 eV and π + σ plasmon peak around 25 eV. The π
Figure 3.7 (a) Low-loss and (b) core-loss EELS spectra of the graphite recorded from the as-prepared and ~1 dpa irradiated graphite.
From the peak position (Ep) of the π + σ plasmon peak, the change in the valence
electron density (ne) of the graphite was calculated using a relationship based on the quasi-free electron model [26],
ħ!"#$ (3.1)
where m* is the effective mass of electrons (for graphite, m* = 0.87me, where me is the
then be estimated from ne using the atomic mass of carbon and the number of valance electrons per carbon. This method of calculating mass density has been used and verified by several authors [27, 28]. From Figure 3.7a, the densities of the as-prepared and ~1 dpa irradiated graphite have been estimated to be 2.28 g/cm3 and 1.96 g/cm3, respectively, which is an average fall in density drop of about 16%. It should be noted that the density of the as-prepared graphite is essentially the theoretical density of single-crystalline graphite (2.26 g/cm3), which gives validation to this method.
The K-edge core-loss spectra for the corresponding doses are shown in Figure 3.7b. The spectra have two main features: a peak at ~285 eV and a maximum with extended fine structures at ~ 290 eV which are attributed to 1s-π* and 1s-σ* electronic transitions, respectively. It can be seen that the fine structure in the σ* peak
disappeared with the formation of a broad peak, which is indicative of the formation of fullerene like structures [29]. This change indicates the deterioration of the long-range periodicity within the basal plane due to the formation of non-hexagonal atomic rings, which corroborates the previously calculated reduction in density. Apart from
Initially, the formation and growth of new interstitial planes as a result of accumulation of displaced carbon atoms were considered to be the sole reason for the macroscopic swelling of graphite along the c-axis, but there was no clear
microstructural evidence creating doubt as to the above mentioned hypothesis for c-axis expansion [24]. In this work, clear evidence for the formation of interstitial loops at room temperature has been shown. However, the interstitial loops were found to be highly unstable and few in number, and therefore are unlikely to significantly
contribute to the observed swelling. Hence, the authors believe that the observed swelling along c-axis and the closing of microcracks is mainly because of the new basal planes being introduced by the positive climb of dislocation dipoles created via vacancy loops. The dislocation climb involves the migration and effective
accumulation of carbon atoms along c-axis leaving behind a high concentration of vacancies, the condensation of which on free surfaces might be a reason for the a-axis shrinkage. In addition, the significant reduction in density observed even at 1 dpa of electron irradiation shows the increase in the open nature of the lattice. As proposed by Niwase [16], as the dislocation dipoles increase in concentration, they introduce breaks, bends and curls in the basal planes, leading to the destruction of the lattice ordering and resulting in a more open structure which is confirmed from the increase in the
measured lattice parameter and decrease in density as shown by EELS study.
3.4 Conclusions