World Maritime University
The Maritime Commons: Digital Repository of the World
Maritime University
World Maritime University Dissertations Dissertations
2000
Investigation on the possible causes of declining dry
cargo throughput at Dar-es-Salam port
Nelly Kyejo Mtaki
World Maritime University
Follow this and additional works at:http://commons.wmu.se/all_dissertations
This Dissertation is brought to you courtesy of Maritime Commons. Open Access items may be downloaded for non-commercial, fair use academic
Recommended Citation
Mtaki, Nelly Kyejo, "Investigation on the possible causes of declining dry cargo throughput at Dar-es-Salam port" (2000).World Maritime University Dissertations. 412.
WORLD MARITIME UNIVERSITY
Malmö, SwedenINVESTIGATION ON THE POSSIBLE CAUSES
OF DECLINING DRY CARGO THROUGHPUT
AT DAR-ES-SALAAM PORT
By
NELLY KYEJO MTAKI
The United Republic of Tanzania
A dissertation submitted to the World Maritime University in partial fulfilment of the requirements for the award of the degree of
MASTER OF SCIENCE
in
PORT MANAGEMENT
DECLARATION
I certify that all the materials in this dissertation that is not my own work has been identified, and that no material is included for which a degree has previously been conferred on me.
The contents of this dissertation reflect my own personal views, and are not necessarily by the University.
……….. (Signature)
……….. (Date)
Supervised by:
Name: Jan Horck
Office: Lecturer, Port Management World Maritime University
Assessor:
Name: Benard Francou
Office: Associate Professor, Port Management World Maritime University
Co-assessor:
Name: Jean- Michel Mancion
ACKNOWLEDGEMENT
Writing of this dissertation would not have been possible without, assistance of different organisations and individuals. To all of them, I am highly indebted. However, I would like to mention and extend my special thanks to a few of them.
I would like to thank my sponsor, NORAD for sponsoring me to pursue this course. Special thanks should go to the Norwegian Shipping Academy (NSA) Education director, Tony Noonan and all the lecturers at the Academy through which, I got the sponsorship.
I am very grateful to my employer, the Principal of the National Institute of Transport for granting me a study leave.
My thanks should go to the Dar-Es-Salaam Port Manager and employees who provided me with data and information which, I needed for the research.
I extend my sincere appreciation to the Lecturers and Professors at the World Maritime University for broadening my knowledge on shipping industry in general and port issues in particular. Special thanks should go to my dissertation advisor, Captain J. Horck, for his devotion to go through my dissertation draft, advising and guiding me on various issues regarding the dissertation.
My heartfelt gratitude is due to my husband Kinanila, for convincing me to leave home a short time after going back from Norway. My gratitude is also due to my whole family for tolerating and enduring my absence. To my little child Malugu, I say sorry for being away from him for a long time.
ABSTRACT
Title of the Dissertation : Investigation on the Possible Causes of Declining Dry
Cargo Throughput at Dar-Es-Salaam Port.
Degree : MSc in Port Management
Dry Cargo Throughput at the port of Dar-Es-Salaam is declining. Two reasons were thought to be the possible reasons for the decline. One, poor quality of service at the port. Hence, customers are shifting to other ports particularly, Mombasa and Durban. Second, the ability of the port’s hinterland to generate dry cargo is declining.
The research intended at examining these two reasons in order to find out whether, they are actually the causes of the declining dry cargo throughput at the port of Dar-Es-Salaam or not.
Facts about the port’s quality of service and its hinterland’s ability to generate dry cargo were collected and analysed. After doing the analysis, the following have been found out:
1. The quality of service at Dar-Es-Salaam port is poor. It is more or less the same to the quality of service at Mombasa port. The quality of service at the port of Durban is much better than, the quality of service at Dar-Es-Salaam port.
2. Dar-Es-Salaam port is not losing cargo to Mombasa port.
3. Dry cargo throughput at Dar-Es-Salaam port is declining because one, the port is
losing cargo to the port of Durban and two, most of its hinterland ability to generate dry cargo is declining.
Various ways for improving the quality of service, maintaining the port’s market share and attracting more dry cargo towards the port have been recommended.
TABLE OF CONTENTS
Declaration ii
Acknowledgement iii
Abstract iv
Table of Contents v
List of Tables ix
List of Figures xi
List of Abbreviations xii
1. Overview on the Dissertation and Dar-Es-Salaam Port 1
1.1 Introduction 1
1.2 Overview of the Dissertation 2
1.2.1 Statement of the Problem 2
1.2.2 Objectives of the Research 4
1.2.3 Study Methodology 4
1.2.3.1 Data Collection 4
1.2.3.2 Methods of Analysis 5
1.2.4 Significance of the Study 6
1.2.5 Scope and Limitations 6
1.3 Overview of Dar-Es-Salaam Port 7
2. Literature Review 10
2.1 Introduction 10
2.2 Theoretical Literature Review 10
2.2.1 Meaning and Evolution of Ports 11
2.2.2 Ports as a Sub-system of the Transport System 12
2.2.3 Factors affecting Choice of Port 12
2.3 Empirical Literature Review 16
2.3.1 The Port Authority of Algeciras Bay 16
2.3.2 The Port of Århus 17
2.3.3 The Port of Bremen 17
2.3.4 The Port of Hamburg 18
2.3.5 Malta Free Port Corporation 18
2.3.6 Malmö Port 19
2.3.7 The Port of Rotterdam 19
2.3.8 Sea Malta Company at Malta Port 21
2.3.9 Weatherproof Cargo Handling Company 21 2.4 Summary 21
3. Quality of Service at Dar-Es-Salaam Port 23
3.1 Introduction 23
3.1.1 The Ship Operation 23
3.1.2 The Quay Transfer Operation 24
3.1.3 The Storage Operation 25
3.1.4 The Receipt/Delivery Operation 25
3.2 Performance Analysis 26
3.2.1 Productivity 26
3.2.2 Ship Time in Port 28
3.2.3 Container Dwell Time 30
3.2.3.1 Analysis of Container Dwell Time 30
3.2.3.2 Causes of Long Container Dwell Time 31
3.2.3.2.1 Cargo Documents Clearance 31 3.2.3.2.2 Long Delivery Procedure 33 3.2.3.2.3 Other Reasons 34
3.3 Security of Cargo 35
3.4 Customer Service 36
4. The Hinterland of Dar-Es-Salaam Port and its Ability to Generate
Dry Cargo for Sea Borne Trade 38
4.1 Introduction 37
4.2 Dar-Es-Salaam Port’s Hinterland 39
4.3 Alternative Ports and Inland Transport to Landlocked Countries 42 4.3.1 Ports in the East African Region 42
4.3.1.1 The Port of Dar-Es-Salaam 42
4.3.1.2 The Port of Mombasa 43
4.3.2 Ports in the South African Region 44
4.3.2.1 Ports in the South African Region and Transport to Landlocked Countries 44
4.3.2.2 The Port of Durban 46
4.4 Comparison of Dry Cargo through the Ports of DSM , Mombasa and Durban 48
4.5 Generation of Dry Cargo for DSM Port by each Country Served by the Port 50
4.5.1 Dry Cargo Generation by Tanzania 50
4.5.2 Dry cargo Generation by the Great Lakes Countries 52
4.5.2.1 Dry Cargo Generation by Burundi 53
4.5.2.2 Dry Cargo Generation by DRC 55
4.5.2.3 Dry Cargo Generation by Rwanda 56
4.5.2.4 Dry Cargo Generation by Uganda 57
4.5.3 Dry Cargo Generation by Zambia and Malawi 59
4.6 Marketing Strategies 63
4.7 Summary 64
5. Conclusion and Recommendations 65
5.1 Conclusion 65
Bibliography 71
Appendices 74
Appendix A. Questions for DSM Port Officials 74
Appendix B. Claims at Dar-Es-Salaam Port 75
Appendix C. Claims at Mombasa Port 76
LIST OF TABLES
Table 1. Dry Cargo Throughput at Dar-Es-Salaam Port 3
Table 2. Equipment at the General Cargo Terminal 8
Table 3. Equipment at the Container Terminal 8
Table 4. Evolution of Ports 11
Table 5. Port Management Options 14
Table 6. Throughput at the Port of Rotterdam and its Competing Ports 21 Table 7. Productivity at Dar-Es-Salaam Port 26
Table 8. Comparison of Productivity at Dar-Es-Salaam Port with that of other ports 27
Table 9. Ship Time in Port at Dar-Es-Salaam Port 28
Table 10. Ship Time in Port at Mombasa Port 29
Table 11. Container Dwell Time 31
Table 12. Percentage Share of Dry Cargo to/from each country Serve by Dar-Es-Salaam Port 39
Table 13. Dar-Es-Salaam Port and Overland Transport to Landlocked Countries 43
Table 14. Mombasa Port and Transport to Landlocked Countries 44
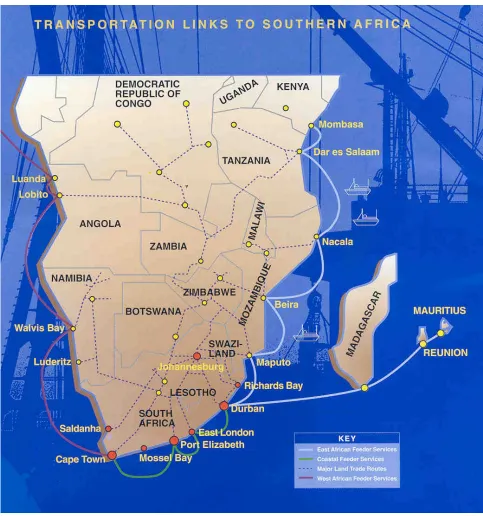
Table 15. Ports in Southern Africa and Inland Transport Routes to Landlocked Countries 46
Table 16. Dry Cargo through Dar-Es-Salaam, Mombasa and Durban Ports 49
Table 17. Exports and Imports from/to Tanzania through Dar-Es-Salaam Port 50
Table 18. Dry Cargo Generation by Burundi, D. R. of Congo, Rwanda and Uganda for Dar-Es-Salaam Port 52
Table 19. Dry Cargo from/to Burundi through Dar-Es-Salaam and Mombasa Ports and Share of Cargo through Dar-Es-Salaam Port 53
Table 22. Dry Cargo from/to Uganda through Dar-Es-Salaam and Mombasa Ports and Share of Cargo through Dar-Es-Salaam Port 57 Table 23. Dry cargo from/to Zambia and Malawi through Dar-Es-Salaam Port 59 Table 24. Distance from Malawi Cities to Dar-Es-Salaam Port, Durban
LIST OF FIGURES
Figure 1. Dry Cargo Throughput at Dar-Es-Salaam Port 3 Figure 2. Share of Dry Cargo of each Country Served by Dar-Es-Salaam
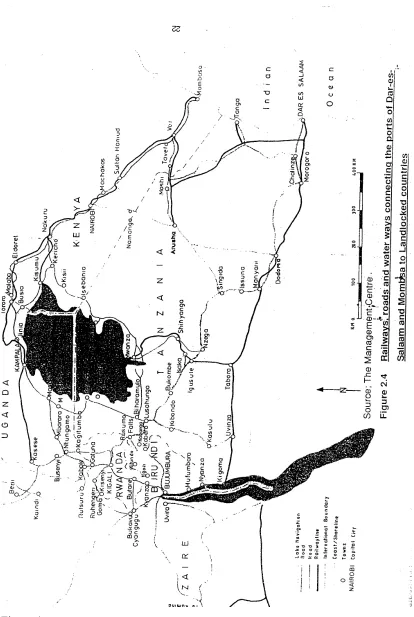
Port 40 Figure 3. The Hinterland of Dar-Es-Salaam Port 41 Figure 4. Dar-Es-Salaam and Mombasa Ports and Inland Transport
to Landlocked Countries 45 Figure 5. South African Ports and Routes to Landlocked Countries 47 Figure 6. Dry Cargo Throughput at Dar-Es-Salaam, Mombasa
and Durban Ports 49 Figure 7. Trend of Tanzania Dry Cargo 48 Figure 8. Dry Cargo from/to Burundi, DRC, Rwanda and Uganda 51 Figure 9. Dry Cargo from/to Zambia and Malawi through
LIST OF ABBREVIATIONS
AGV Automatic Guided Vehicles
CRM Customer Relationship Management DRC Democratic Republic of Congo DRMG Doppel Rail Mounted Gantry Cranes DSM Dar-Es-Salaam
KPA Kenya Ports Authority N/A Not Available
NASACO National Shipping Agency RMG Rail Mounted Gantry Cranes RTG Rubber Tyre Gantry Cranes
SATCC South African Transport Co-ordination Committee SSG Ship to Shore Gantry Cranes
SSHEX Sunday, Saturday and Holidays Excluded TAFFA Tanzania Freight Forwarders Association THA Tanzania Harbours Authority
TAZARA Tanzania-Zambia Railways TRC Tanzania Railways Corporation
CHAPTER ONE
OVERVIEW OF THE DISSERTATION AND DAR-ES-SALAAM PORT
1.1 Introduction
This dissertation was written in order to satisfy one of the requirements of the Master of Science (MSc.) in Port Management, at the World Maritime University. It is comprised of five chapters, namely:
i. Introduction.
This part is divided into two main sub-parts including an overview about the Dissertation and an overview on the port of Dar-Es-Salaam (DSM). The overview about the research explains the problem and objectives of the research, research methodology, significance of the research and its scope and limitations. The introduction about the port gives a general view of the port.
ii. Literature review.
iii. Performance of Dar-Es-Salaam port.
In this part, data and facts on the performance of the port, particulary those showing the quality of service including: productivity, ship time in port and cargo dwell time are presented and analysed. Explanation on security of cargo and customer service is given too.
vi. Traffic generation by the hinterland of Dar-Es-Salaam port.
Under this part, facts and data on the volume of cargo generated by the port’s hinterland are presented. The possible factors which affect the port’s hinterland ability to produce more dry cargo are also presented and analysed.
v. Conclusion and recommendations.
This part gives a summary on the findings of the research. Recommendations on how to solve the identified problems are also given.
1.2 Overview of the Dissertation
1.2.1 Statement of the Problem and Problem Background
The problem of the research is, declining dry cargo throughput at Dar-Es-Salaam Port. This probem is indicated in Table 1 and Figure 1 on page 3.
The highest volume of traffic was achieved in 1993 followed by 1992. From 1994 to 1998, the throughput was less than that of 1993 and 1992. For example, in 1998,
Table 1. Dry Cargo Throughput at Dar-Es-Salaam Port (In metric tonnes)
Years Imports Exports Total %ge Change 1 %ge Change 2 1991 1.028.091 866.169 1.894.260
1992 1.516.017 829.775 2.345.792 23.8 1993 1.567.666 885.317 2.452.983 4.6
1994 1.370.053 701.054 2.071.107 -15.6 -15.6 1995 1.347.535 736.977 2.084.512 0.7 -15.0 1996 969.107 696.792 1.665.899 -20.1 -32.1 1997 1.292.483 543.794 1.836.277 10.2 -25.1 1998 1.290.262 529.424 1.819.686 -0.9 -25.8 Average 1.297.659 723.663 2.021.315 0.3 22.7 (1) Yearly changes . (2) Changes from 1993.
Source: DSM Port Statistics Department
Figure 1.
the throughput handled was 25.7% less than that of 1993. From 1996 to 1998, the port handled less throughput than the throughput it handled in 1991. In 1998, the throuput was 3.9%less than in 1991. Due to this fact, despite the fact that, the average growth rate of dry cargo is 0.3%, it is said that, dry cargo throughput is declining.
Dry Cargo Throughput at Dar-Es-Salaam Port
0 500000 1000000 1500000 2000000 2500000 3000000
1991 1992 1993 1994 1995 1996 1997 1998
Tons
1.2.2 Objectives of the Research The objectives of the research were:
i. To show the trend of dry cargo throughput at the port of Dar-Es-Salaam from 1991 to 1998
ii. To identify the possible factors affecting the growth of the volume of dry cargo through the port.
iii. To examine the quality of service at the port and analyse it.
iv. To examine the port’s hinterland ability to generate dry cargo and to identify the possible factors which, affect the port’s hinterland ability to generate dry cargo.
v. To make recommendations on how to improve the factors that affect the throughput so that, more cargo can be attracted to pass through the port.
1.2.3 Study Methodology
Under this, methods for data /information collection and analysis are explained.
1.2.3.1 Data Collection
about the three ports include ship-turn round time, cargo dwell time, delay time, productivity, equipments and cargo security. Information about customer service, market problems and marketing strategies was also collected for Dar-Es-Salaam port.
Different written sources including books and handouts were consulted for theoretical literature review. Information for the empirical literature review was collected from ports’ magazines, internet, lecture handouts and notes on particular ports.
1.2.3.2 Methods of Analysis
Two factors were thought to be the possible causes for the declining dry cargo throughput. These factors are one, poor quality of service and two, port’s hinterland inability to produce adequate quantity of dry cargo. The research aimed at proving whether these two factors are actually the ones that, cause the throughput to decline or not.
cargo is growing. The throughput at Dar-Es-Salaam port is not growing because, the port is not competitive. In additional to these, various factors which affect the hinterland’s ability to produce adequate cargo are examined.
1.2.4 Significance of the Study
The significance of the study is that, the declining cargo throughput at the port is a threat to the port’s and the Government’s revenue prospects and to the country’s general economic development. Also, failure by the port to handle adequate amount of cargo leads to under utilisation of its facilities. For example, it utilises only 50.2% of dry cargo annual capacity while, the recommended utilisation is 60% (Horck, J. 2000). Its average berth occupancy is only 52.2% while, the recommended berth occupancy for eight berths and above is 78% (Francou, B. 2000). As a result of this, the port will either generate less revenue or incur losses. Due to this, the Government will get less revenue or no revenue at all. Consequently, it will fail to fulfil its obligations.The recommendations which are given in this dissertation, will certainly help to improve the situation.
1.2.5 Scope and Limitations
1.3 Overview of Dar-Es-Salaam Port
Dar-Es-Salaam port is one among three main ports which are under the Tanzania Harbours Authority (THA). The other ports are Tanga and Mtwara. The port of is the largest and the most important among the ports. It handles about 90% of the total traffic through the three ports (THA Corporate Plan 1996/7-2000/01).
The Tanzania Harbours Authority is a parastatal organisation. It manages and operates the ports on behalf of the Government which is the owner of the ports. The Mission of the organisation is ``to be the gateway for the Eastern, Central and South Africa International trade, totally dedicated to providing and facilitating quality, value added, competitive and profitable ports and state of the art technology and highly motivated workforce’’ (THA Annual Report, 1997/1998). The objectives of the port are as follows:
• To provide facilities and operate a co-ordinated system of harbours in accordance with the provision of the Act establishing it.
• To provide facilities relating to harbours services and services ancillary thereof.
• To act as warehousemen and store goods whether or not the goods have been or are to be handled as cargo by the Authority.
The port of Dar-Es-Salaam has three dry cargo terminals which are as follows: 1. General Cargo Terminal
Table 2. Equipment at General Cargo Terminal Equipment Type Capacity-Tons Quantity
Forklifts 2.5 to 3.5 81 ” 5 16 ” 10 1 Tractors N/A 48 Trailes N/A 79 Vacuvators N/A 6 Grabs N/A 29 Source: THA Corporate Strategy (1996/97-2000/2001)
2. Container Terminal
This Terminal covers a total lenght of 540 m. It is comprised of three berths. The depth of its berths is 12.2 m. The stacking capacity within the port is 3000 TEUs and 54 TEUs for reefers.
There is an inland container depot located at Kurasini, about two Km away from the port. This has a shed of 16.000 m2 capacity. It has an open stacking area which can stack 800 TEUs. The total terminal’s annual capacity is 120.000 TEUs, equivalent to 1.5 million tons. The terminal cargo handling equipment is shown in Table 3.
Table 3. Container Terminal Equipment Equipment Type Capacity (Tons) Quantity
3. Grain Terminal
Bulk cargo such as maize, wheat and fertilizer are handled at the grain terminal which has fully automated silos. Other facilities at this terminal include three bagging units and a fleet of ten Dump Trucks. The Silos have a capacity to store up to 30.000 tons of grain at any time.
Its entrance channel is 13 m at high tide and 140 m width since 1998. It allows ships of maximum length of 234 m at any time of the day. It operates from Monday to Friday, day shift 0700- 1500 and afternoon shift is between 15:00- 23:00 (normal working hours) and night shift from 23:00- 07:00, Saturdays, Sundays and Public holidays (over time). On average, 713 dry cargo deep sea vessels call at the port annually. In 1998, 801 ships called at the port.
CHAPTER TWO LITERATURE REVIEW
2.1 Introduction
As explained in chapter one, this chapter is divided into two main parts, theoretical and empirical literature. The aim of having this part was to enable the researcher and author as well as readers of this dissertation, to get a general knowledge from the available literature and to get experiences of other ports on the various factors which, can affect ports’ performance particularly, ports’ throughput. It also helps to show a clear picture on the position of the port of Dar-Es-Salaam, as far as performance on the provision of service is concerned by looking at what other ports do. The aim was also to find out possible methods of improvement from some of the available literature. The knowledge is useful for recommending on what should be done, in order to improve the performance and consequentlly, the throughput at Dar-Es-Salaam port.
2.2 Theoretical Literature Review
2.2.1 Meaning and Evolution of Ports
A port is a harbour having facilities for ships to moor and load or discharge. A port is sometimes referred to as ship/shore interface or a Maritime intermodal interface Alderton (1995, p. 253). Ports have to change over time due to the following factors: • The development and improvement of overland transport which can lead to a
need for a port to be bigger.
• Changes in trade patterns which can affect a port either negatively or positively. • Changes in financial and logistics thinking. A port can become an Industrial
area/ a marketing and distributuon centre.
• Changes in ship size with need for more water in the docks and approaches and the associated need for faster cargo handling equipment that leads to shorter ship turn-round times.
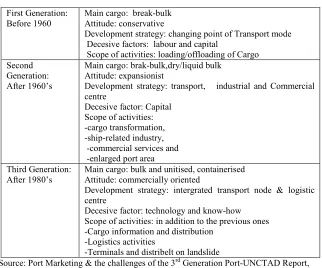
Due to a need for changes to take place in ports, ports have been changing from one generation to another as shown in Table 4 .
Table 4. Evolution of Ports
First Generation:
Before 1960 Main cargo: break-bulkAttitude: conservative
Development strategy: changing point of Transport mode Decesive factors: labour and capital
Scope of activities: loading/offloading of Cargo Second
Generation: After 1960’s
Main cargo: brak-bulk,dry/liquid bulk Attitude: expansionist
Development strategy: transport, industrial and Commercial centre
Decesive factor: Capital Scope of activities: -cargo transformation, -ship-related industry, -commercial services and -enlarged port area Third Generation:
After 1980’s
Main cargo: bulk and unitised, containerised Attitude: commercially oriented
Development strategy: intergrated transport node & logistic centre
Decesive factor: technology and know-how Scope of activities: in addition to the previous ones -Cargo information and distribution
-Logistics activities
-Terminals and distribelt on landslide
Source: Port Marketing & the challenges of the 3rd Generation Port-UNCTAD Report,
With changes taking place in ports, ports are not only what the traditional definitions of a port mean. Currently, ports are also industrial and distribution centres with advanced information technology.
2.2.2 Ports as Sub-systems of the Transport System
Ports are part of the International Transport System which includes port, shipping, land journey (which could be lorry, train, pipeline, conveyor), storage and goods handling at loading and discharging ports. As Stopford (1997) said, a transport system is a transport operation which has been designed so that, the different parts of the system link together as efficiently as possible. Like any other system and its parts, if any part of the transport system is not functioning efficiently, it will negatively affect the other parts and the whole system. The aim of the system is to move cargo as efficiently as possible over the whole distance from origin to destination. If this aim is achieved, more business can be won. Some of the ways for achieving this are :
i. To make cargo handling operation more efficient by use of high productivity handling equipment.
ii. Intergration of transport where each component is designed to fit in with the others.
iii. Provision of good service which includes frequent service, reliable, advanced information about vessel arrival and departure times, speed and security/safety of cargo. Reliability has become very important due to growing importance of just-in-time supply of stock. Stopford (1997, pp. 11, 294-296) said, some shippers may be prepared to pay more for a service which is guaranteed to operate to time and provide the service which is promised.
2.2.3 Factors Affecting Choice of Port
• Location
• Potential traffic base • Connectivity (multi-modal) • Terminal-Port efficiency • Financial considerations • Legal / Institutional factors • Nautical approach
solve his problems. The Swedish Ports’ and Stevedores’ Association (2000) emphasized that, ``it is absolutely vital that, ports improve their efficiency and productivity in order to keep or hopefuly, regain shares. It is a well known fact that, the bottleneck of sea transport is the port, where goods have to be loaded or discharged’’. For a port to be successful, both players at the port as well as the Government have to play well their roles. The promotion contenders said, the promotion role played by Governments can have a direct bearing on the success of those in the port related industries (Promotional contenders, 9/10 1999).
2.2.4 Types of Management of Ports
There are different types of management which ports can adapt. These types are show in Table 5.
Table 5. Port Management Options
Type Infrastructure Superstructure Stevedoring labour Other functions Landlord Port public private private public/public Tool Port public public private public/private Public Service Port public public public majority public Private Service Port private private private majority private
Source: Port Management Models and Privatisation- Handout. Rotterdam. April, 2000.
2.2.5 Importance of Ports in Economic Development
Transport is very important in the economic development of any country. Good transport system acts as a catalyst for economic development. It boosts agriculture and industrial production. As more and more economic activities are created/expand, more and more transport development and expansion is required. Generally, tranport development and economic development depend on each other. Due to the existance of this kind of relationship between tranport and economic development, it is said that, transport demand arises in order to satisfy other demands. Without demand for transport, there will be no need for it.
The volume of demand for transport is determined by the level of economic development. The level of economic development is measured by the rate of growth in the Gross Domestic Product (GDP). Stopford (1997, p. 238) said, a growth in GDP leads to increased demand for transport. A measure of economic output is divided into nine different sectors including Agriculture, Mining and Manufacturing. These are directly involved with trade, either through imports or exports. Other sectors are Construction, Wholesale and Retail trade, Transport and Communication and other services. Growth in these activities lead to growth in demand for sea transport in this case. In order to boost economic growth, both producers and Governments have to play their role.
Where there is no enough traffic, ships will not go. According to Taylor (1985) , ships change routes from where markets are unprofitable to elsewhere where more and newer raw materials become available and financial investiment in the economy of developing countries has enabled them to compete and require goods and equipment to support their economic progression.
adequate revenue and, the port will have a higher contribution to the country’s GNP. Also, if the port is efficient, importers can import and sell at cheaper prices which can be affordable by the majotity of people. Cheap prices will help to improve peoples living standard. Brian and Roach (1995, p. 8) said, if a port is inefficient, older ships will go to that route as a result. Shippers will not be able to obtain competitive freight rates, the country’s imports will be more expensive than they should be and its exports will be uncompetitive as they enter international seaborne trade.
From this literature review, among the things which have been learnt are that, if the quality of services provided at a port are not good and if, there is poor economic development which leads to inavailablity of enough traffic, ship owners and shippers will change routes. Basing on these, it was thought that, possibly, services which are provided at Dar-Es-Salaam port are not good hence, ship owners and shippers have decided to go to the ports which compete with DSM port. It was also thought that, the economic development of its hinterland is not good too, hence, its ability to generate enough traffic is negatively affected. These factors among others, have lead to declining dry cargo throughput at Dar-Es-Salaam port. The research intended at proving whether these assumptions are true or not.
2.3 Empirical Literature Review
As explained earlier, this section explains experience from other ports on the factors which they identify as factors affecting cargo throughput/success factors. It also explains the strategies they use for being competitive in the market and thus, being able to maintain or attract more cargo throughput.
ahead of customer needs and infrastructure improvement. They believe that, these are two pillars to recover its leadership in the Mediterrenean, despite more and more intensive competition in traffics (Puerto Bahia de’Algeciras, 15/11/98).
2.3.1 The Port of Århus: This port extensively uses EDI. With this equipment, there is no physical movement of people. All information regarding vessel operation that is, planning, arrival of vessel, order to load a vessel or a container, control, reporting, rail operation, receiving and deliverying are communicated through computer. Container movement and tracing is controlled by use of cameras and computers. These equipment facilitate quick communication and improved security of cargo.
The port has high capacity cranes. It has cranes which can handle 65 containers per hour (loading and off-loading at the same time). Crane productivity is 35 TEUs per hour. It has wheel stackers which can stack up to 60 containers per hour. Up to 101 containers pass through the gate per hour, this is the situation because, they have automated gate system. All customers of the port are on the line every day. The port identifies the following to be critical success factors:
continuos running of computer and
information system - equipment, know-how, innovation and procedures .
It has severe competion from the port of Hamburg hence, the Århus stevedoring company try to optimise logistics and be more productive. Due to their efficiency, the TEUs increase at 10% on average per year. The trend of general cargo is decreasing (Nielson, V. Lecture, 2000).
cranes, Post panamax cranes with capacity of 75 tons and van carriers. These enable the port to have productivity of 25 containers and 30 moves per hour. A ship stays at the port for 8 to 16 hours (The BLG in Bremen and Bremerhaven, 1998).
2.3.4 The Port of Hamburg: This port is owned by the city of Hamburg but operations are done by different private companies. The city provides infrastructure while private operators at its different terminals provide the superstructure. The port is well connected to its hinterland. There are feeder services, rail services overnight, lorries and baltic ferries and barges. It has advanced equipment, uses computer technology and highly qualified and experienced specialists (Port of Hamburg, 1998).
One of its container terminal operators-HHLA has the following equipments, RMG, Automatic guided vehicles (AGV), straddle carriers,and front loaders. The terminals productivity is 20 boxes per crane per hour. Productivity of DRMG with AGVs is 45 boxes per hour. Hence, the average produtivity is about 30 containers per hour. Container dwell time is 4 days ( Blauert, C. 2000). The port believes in training and flexibility in the use of operators like of cranes and reduction of labour cost while, increasing equipment utilisation as key factors for achievement of high productivity and thus, to be able to be competitive. It is the most expensive port among eight (from Hamburg- Le-havre range) competing ports, however, its throughput is growing -see Table 6 (Rotterdam Annual Report,1998).
time information of the entire container handling cycle. With this system, the terminal realises the following benefits:
increased gate productivity
reduced truck turn-round time
improved labour utilisation and productivity as it enhances data entry
enhances container movements update, vessel shedules and on line allocation of containers in the yard (Malta Free Port Magazine, 1999, p. 14).
It has different types of equipment for example, its terminal two has the following equipment, five post panamax quay side cranes and ten RTG cranes. It uses mult-trailer system to enhance flexibility whilst also guaranteeing fast movement of containers between terminals. Productivity at the terminal is 18 moves per hour. Between 1997 and 1998, TEUs increased by 62%.
The company believes in training and high personnel flexibility as essential and important ingredients to achieve a more productive and efficient workforce. It also believes in customer satisfaction as a key success factor. The port people attend user group for shipping lines and container terminals meetings.
2.3.7 The Port of Rotterdam: This port is owned by the Rotterdam Municipal council and managed by the Rotterdam Municipal Port Management (RMPM). The municipal provides infrastructure and leases land to private operators. Private operators provide the superstructure. The port has different types of advanced cargo handling equipment including straddle carriers, RMGs and AGVs. There are 191 multipurpose cranes, 72 gantry cranes, 30 tugs and other types of equipment. It has 750 leasees (Crook, G. 2000). It recognises the importance of customer service management, as a result of this, they have dedicated terminals to their most important customers like Maersk Delta BV. At the port, it is said that, `` within an environment characterised by globalisation, enlargement in scale and supply chain management, intensified cooperation with both suppliers and purchasers is becoming an ever important condition for maintaining or strengthening Rotterdam’s competitive advantage’’. The RMPM sees safe, smooth operations of shipping traffic and provision of good facilities as key factors for success. The average productivity at the port is 25 containers per hour. Its throughput is shown on table 6. Despite the fact that, the port has a number of competitors, in 1997 and 1998, the throughput increased by 6.2% and 1.5% respectively (Port of Rotterdam Annual Report, 1999). Its transhipment is growing and it is expected to continue growing, its turnover is expected to grow at 25%. This is because, the economy of its hinterland-Netherlands, Germany and Poland is expected to grow positively. This shows a direct relationship between the hinterland’s development and the port’s throughput development. It is also said that, the centre of excellence for port throughput systems are product innovation and research and development. ( Llyod’s Port Management, 9/10, 1999. p. 38). Various industrial activities like, petro-chemical refinery, packaging and distribution, metal recycling, plastic and rubber recycling are done at the port.
its full speed, it can process five hundred containers per day (Port of Rotterdam, December, 1999). Different activities at the port are remotely controlled and communication is done through computers.
Table 6. Throughput at the Ports of Rotterdam and some of its Competing Ports (In million tonnes)
Years Hamburg Bremen Amsterdam Rotterdam Antwerp Le-Havre 1998 75.8 34.4 55.8 314.8 119.8 66.4 1997 76.7 34.0 56.5 310.1 111.9 59.7 1996 71.1 31.5 54.7 292.1 106.5 56.2 1995 72.1 31.2 50.3 293.4 108.1 53.8 1994 68.3 30.9 48.1 293.9 109.5 54.4
Source: Rotterdam Municipal Port Management: Annual Report, 1998.
2.3.8 At Sea Malta Port Corporation: They believe that, efficiency which involve reduction of cost and time is a key factor for success. In order to be able to satisfy their customers, customers opinions are sought. Every employee fills complaints from customers in customers’ complaints form for action to follow. Also, customers and workers discuss together about the quality of service. They also believe that, the main marketing tool is contact with the customer.
2.3.9 Weatherproof Cargo Handling Comapany at the Port of Amsterdam. At this company, it is believed that, companies nowadays do not compete through pricing but by the quality of service. They also believe in training of employees on the effect of cargo damages as a key factor for success. In order to avoid delays due to bad weather and thus, being able to provide quick vessel turn-round time, they have covered their berth. This enables them to do loading and off-loading activities under any kind of weather (Lecture notes from the company, 14/4/ 2000).
2.4 Summary
CHAPTER THREE
QUALITY OF SERVICE AT DAR-ES-SALAAM PORT
3.1 Introduction
Port activities involve four main types of activities namely, ship operation, quay transfer operation, storage operation and receipt/delivery operation. These operations are interelated and interdependent. Failure to perform one of the operations as desired may unfavourably affect the performance of other operations and as a result, the performance of the port as a whole will be affected. Poor performance of these operations also adversely affects the quality of service and customers satisfaction. Hence, in order for a port to achieve desired or good performance, all these operations have to be properly planned and implented. The performance of each of these has to be measured in order to know whether it is good or not so that, if it is good, ways for making it better can be thought of and if it is not satisfactory, corrective measures can be found. Each of these operations has its performance indicators as explained in the subsequent explanation.
3.1.1 The Ship Operation
This operation involves the following activities: preparing cargo in the hold and hooking on the cargo, lifting the cargo to the quay, landing the cargo and unhooking and returning the hook to the hold to take a new cargo lift. Performance indicators for this kind of operation are:
• Gang output: This indcates the amount of tonnes the gang can handle in one
• Ship working output: It indicates how many tonnes the whole ship is handling in one hour.
• Shift output: It indicates the weight transferred during one shift.
Ship working output and shift output can be also expressed in output per day, per week, per month or per year. The output determines the length of time a ship can stay at the port from its arrival up to its departure. This legth of time is known as ship turn-round time. Ship turn-round time is another performance indicator of ship operation. To ship owners and shippers, time is very important. Ship owners would like to have time in port for their ships to be as short as possible. Likewise, shippers would like the ship operation to be as quick as possible so that, they can get their cargo quickly. In case the operation is slow, they may look for a port with quicker ship operations. The main factors that can affect the output are: the ship design, size and equipment, type of cargo, weight, packaging and stowage, the number of men in a gang and their skills, equipment and the management i,e. planning and control.
3.1.2 The Quay Transfer Operation
This operation links shipboard activities with the port’s storage areas. It is the task concerned with moving cargo to either storage areas from the quay or from the quay to onland means of transport. Performance indicators for this operation are:
• Moves per hour: This indicates the number of cycles (from the ship to the quay and back to the ship) a hook can perform per hour.
• TEUs per hoThis performance indicator shows the number of containers a hook
can shift from the ship to the quay in one hour.
The ship operation and quay transfer operation performance indicators are also known as productivity indicators.
3.1.3 The Storage Operation
As the word storage implies, this operation deals with keeping goods in storage facilities and taking care of them. There are two types of port storage including transit and long term storages. Long term storage ranges between 2-3 years while short term storage for transit is supposed to range between 2-4 weeks ( Horck, J. 2000). Some of the reasons for keeping cargo in transit storage are to accommodate for the imbalance between the quantity of cargo carried by the ship and the number of overland transport carrying units ready for inland transport and to allow for administrative formalities to be done. Another reason is to permit for cargo consolidation. These reasons and others may lead to cargo staying in the transit storage for more days than the preferred number of days if, they are not done in good time. The period of time cargo stays in the transit storage is known as cargo dwell time. Cargo dwell time is another measure of the level of customer service in ports. The recommended cargo dwell time is 3 to 4 days (Horck, J. 2000).
3.1.4 The Receipt/ Delivery Operation
All the mentioned indicators are used for measuring the quality of service. The quality of service means, suitability of a port and adequacy of its services to meet customers needs. It is related to satisfaction of customers’ needs. In this chapter, the performance of Dar-Es-Salaam port as far as the quality of service is concerned is presented and analysed by using the indicators which include: TEUs per hour, tonnes handled per shift per hour, tonnes handled per ship per day, ship turn-round time and cargo dwell time. Cargo security and customer service are also discussed.
3.2 Performance Analysis
3.2.1 Productivity
It refers to the units of cargo handled per equipment, per gang shift and per ship during a given unit period of time. Productivity at the port of DSM is shown in Table 7. In 1991 and 1998, productivity in terms of TEUs was 9 TEUs per hour. In 1996 and 1997, it was 12 TEUs per hour, it was the highest performance. The average productivity per shift per hour is 11 TEUs. The objective of THA is to handle 20 TEUs per hour. The international standard is 25 TEUs per hour. Comparing the ports performance with these, it can be seen that, the ports performance is very low. It is half of the desired performance and lower than half of the international standard.
Table 7. Productivity at Dar-Es-Salaam Port and Mombasa Port
Dar-Es-Salaam Port Mombasa Port
Year TEUs/Gang/ Hr Tons/Gang/ Shift Tons/Ship/ Day TEUs/Gang/ Hr Tons/Gang/ Shift Tons/Ship/ Day
1991 9.3 170.9 1.187.7 N/A 203 1.626
1992 9.0 195.8 1.225.7 N/A 213 1.542
1993 10.3 219.0 1.271.6 N/A 221 1.775
1994 10.8 204.9 1.210.2 N/A 230 1.703
1995 11.0 183.8 1.130.7 N/A 253 1.354
1996 12.0 215.5 1.198.9 N/A 257 1.795
1997 12.0 202.1 1.190.8 N/A 247 1.807 1998 9.4 210.0 1.195.0 5 250 1.614
Average 10.5 200.3 1.201.4 N/A 234.3 1.652
The port’s productivity has also been compared with that of Mombasa, Durban and some other ports in the world, Table 8 shows the comparison. Looking at this Table, it can be seen that, in 1998, the port’s productivity in terms of TEUs per hour was almost twice that of Mombasa port which is 5 TEUs per hour (East African, 29/5/00) and, much below that of Durban port, that is, 14 TEUs per hour (Fairplay, 6/4/2000). It is less than half of the performance of the other ports. Performance in terms of tons per gang per shift and per ship day, Mombasa port has a higher productivity than DSM port. It was 250 tons per gang per shift in 1998 and the average is 234.4 tons while, at DSM port it was 210 tons per gang per shift in 1998 and the average is 200.3 tons. The performance of DSM port in terms of tons per ship per day is 1201.4 tons on average and it was 1198.9 tons in 1998. At Mombasa port, it is 1652 tons per day on average and it was 1614 tons in 1998. In some ports in developed countries, productivity per ship per day is as follows: In Rotterdam port, it is 140.000 tons/day (with 2x85 gantry cranes), at Amazonehaven, it is 50.000 tons/day (with 1 loader at 5000 tons/hour). Productivity in Amsterdam port, is 65,000 tons/day and at Zealand Seaports, it is 60.000 tons/day (with 4x25 tons floating cranes) (Reji, 2000). The international standard of productivity is 640 tons per shift per hour. Comparing productivity at Dar-Es-Salaam port with productivity at these ports and with the
Table 8. Comparison of Productivity at DSM port and that of other Ports
Ports Containers/crane/hr. Tons/gang/shift Tons/ship/day
Dar-Es-Salaam 9 210 1.198.9
Durban 14
Mombasa 5 250 1.614.0
Århus 35
Malmö 25 150 1.222.3
Malta Free Port 18
Hamburg 20
Rotterdam 25 140.000.0
international standard, productivity at the port is very low. It is also lower than that, at Mombasa port.
Some of the reasons for poor productivity are: • Inadequacy of cargo handling equipment • Power interuptions
• Poor ship stowage
• Dubble utilisation of equipment particularly the RTG and Front Loaders • Equipment break-down
• Type of ships. Some of the ships calling at the port are old and not made for quick and direct discharge.
3.2.2 Ship Time in Port
Ship time in port includes waiting and service time. The ratio of waiting time to service time is another indicator of the quality of service at a port. The acceptable ratio is 10%. A port with a higher ratio than this, is considered to be of poor quality (Francou, B. 2000).
Table 9. Average Ship time in Port (Days/Ship) at DSM Port
Years Waiting Time (WT)
Service Time (ST)
Turn-Round Time (TRT)
WT/ST %
1991 0.1 4.9 5.0 2.0
1992 0.3 4.1 4.4 7.3
1993 0.2 4.0 4.2 5.0
1994 0.8 3.9 4.7 20.5
1995 0.5 4.1 4.6 12.2
1996 0.4 3.2 3.6 12.5
1997 0.5 3.5 4.0 14.3
1998 0.4 3.6 4.0 11.1
Average 0.4 3.9 4.3 10.6
Waiting time at the port of Dar-Es-Salaam as indicated in Table 9 , is 0.4 day (about 10 hours) on average. In 1998, it was also 0.4 of a day. From 1991 to 1993, waiting time to service time ratio was good, it was below the acceptable ratio. From 1994 to 1998, the performance deteriorated, it was above the acceptable ratio. In 1994, it was the highest, it was 20.5%. In 1998, the ratio was 11.1%, it was better than the ratio from 1994 to 1997. On average, the ratio is 10.6%. This ratio is slightly higher than the recommended one. Ship turn-round time at the port ranges from three to five days. In 1998, it was 4 days. On average, the turn-round time is 4.3 days.
The situation at Mombasa port is as shown in Table 10. Waiting time at the port is 2.6 days on average. From 1991 to 1998, the percentage of waiting time to service time is much higher than the acceptable ratio and the ratio at DSM port. The smallest ratio was in 1991 and the highest rate was in 1997, it was 204.3%. On average, it is 89.7%. In 1998, it was 46%.This situation indicates that, there is congestion at the port. In Freight (August/September, 1998), it is said that, ``delays at Mombasa port are encouraging more Ugandan shippers to move to alternative soutern route. This is due to congestion at Mombasa port’’. In 1998, turn-round time was 4.3 days.
Table 10. Ship Time in Port at Mombasa Port
Year Waiting Time Service Time Turn-Round-Time WT/ST %
1991 1.84 3.52 5.36 34.3
1992 2.97 3.4 6.37 87.4
1993 2.88 1.57 4.45 183.4
1994 3.47 2.93 6.4 118.4
1995 2.59 2.01 4.6 128.9
1996 2.45 1.45 3.9 169.0
1997 2.98 1.22 4.2 204.3
1998 1.36 2.94 4.3 46.3
Average 2.6 2.9 4.9 89.7
On average, it is 4.9 days. In 1998, waiting time at the port of Durban was 20 hours, ship working time was 31 hours hence, waiting time to service time ratio was 64.5%. Ship turn-round time at the port is 2.1 days (Portia Management Services, 1998). Waiting time ratio is not good, waiting time is too long in relation to working time. Waiting time is shorter at DSM port than the port of Durban. However, total Ship time in port is shorter at Durban than at DSM port.
Causes of waiting time with their average percentages in blakets as obtained from DSM port statistics include the following :
• Weather -rainfall and wind (16%)
• Waiting for shore handling equipment (7.7%) • Waiting for cargo (12%)
• Machine break-downs (6.7%)
• Waiting for lorries and wagons (11%) • Openning/closing hatches (3.9%) • Ship not at berth (6%)
• Electrical power failures (2.7%)
• A Master failing to complete ship papers prior to berthing of a ship (3.6%) • Waiting for labour shift (2.8%)
• Early finish (8.4%) • Miscelleneous (19%)
3. 2.3 Container Dwell Time
Container dwell time refers to time spent in port by a container from its arrival to its departure. Container dwell time for imports, exports and empties at the port of Dar-Es-Salaam is shown in Table 11.
3.2.3.1 Analysis of Container Dwell Time
Table 11. Container Dwell Time (Days per container)
Years 1991 1992 1993 1994 1995 1996 1997 1998 Average Imports 23.0 19.0 20.0 29.0 42.0 34.0 34.0 31.0 29.0 Exports 2.0 3.0 3.0 4.0 3.0 4.0 6.0 8.0 4.0 Empties 7.0 14.0 16.5 14.0 32.0 22.0 8.0 9.0 14.4 Source: DSM Port Statistics
4 days (Horck, J. 2000). The desired dwell time at the port is 7 days at most. At Durban port, dwell time for imports is 4 days (Portia Management Services, 1998) and in the port of Hamburg, it is 4 days (Bluert, C. 2000) too. Comparing the container dwell time at the port with the desired dwell time by the port and with that of the two ports, it can be clearly seen that, the container dwell time at the port is extremely long, it is about ten times the recommended time and that of the two ports. It is more than four times of the desired dwell time. At the port of Mombasa, the average dwell time for imports is 15 days (East Africa, 20/5/2000). This dwell time is about half of that, at Dar-Es-Salaam port.
3.2.3.2 Causes of Long Container Dwell Time
Some of the prominent causes of long cargo dwell time at the port are mentioned and explained under the subsquent explanation.
3.2.3.2.1 Cargo Documents Clearance
It is a requirement for anybody who clears cargo from the port to have proper official cargo documents. The documents enable him or her to clear his/her goods from the port. The procedure for clearing cargo is as follows: Prior to delivery of a container, the importer or his clearing agent is supposed to make sure that, the details on delivery documents are identical to those appearing on the terminal container records. On presentation of the documents, container records are consulted and their positions in the yard are identified.
port officials. A consignee is regarded to have a clear document when, his/her documents contain the information of cargo as per the records received by the port and which, is cleared by all the concerned officials. In most cases, it takes a long time to clear documents by consignees or their agents. Reasons for delays in getting clear documents are as follows:
1. Different locations for officials who are responsible for clearing the documents As stated earlier, documents for cargo have to be examined by custom authorities, ship agents and port authorities. These authorities are situated far away from each other. A consignee or his/her agent has to move from one place to another where the officials’ offices are located. Besides this, he/she or the agent faces a number of bureaucratic problems which hinder a smooth and quick cargo documents clearance process. Due to this, delay in getting clear cargo documents occurs.
2. Poor means of communication
In case one of the documents required for clearing cargo is missing, or in case there is an error in one of the documents after the consignee has handed them to a particular official, the document will be left unattended until the consignee or his agent physically meet the concerned official. Even in cases where the consignee or his agent has telephone, most of the officials do not bother to contact them instead, they will keep the documents aside till when the consignee or his/her agent appears physically. This means that, the clearance process will stop for a while, it will continue again when the consignee or his/her agent appears. This, attributes to delays in the cargo clearance process.
3. Little time allocated for cargo documents clearance documentation
4. Long time for customs verification
Cargo clearance documents are released by the customs authority after conducting a physical verification. On average, a 100% verification takes 2 hours for one twenty feet equivalent unit (TEU). Time for verification may be longer or less depending on the nature of container contents, number of staff doing the verification, parties to be involved, verification area and unpredictable situations such as rain.
The customs clearance procedure is long and cumbersome, this is why it causes delays in cargo clearance The Chairman of the Tanzania Freight Forwarders Association (TAFFA) complained that, cumbersome documentation and customs cargo clearance procedure is one of the causes of long cargo dwell time (East Africa, 18/Nov/1998).
3.2.3.2.2 Long Container Delivery Procedure
After completing the cargo clearing procedure, the consignee or his/her clearing agent obtains a delivery order which he/she presents to the port officials. At a container terminal, the procedure for clearing a container is as follows:
i. The consignee/clearing agent presents a copy of declaration and disposal order to the delivery office.
ii. After a certain time, a stop list is prepared and posted to the computer room, thereafter, it is sent to a yard supervisor for identification of the container position in the yard.
iii. After the identification of the position of the container in the yard, the list is posted to the yard supervisor who gives the consignee or his/her agent a loading permit.
v. Thereafter, the consignee or the clearing agent with the overland transporter present the loading permit to the RTG clerk who directs the haulier to pack his vehicle or put his wagon at a particular position ready for loading.
vi. After loading, the haulier moves the container to the check point gate for inspection whereby, a gate pass and interchange report is issued.
vii. Finally, the container moves to the security gate and exit.
With such a long process which require consignees to move from here and there within the port, and having in mind that, there are a number of consignees or clearing agents who go through the process at the same time, delays are bound to happen.
3.2.3.2.3 Other Reasons
1. Financial constraints: Sometimes, consignees collect their cargo late because, of lack of funds for paying customs charges/import duties and for paying THA port charges. This in most cases happens when there is sudden increase in tariff, resulting in unplanned expenses by consignees.
2. Late receipt of Bills of Lading by consignees.
3. Consignees not being aware of the arrival of their cargo at the port: This is caused by the inefficiency of the National Shipping Agency (NASACO), the then sole Shipping agency. This argument can be supported by the complaint expressed by TAFFA about NASACO. TAFFA attributed NASACO as one of the causes of long cargo dwell time. The Chairman of the association said, the inefficieny of NASACO is a cause of delay in cargo removal. He complained that, some of its members have lost potential customers to Durban in South Africa. Some principles have moved from Tanzania ports to other ports. The port has because of this, lost a substantial cargo throughput and revenues (East Africa,18th Nov,1998).
5. Lack of knowledge in documentation procedure by consignees who are not using clearing agents. It takes a long time for them to complete the clearance process. 6. Consignees waiting for acceptance or otherwise of their requests for waiver of
storage charges.
7. Failure to secure wagons in time by consignees especially TRC wagons.
8. Lack of inland transport due to closure of some sections of the railway lines particularly TRC railway lines and some parts of roads undergoing repairs. This usually happens when there are heavy rainfalls, especially in the northern part of Tanzania. TRC data reveals that, on average, from 1994 to 1998, there are 1538 hours and 1305 hours of railway closure per year due to accidents and floods respectively (TRC 1994 to 1998 Annual Reports).
9. Consignees keeping their cargo at the port while looking for buyers. This is a consequence of lower charges at the port than outside storages.
3.3 Security of Cargo
Comparing the quality of service at DSM port with the quality of service at Mombasa port, the situation is more or less the same. In Freight (Aug/Sept,1998), it is said that, Uganda Minister for trade and Industry has called for faster documentation and its own country section at the port to protect its cargo from pilferage. Uganda demand to have its own security due to poor security of cargo at the port. From Appendix C, it can be seen that, in 1998, claims arising from missing cargo which, was brought forward from 1997 amounted to 35,105,373.85 KShs (about 583.508.96 USD). Claims lodged during the year amounted to 99,274,479.64 KShs (about 1.650.457.47 USD). At the port of Durban, the quality of service regarding security of cargo is better than at DSM port. In the THA Corporate strategy (1996/97-2000/01) it is said that, DSM port ranks low in security of cargo and processing of claims when compared to competing ports in the south of Africa.
3.4 Customer Service
Customer service is a customer oriented philosophy which, intergrates and manages all elements of the customer interface. Good customer service is the output of customer satsfaction (Gray, R. 2000).
service which, DSM port ranks low as compared to South African ports (THA Corporate Strategy, 1996/97-2000/2001).
3.5 Summary
CHAPTER FOUR
THE HINTERLAND OF DAR-ES-SALAAM PORT AND ITS ABILITY TO GENERATE DRY CARGO FOR SEA BORNE TRADE
4.1 Introduction
The literal meaning of hinterland’s ability to generate dry cargo is, the physical capability of the hinterland to produce dry cargo. In this context, it means both ability to produce dry cargo for export as well as the capability to buy dry cargo for imports. The exports and imports concerned are those which, are transported by ships.
A particular hinterland’s ability to generate dry cargo may increase or remain constant but, its volume of cargo through a particular port which has competitors may decline because, the port’s competitors are able to attract more cargo from the hinterland. When the hinterland’s ability to generate cargo grows, the total volume of cargo through the competing ports increases and vice-versa. When the hinterland’s ability to generate cargo is declining, cargo through the more competitive ports may not decline, it will decline at the less competitive port (s). In case the competing ports are more or less equally competitive, cargo through each of the ports may decline.
the Great Lakes countries through DSM port and Mombasa port, the ports which are sharing this hinterland, have been compared and, the share of the cargo through DSM port has been analysed. For the hinterland which is shared by DSM port and Durban port that is, Zambia and Malawi, investigation has been done by analysing the trends of dry cargo to/from the countries through DSM port. This is because of lack of data on dry cargo to/from each of these countries through the port of Durban. Causes for declining ability to generate dry cargo by the hinterland or part of it are investigated. Before the analysis is done, DSM port’s hinterland and the port’s competitors are explained. Comparison of trends of the volume of dry cargo through DSM port, Mombasa port and the port of Durban is made. This comparison has been done in order to see, how the other ports are fairing in comparison with DSM port.
4.2 Dar-Es-Salaam Port’s Hinterland
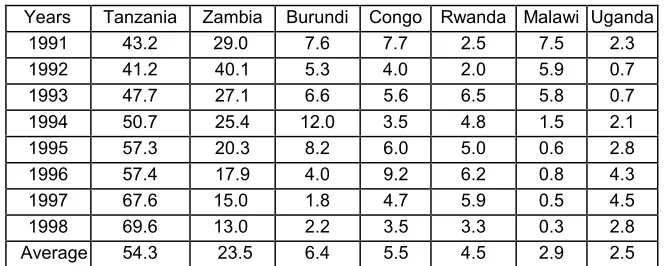
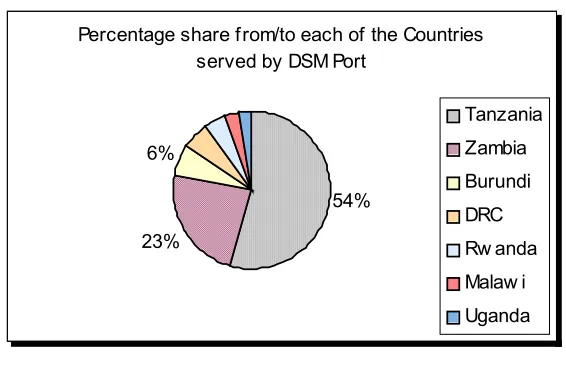
As earlier stated, the hinterland of DSM port include Tanzania as well as landlocked countries which are Burundi, The Democratic Republic of Congo, Rwanda, Uganda, Zambia and Malawi . The share of dry cargo via DSM port to and from each of these countries is indicated in Table 12 and Figure 2. Figure 3 shows the port’s hinterland.
Table 12. Percentage Share of Dry Cargo each Country Served by DSM Port
Figure 2
From Table 12 and Figure 2, it can be noted that, the major users of the port are Tanzanian exporters and importers. On average, Tanzania cargo accounts for 54% while, dry cargo from /to the six countries account for 45.07%. The share of Tanzania cargo has been increasing from 43.2% in 1991 to 69.6% in 1998. The second main user of the port is Zambia. Its dry cargo accounts for 23.5% on average from 1991 to 1998. Looking at the trend, this share has been declining. The largest share was in 1992, it was 40.1%. In 1998, it was 13%. The third largest user of the port is Burundi. Its average share is 6.4%. This country’s cargo share is also declining. The largest share was in 1994, it was 12.0%. From 1995, the share has been declining, in 1998 it was 2.2%. Burundi is followed by the Democratic Republic of Congo then, Rwanda comes after DRC. Malawi ranks fifth and the last one is Uganda. The shares of these countries except Uganda have been declining. The share of the Republic of Congo was 9.2% in 1996 and it was 3.5% in 1998. The share of Malawi cargo was 7.5% in 1991, it was 0.3% in 1998. Looking at the shares on yearly basis, Malawi has been the least user of the port since 1994. The share of Ugandan dry cargo in the total dry cargo through Dar-Es-Salaam port was 2.3% in 1991, while in 1998, it was 2.8%. However, from 1994 to 1997, it had been increasing. The largest share was in 1997, it was 4.5%.
Users of a port may be captive users or not. Captive users are those users who do not have alternative means, they have to use the port whether they like it or not. Port
Percentage share from/to each of the Countries served by DSM Port
54%
23% 6%
customers who are not captives have alternative ports which they can use. They can shift from one port to another, looking for a port which can satisfy better, most of their requirements. As far as the port of DSM is concerned, its captive customers are most of the importers and exporters from Tanzania. Non captive customers are those from landlocked countries. The landlocked countries can be served by other ports found in the south and in the east African regions. The alternative ports, means of transport and routes to these countries are explained in the following part.
4.3 Alternative Ports and Inland Transport to Landlocked Countries
The alternative ports are grouped into East African Region and South African Region.
4.3.1 Ports in the East African Region
There are two major ports in the East African Region, Dar-Es-Salaam and Mombasa. These two ports are competitors for cargo from/to the Great Lakes Countries. The altrnative routes and means of transport from these ports to the countries are shown in Tables 13 and 14.
4.3.1.1 The Port of Dar-Es-Salaam
Table 13. DSM Port and Overland Transport Routes to Landlocked Countries
Destination Route and Modes of Transport Zambia TAZARA Railway
TanZam Highway TAZAMA Pipeline
DRC TAZARA Railway via Zambia TAZARA Railway, road to Mpulungu and Lake to DRC TanZam Highway via Zambia Railway
TRC Railway to Kigoma via Lake to DRC
Road to Southern DRC via Zambia and via Burundi to Eastern DRC Malawi TAZARA Railway to Mbeya, road to Malawi/road toMalaw
Burundi TRC Railway to Kigoma via Lake to Burundi TRC Railway to Isaka, road to Burundi Road to Burundi
Rwanda TRC Railway to Kigoma, Lake or road to Rwanda Road to Rwanda
Uganda TRC Railway to Mwanza, Lake to Uganda Road to Uganda
Source: THA/TAZARA/TRC/SATCC
southern part that is, transport connecting DSM port with Zambia and Malawi are good. Besides the transport infrastructure, both TRC and TAZARA do not have sufficient wagons (East Africa. 3/3/2000).
4.3.1.2 The Port of Mombasa
Table 14. Mombasa Port and Inland Transport Routes to Landlocked Countries
Destination Route and Modes of Transport Burundi Road via Uganda and Rwanda Rwanda Road via Uganda
Road via Tanzania
DRC (Zaire) Road via Uganda, Rwanda and Burundi Road/Lake via Tanzania
Road via Tanzania and Burundi or Rwanda Uganda Road
KRC Railway
Source: KPA/KRC (Kenya Railways Corporation)
The port is connected to Congo by roads and railway via either Tanzania or Uganda and via either Burundi or Rwanda. It is connected to Burundi and Rwanda by roads and railways via either Uganda or Tanzania. It is directly connected to Uganda by roads and Kenya railways. The state of transport infrastructure connecting Mombasa and its hinterland is not good in some parts. In Freight (Aug./Sept., 1998), it is said that, `more Uganda shippers move to alternative southern route due to poor state of Mombasa – Nairobi Highway. However, most of the roads are better than the roads connecting DSM port and the Great Lakes region (Freight, Dec/Jan,1998).
4.3.2 Ports in the Southern Africa Region
Under this part, ports in the southern Africa and their overland transport connections to landlocked countries are mentioned. Explanation on the port of Durban which is DSM port’s main competitor in the southern region is provided.
4.3.2.1 Ports in the Southern Region and Overland Transport Connections to Landlocked Countries
Table 15. Ports in the Southern Africa and Inland Transport Routes to Landlocked Countries
Destinations Routes and modes of Transport Nacala to Malawi and Zambia Railway to Zambia
Road to Blantyre, Lilongwe and Zambia
Beira to Malawi and Zambia Railway to Blantyre and Lilongwe Railway to Blantyre, Lilongwe and Zambia
Railway to Zambia Maputo to Zambia, Malawi and
DRC
Railways to Zambia
Road to Zambia, Malawi and DRC Durban to Zambia and Malawi
Durban to Great Lakes Countries Durban to Uganda
Railways via Zimbabwe to Zambia and Malawi Railway via Zimbabwe, Zambia and Tanzania* Railway via Zimbabwe, Zambia and Tanzania* Cape Town to Zambia and DRC Railways to Zambia and DRC
Road to Zambia and DRC Walvis Bay to Zambia and DRC Railway to Zambia and DRC
Road to Zambia and DRC Source: South African Ports/Hoff & Overgaard a/s SATCC. 1996. Note: *These are planned routes (Freight, Aug/Sept, 1998).
In the southern part of Africa as well as southern part of Tanzania, there are a number of ports which can serve the landlocked countries which are served by the port of Dar-Es-Salaam. Currently, only Malawi and Zambia are served by some of these ports. These ports include: Nacala, Maputo and Beira in Mozambique, Walvis Bay in Namibia, Lobito in Angola and South Africa ports. The ports in South Africa are Richards Bay, Durban, Port Elizabeth, East London, Mossel Bay, Cape Town and Saldanha Bay.
4.3.2.2 The Port of Durban
65% on avarage of the Country’s entire traffic. It handles most of the transhipment