MINIATURE LINEAR PERMANENT MAGNET GENERATORS
by
Michael Ray Rippee
A thesis
submitted in partial fulfillment
of the requirements for the degree of
Master of Science in Mechanical Engineering
Boise State University
DEFENSE COMMITTEE AND FINAL READING APPROVALS
of the thesis submitted by
Michael Ray Rippee
Thesis Title: Testing, Analysis, and Model Verification of Miniature Linear Permanent Magnet Generators
Date of Final Oral Examination: 19 October 2012
The following individuals read and discussed the thesis submitted by student Michael Ray Rippee, and they evaluated his presentation and response to questions during the final oral examination. They found that the student passed the final oral examination.
Donald Plumlee, Ph.D. Chair, Supervisory Committee
John Chiasson, Ph.D. Member, Supervisory Committee
John Gardner, Ph.D. Member, Supervisory Committee
The military has become increasingly dependent on mobile electronic equipment
to ensure success and safety of soldiers in remote locations. To operate the electronics,
soldiers must carry batteries that can weigh up to 12kg (26.5lb). To decrease the load
soldiers must carry, a backpack with an internal linear electric generator has been proposed
to provide portable power for soldiers on foot. In designing a generator for this purpose,
a simulation was developed to predict the power generation capacity of linear permanent
magnet generators. This thesis presents work done to experimentally verify the theoretical
simulation with a desired accuracy of 20%. An experimental power-testing apparatus was
developed and used to test four geometries of generators. After initial comparisons gave
unacceptable error, the magnetic field prediction was adjusted to provide better accuracy.
After the adjustment, the model was shown to predict average power generation of the
four generators within 11% accuracy. The simulation was then used to predict an optimal
linear generator consisting of stator coils made of 32awg wire with 267 windings of wire.
ABSTRACT . . . v
LIST OF TABLES . . . ix
LIST OF FIGURES . . . x
LIST OF SYMBOLS . . . .xiv
1 Introduction . . . 1
1.1 Justification for Portable Power . . . 1
1.2 Defining the Portable Power Needs . . . 3
1.3 Introduction to Energy Scavenging Devices . . . 9
1.4 Linear Permanent Magnet Inductive Generator . . . 13
1.5 Proposed Design . . . 15
1.6 Thesis Layout . . . 17
2 Background . . . .19
2.1 Kinetics of a Typical Walking Gait . . . 19
2.2 Wave Energy Converters . . . 20
2.3 Low Temperature Co-Fired Ceramic . . . 26
3 Description of Theoretical Model and Preliminary Results . . . .29
3.1 Simulink Power Model . . . 29
3.1.2 Magnetic Coupling Between Translator and Stator Coils . . . 32
3.2 Stator Coil Design Proposed by Bateman . . . 34
3.3 Model Results . . . 37
4 Design and Fabrication of Testing Apparatus and Generators . . . .41
4.1 Parameters Used to Develop Testing Methods for Model Validation . . . 41
4.2 Test Stand . . . 44
4.2.1 3D Modelling and Description . . . 44
4.2.2 Materials and Fabrication . . . 48
4.2.3 Motor Control System . . . 49
4.2.4 Generator Measurement System . . . 52
4.2.5 Completed Test System . . . 52
4.3 Stator Design . . . 55
4.3.1 Materials . . . 55
4.3.2 Fabrication . . . 57
5 Testing and Results . . . .59
5.1 Preliminary Testing . . . 59
5.2 Adjusting Simulink Model . . . 63
5.2.1 Mechanical Simulation . . . 63
5.2.2 Magnetic Model . . . 64
5.3 Testing with Adjusted Power Model . . . 68
5.4 Further Testing with Various Generators . . . 73
5.4.1 Results for All Stator Designs . . . 74
5.5 Comparison of Experimental and Simulated Data Over a Range of Frequencies77 5.6 Concluding Results . . . 80
6.1 Using Simulink Model to Predict the Optimal Generator Design . . . 82
6.2 Future Work . . . 87
REFERENCES . . . .89
A LabVIEW VI . . . .92
A.1 LabVIEW Front Panel . . . 93
A.2 LabVIEW Block Diagram . . . 94
B Matlab Scripts . . . .95
B.1 Simulation Parameters . . . 96
B.2 Magnetic Force Approximation . . . 97
B.3 Magnetic Flux Comparison . . . 100
B.4 Experimental Results Comparison . . . 105
B.5 Optimization Simulation . . . 111
B.6 Optimization Analysis . . . 113
1.1 Power consumption of individual electronic devices that make up the land
warrior system, a personal combat system designed for soldiers [4] . . . 4
3.1 Model parameters and inputs used to simulate the power generation of linear permanent magnet generators . . . 30
4.1 Names and specifications of four stators designed and fabricated to verify Bateman’s model . . . 56
5.1 Power results from four experimental stators . . . 75
5.2 Voltage results from four experimental stators . . . 76
5.3 Frequency results from four experimental stators . . . 76
6.1 Resistance and diameter of various gauges of magnet wire [29] . . . 85
1.1 Example of Technology System Being Developed for Deployed Soldiers [1] . . 2
1.2 Power needed(W) vs. Stored energy(Wh) of various portable electronic
equipment [5] . . . 5
1.3 Ragone plot comparing energy density and power density of small scale
power sources [5] . . . 7
1.4 Ragone plot comparing energy density and power density of thermoelectric,
photovoltaic, piezoelectric, and chemical energy storage devices [6] . . . 8
1.5 Backpack with a piezoelectric actuator stack in place of bottom strap buckle [7]10
1.6 Shoe with piezoelectric generation device installed in the heel [8] . . . 11
1.7 Backpack mounted on vertical slides with a rotary electric generator [9] . . . . 12
1.8 Linear permanent magnet generator used to convert ocean wave energy to
electrical energy [13] . . . 14
1.9 Suspended pack frame featuring magnetic stacks housed in tubular frame
and stator coils enclosed in pack saddle . . . 16
2.1 Picture of an animated person taking a step, highlighting the fact that the
planted leg moves through a motion similar to an inverted pendulum [9] . . . 20
2.2 Cross-sectional view of an experimental, octagonal linear permanent
mag-net generator examined in an attempt to decrease power fluctuations and
suppress voltage harmonics in wave energy harvesting [19] . . . 22
in small electronics requiring less than 15mW of power [21] . . . 23
2.4 Diagram of a linear air-cored permanent magnet induction generator [10] . . . 24
2.5 Cross-sectional area of an iron-cored linear permanent magnet generator,
illustrating magnetic flux paths [23] . . . 25
2.6 Two views of an ion mobility spectrometer designed using LTCC by Plumlee
et al. [25] . . . 26
2.7 A flowchart depicting the typical process involved when printing circuitry
and firing 951 Green TapeT M LTCC [24] . . . 28
3.1 Original Simulink Model Developed by Bateman to Determine Power
Out-put of Generator [14] . . . 31
3.2 SolidWorks assembly of Bateman’s proposed translator next to a picture of
the experimental translator [14] . . . 35
3.3 Original Design of Coils Using LTCC and Silver Paste . . . 36
3.4 Plot of power from a generator over a period of two seconds [14] . . . 38
3.5 Plot of coupling force between stator coils and magnetic translator, as a
function of time [14] . . . 39
4.1 A resistive circuit designed to measure and calculate the generated power
from an experimental linear inductive generator . . . 43
4.2 Schematic displaying the various components of the testing apparatus and
the electrical connections to all of the components . . . 44
4.3 Schematic of a scotch yolk mechanism used to convert rotation to linear
oscillations . . . 45
4.4 SolidWorks assembly of test apparatus without controller or data acquisition
systems . . . 46
4.6 3D CAD model of testing apparatus in a fully retracted position . . . 48
4.7 Portion of LabVIEW Code Functioning as a PI Controller . . . 50
4.8 Linear Momentum of Test Apparatus as it Oscillates . . . 51
4.9 Photograph showing a frontal view of the experimental testing apparatus . . . 53
4.10 Photograph showing a rear view of the experimental testing apparatus
in-cluding the measurement circuit, control circuit, motor, and data acquisition
board . . . 54
4.11 Plot of experimental frequency as a function of time while operating at a
frequency of 2Hz . . . 55
4.12 Custom Designed Coil Winder for the Construction of Test Generators . . . . 58
5.1 Picture of Stator A . . . 60
5.2 Simulated power of Stator A with respect to time . . . 61
5.3 Measured power of Stator A over a two second time interval . . . 62
5.4 Modified Simulink simulation to reflect the physical changes in the testing
apparatus . . . 64
5.5 Experimental magnetic field strength as a function of radial distance away
from magnetic stack . . . 65
5.6 Comparison of experimental and simulated magnetic field strength as a
function of distance away from the translator . . . 67
5.7 Colormap plot of the simulated intensity of the magnetic field as a function
of position along and distance above magnetic translator . . . 68
5.8 Simulated power of stator A using adjusted Simulink model . . . 69
5.9 Comparison of generated power between the experimental data and adjusted
Simulink model results using Stator A . . . 71
5.10 Comparison of simulated and experimental voltage generated by Stator A . . 72
the power prediction of the adjusted Simulink model . . . 74
5.12 Plot of average power as a function of frequency of the four test generators . 78
5.13 Plot of RMS power as a function of frequency for the four experimental
generators . . . 79
6.1 Surface plot displaying the power output of a simulated generator with
32awg wire . . . 86
A.1 Front panel of LabVIEW program used to control, and collect data from
testing apparatus . . . 93
A.2 LabVIEW program used to control, and collect data from testing apparatus 94
Bg Flux density at distance radially outward from magnet surface (T)
ˆ
Bg Magnetic flux density at surface of magnet (T)
Br Remnant flux density of magnet (T)
cw Width of stator coil windings (m)
ch Height of stator coil windings (m)
D Duty cycle (%)
Do Initial Duty cycle (%)
F Inductive coupling force due to segment of wire (N)
Fcoil Inductive coupling force due to entire stator (N)
f Frequency (Hz)
fo Initial Frequency (Hz)
gap Distance between surface of magnet and inner radius of stator (m)
I Current (A)
J Current density (Ampm2 ) KI Integral controller constant
KP Proportional controller constant
lg Length of Air gap (m)
P Electric Power (W)
R Resistance (Ω)
r Distance Away From Magnet (m)
Ri Inner radius of stator (m)
Rm Radius of Magnet (m)
Ro Outer radius of stator (m)
Rsis Internal resistance of stator windings (Ω)
Rtot Total resistance of circuit (Ω)
V Voltage (V)
v Linear Velocity of Translator(ms) vol Volume containing stator coils (m3)
wm Width of Magnet (m)
ws Width of Steel Spacer (m)
µr Relative Permeability
CHAPTER 1
INTRODUCTION
1.1
Justification for Portable Power
As technology has developed, people have grown accustomed to the advantages of
electronic devices to improve their ability to perform certain tasks. The technology
development within the military has enabled soldiers to perform missions more safely, more
efficiently, and more reliably. Some examples of equipment that soldiers could have to carry
are: on-board computer, radio, global positioning system, thermal imaging equipment,
laser range finder, and video sights on weapons [1]. The main drawback of having such
sophisticated equipment is that it requires a power source to operate, and many missions
where the equipment is used are in remote locations where no power source is available.
Figure 1.1 displays an experimental equipment system that was developed for soldiers
to use when deployed in the field. The soldier is carrying a thermal weapon sight and
a daylight video sight on his weapon. He has a heads-up-display (HUD), and a mouse
to operate an on-board computer, which is not shown in Figure 1.1. He has a
COM-M/AV module and a microphone/speaker for communications. In addition to that extra
equipment, he is also carrying a large battery to power those systems.
Most electronic devices contain batteries to provide power for operation. Batteries are
Figure 1.1: Example of Technology System Being Developed for Deployed Soldiers [1]
available to recharge the batteries, replacements must be available to enable extended use
of the equipment. Patel-Predd found that on a three day mission, a soldier must carry
as much as 12kg (26.5lb) of batteries to power all of the equipment [2]. For soldiers on
foot, 12kgis a substantial burden to add to the other necessary supplies the mission might
require. Quesada et al. found that the the gait of a loaded subject changes when marching
under heavy loads, which could increase the risk of injury [3]. To minimize the load that
soldiers have to carry, a goal of 50% reduction in weight is put in place. Based on the
maximum battery load of 12kg, the desired weight of a portable power device should be
6kg or less.
Recreational hikers are similarly affected by the prominence of portable electronics
and a lack of power sources. Electronics usage is increasing and hikers are having to
such as two-way radios, cellular telephones, digital cameras, GPS devices, flash lights,
and various other equipment. Generally, they are in remote locations where no power
source is available, and most consumer devices have limited battery life. To extend use of
equipment, extra batteries must be purchased and carried, adding substantial weight and
cost.
1.2
Defining the Portable Power Needs
In order to develop a solution for portable power, it is important to define the amount
needed. Energy use is a wide-ranging subject based on the intended use. It is difficult to
meet all energy needs with one source of generated energy. Due to the portability required
to meet the needs of the ground soldier, the amount of energy needed is an important
constraint to consider. A successful system will have the capacity to provide energy that
the soldier needs without excess. To ensure a system will meet the energy needs without
overburdening, it needs to be designed for a precise generation capacity. To get the proper
capacity, the current energy use of personal military systems was analysed to determine
the power needs of soldiers.
Table 1.1 displays the amount of power required for various equipment used by a soldier
in the field. The table is composed of two columns. The left column lists the individual
electronic devices in the land warrior system, and the right column indicates the power
used by each piece of equipment. There are three individual categories within the system,
each of which has a subtotal power usage displayed, in addition to the total power of the
system shown in the final row. It can be seen that the entire land warrior system requires
a total of 56.7W to run all of the on-board system, however it is not likely that all systems
would be running at the same time. For example, the receive and transmit functions of the
soldier radio and squad radio are not able to be accessed at at the same time. Assuming
Table 1.1: Power consumption of individual electronic devices that make up the land warrior system, a personal combat system designed for soldiers [4]
Functional Operating Power (W) Computer/Radio Subsystem
Computer 14.800
Hand-Held Flat Panel Display 6.400
Soldier Radio Receive 1.400 Transmit 6.000 Squad Radio Receive 2.000 Transmit 12.000
Global Positioning System 1.500
Video Capture 1.000
Subtotal 45.100
Integrated Helmet and Sight Subsystem(IHAS)
Laser Detectors 0.600
Helmet Mounted Display 4.900
Imager 0.100
Subtotal 5.600
Weapon Subsystem
Laser Range finder 0.050
Laser Aiming Light 0.075
Digital Compass 0.350
Thermal Weapon Sight 5.525
Subtotal 6.000
TOTAL 56.7
Figure 1.2 is a graph showing the power requirements of various, personal, electronic
equipment. The graph displays stored energy on the horizontal axis in units of W h,
required power on the vertical axis in units ofW, and run time on the light gray diagonal
axis in units ofminandh. Markers numbered 2, 3, and 4 indicate the needed performance
to power a cell phone, 4G cell phone, and minimal wearable computer, respectively. These
are the types of device that are going to be carried by soldiers and hikers, and therefore
time of between 1h and 10h and a power requirement of 1W to 10W. The maximum
stored energy required in this range is approximately 100W h.
Figure 1.2: Power needed(W) vs. Stored energy(Wh) of various portable electronic equipment [5]
Based on Figure 1.2 and Table 1.2 it can be seen that a portable power source that
could produce 1W to 10W of continuous, dependable electric power could displace most
of the batteries that are required to run equipment used by hikers and soldiers in the field.
Various portable power generation devices exist that are meant to generate power in the
range of less than one Watt up to thousands of Watts. A Ragone plot was used to compare
density in (Wkg). The energy density is a measure of how much energy can be produced, or stored, per unit mass of the device. The power density is a measure of how much power
can be produced or stored per unit mass of a device. By comparing these two values, it
gives an idea of how much energy can be generated and how fast it can be delivered. In
order to provide power to operate or charge small electronics, it is desirable to have large
amounts of energy density with relatively small power density in order to produce small
amounts of power for long periods of time. Figure 1.3 displays a Ragone plot of power
sources considered by Dunn-Rankin et al. [5].
In Figure 1.3, the horizontal axis represents the energy density in (W hkg ) and the power density is on the vertical axis in (Wkg). Both axis are displayed in a log scale to allow a large range of sources to be shown clearly. A rectangular area has been marked, indicating the
desired region for a device to be located if it is to be used as a portable energy generation
device. The desired region spans from 2Wkg−200Wkg of specific power and from 2W hkg −200W hkg of stored specific energy. These values are based on the desired ranges of mass and power
Figure 1.3: Ragone plot comparing energy density and power density of small scale power sources [5]
Of particular interest in Figure 1.3 is the red line with square point markers, indicating
human legs. Energy scavenging from human motion is an option for power generation
that will be explored further in this thesis. The human legs curve falls within the low
end of the desired spectrum of a portable power device. Other sources that fall within
the desired range are batteries, methanol fuel cell, and mini-diesel engine. Both the fuel
cell and mini-diesel engine require an external fuel source, which adds extra weight and
possible safety hazards.
power density of thermoelectric, photovoltaic, and piezoelectric devices. The horizontal
axis displays the power density in (Wkg), the left vertical axis shows energy density in (kgJ ), and the right vertical axis shows energy density in (W hkg ). Thermoelectric and photovoltaic devices have similar power and energy densities, both falling in a range of 100W
kg −10
1W kg
power density and 100W h kg −10
3W h
kg energy density. The power density of the piezoelectric
devices is in the range of 10−2W
kg and the energy density is in the 10
−3W h
kg range. These
three devices are all energy scavenging devices that are discussed as possible portable
power sources.
Figure 1.4: Ragone plot comparing energy density and power density of thermoelectric, photovoltaic, piezoelectric, and chemical energy storage devices [6]
All of the devices discussed from Figures 1.3 and 1.4 are energy scavenging devices.
They are ideal for portable power needs because they do not require an external fuel source.
Section 1.3 goes into further discussion to examine what an energy scavenging device is,
and how a number of prospective devices will meet the power needs of soldiers in remote
1.3
Introduction to Energy Scavenging Devices
To avoid the need to pack fuel for a power generator, energy scavenging devices have
been considered as a possible portable power source. Energy scavenging devices make
use of surrounding environmental sources such as solar, wind, thermal, hydro, and kinetic
energy. Many such devices exist that were designed for applications such as providing clean
renewable power, providing power where transmission lines are expensive or unavailable,
and recuperating wasted energy to be used for meaningful work.
A number of devices that have the proper power and energy density to fill the need
of portable power are shown in Figures 1.3 and 1.4. Generators that require a separate
source of fuel would be at a disadvantage due to weight constraints and possible hazards of
certain fuel sources. Power sources that require a fuel source would require the soldier to
carry the fuel, which adds excess mass to their load, and many fuel sources pose a health
hazard from exposure. Some of the devices that fall under this category are the PEM
fuel cell, Direct Methanol fuel cell, and mini-diesel engine. These devices have desirable
power density and specific stored energy ratings, but are not practical to take into remote
locations
Photovoltaic solar panels are a popular and widely used form of energy scavenging
device. They have been in use for decades and have been proven as a good source of clean
renewable energy. In the last decade, miniature panels have been developed for use as
personal power to charge electronic devices such as cell phones, radios, digital cameras,
and various other small electronic devices. As seen in Figure 1.4, photovoltaic cells fall well
within the range of power density that is desired for this application. A large drawback to
photovoltaic cells is the need for a consistent source of sunlight to operate. Photovoltaic
cells lose efficiency in many terrains, including areas that receive minimal sunlight such as
areas with heavy trees, and in canyons where sunlight only penetrates for a short amount
on the sun inhibiting them from being used effectively unless they are left stationary.
Another form of energy scavenging uses piezoelectric devices. These are devices that
generate electricity when deformed. These devices can be small, lightweight, and produce
large peaks of voltage. There have been multiple designs, using piezoelectric technology,
with the purpose of providing personal electrical power generation to a person by
scav-enging energy out of a persons movement while they walk. Feenstra et al. [7] replaced the
buckle on a backpack strap with a piezoelectric actuator stack, so that as a person walks
with the backpack, their motion would deform the stack and generate electricity. Figure
1.5 displays the experimental set-up of Feenstra et al. The piezoelectric stack can be seen
in the inset image in Figure 1.5. This stack was put under a load that fluctuated between
approximately 55N and 100N and produced a peak power of approximately 1.5mW at a
peak of 4V.
Figure 1.5: Backpack with a piezoelectric actuator stack in place of bottom strap buckle [7]
Shenck et al. designed a scavenging piezoelectric device that mounts inside the shoe
produces power as a person transfers their load to the foot. The force of the persons load
is transmitted from the foot onto the piezoelectric plate, causing deformation of the plate,
which causes a voltage potential. Figure 1.6 shows a pair of shoes with a device installed.
A cord can be seen coming out of the back of the shoe and going into the controller
mounted on the outside of the shoe. This device generated 8.4mW of power at a peak of
44V [8].
Figure 1.6: Shoe with piezoelectric generation device installed in the heel [8]
Both Shenck et al. and Feenstra et al. did studies focused on using piezoelectric
devices for energy harvesting. Both studies provide results showing the power generation
of piezoelectric devices is on the order of milliwatts. As stated in Section 1.2, the range of
generation desired for this study is from 1W−10W, indicating that piezoelectric generators
will not provide enough power to charge personal electronics.
Another approach to energy scavenging is to use a standard electromagnetic generator
to convert mechanical energy into electrical energy via a changing magnetic flux in coils of
wire. A application of this is in auto-mobile alternators, which harness the rotation engine
crank shaft to generate electrical power to charge the auto-mobile battery.
built into a backpack frame to harvest energy from the movement of a person wearing the
device. Figure 1.7 displays the design for this backpack. The pack body is mounted to
two vertical slides that are attached to a harness worn by a person. The pack is suspended
from four springs that attach to a solid frame on the harness. By suspending the load
of the pack, it is allowed to oscillate vertically on the harness as a person moves. The
pack has a linear rack gear attached to the pack mounting plate. An electric generator is
mounted to the harness frame, with a pinion gear attached to the generator shaft. The
rack and pinion mesh to convert linear oscillations of the pack to rotary motion of the
generator shaft. As the pack oscillates, the rack gear oscillates as well, causing the pinion
gear to rotate the shaft of the generator.
Figure 1.7: Backpack mounted on vertical slides with a rotary electric generator [9]
at loads of 20kg − 38kg. The experimental apparatus weighed 5.6kg and Rome et al.
has hopes of reducing the apparatus weight to 1kg −1.5kg in future designs [9]. Of the
scavenging devices reviewed, this design is the only one that could produce enough power
to achieve the desired range of 1W −10W. The original design of Rome et al. is near the
maximum desired weight limit of 6kg as stated in Section 1.1. The system is integrated
into the framework of the backpack, therefore the size of the apparatus is not a constraint
as it will not have to be contained in the limited space of the backpack storage area.
The design of Rome et al. is very promising and has shown that it has the capability to
generate the required power to operate multiple devices at the same time. There are some
concerns related to the durability of the system of Rome et al. in military applications. The
requirement of the rack and pinion to mesh properly could create an inability to function
when subjected to physical stress. If the frame were placed under stress that caused the
generator shaft or rack to bend, the gears would cease to mesh properly. Fragility of
the system is a large concern when designing for military applications, because military
equipment will be subjected to hostile environments and be required to function properly
with abuse.
To eliminate the fragility of the gearing system within the design of Rome et al., linear
permanent magnet generators were researched as a possible replacement for the rotary
generator. This would eliminate the need to convert linear motion of the backpack to the
rotary motion of the generator shaft. It could be directly driven by the movement of the
backpack frame, eliminating the need for meshing gears. Elimination of the gear system
would also decrease inefficiencies due to friction in the gears.
1.4
Linear Permanent Magnet Inductive Generator
The system Rome et al. designed meets the criteria specified in Sections 1.1 and 1.2 for
and fragility of the rack and pinion system. In order to use a rotary generator, the motion
has to be converted from a linear translational to a rotational movement. By using a linear
permanent magnet generator, the movement of the backpack could be converted directly
to electrical energy without first going through a gear system.
Linear permanent magnet generators have been used to convert ocean wave energy into
electrical energy [10–12]. Figure 1.8 shows an example of a linear generator used to convert
wave momentum to electrical energy [13]. The system uses a buoy located on the surface
of the water that rises and falls with the waves to provide movement to the generator. A
rope connects the buoy to an actuator, commonly called a translator, that holds a stack
of permanent magnets as shown in the picture. The stator consists of sections of wound
wire that surround the stack of magnets. As the actuator oscillates within the stator, the
changing magnetic field induces a current within the coils of wire.
Figure 1.8: Linear permanent magnet generator used to convert ocean wave energy to electrical energy [13]
scaled down and built into the frame of a backpack. The generator is of simple design
and scavenges linear translational movement to create energy. The simplicity of a linear
permanent magnet generator improves durability and reduces losses when converting
mechanical energy to electrical energy.
1.5
Proposed Design
A suspended backpack energy scavenger was shown to be promising by Rome et al. [9],
but there are some concerns over the durability and efficiency of the system. A combination
of the suspended pack with linear permanent magnet generators, similar to wave energy
converters, could improve durability and reduce potential inefficiencies of the design made
by Rome et al. Figure 1.9 displays a model of the proposed design for an energy scavenging,
suspended pack with linear permanent magnet inductive generators. The generator coils
are enclosed within the pack saddle, indicated by (2), to protect them from environmental
exposure as well as physical shock. A cutaway view of the proposed linear permanent
magnet energy scavenger is shown in the inset window. The magnetic translators are
encased in the tubular frame work. The pack would be suspended by a number of springs
attached to the tubular frame that are not shown on the model. Bushings mounted in the
Figure 1.9: Suspended pack frame featuring magnetic stacks housed in tubular frame and stator coils enclosed in pack saddle
Unlike the rack and pinion system on the suspended pack frame of Rome et al. [9],
a linear generator would not be externally mounted. The magnets and coils would be
contained within the frame, protecting it from elements such as sand, water, dirt, and
mechanical shock. By containing it inside the framework, the system would be more
resistant to deformation of the tubular rails. As long as the pack frame is capable of
oscillation, the generator would still function. With an exposed gear train, if the rack was
moved or bent, the gears could bind and prevent relative movement. Without relative
movement, the generator shaft would cease to spin, in turn causing the magnetic flux
to stay constant, and no power would be generated. A linear generator could decrease
inefficiencies in the system by eliminating a geared power train. While gearing provides
the ability to increase speed or torque delivered to the rotary generator, it also produces
power losses through the friction in the gear train. With an enclosed, lubricated system,
power losses can be large. Using a linear magnetic generator in a suspended backpack
system similar to that of Rome et al., would simplify the system, improve efficiency and
reliability, and increase energy conversion efficiency.
1.6
Thesis Layout
This thesis details the process of modelling, designing, fabricating, and experimentally
testing a linear permanent magnet generator, designed to be used in a suspended frame
backpack. The suspended frame backpack concept is based on the design made by Rome
et al. [9]. For this proposed design the rotary generator would be replaced with a linear
inductive generator to minimize power loss, increase reliability, and decrease complexity
of the system.
Bateman [14] proposed a generator model by developing a mechanical vibration model
based on base excitation to simulate the motion of the backpack, and adopting a magnetic
model proposed by Baker [15]. The model used the Simulink software package to simulate
the power output of the system. Using the model as a guide, a generator was designed. The
Bateman model yields design parameters for the coil and magnet geometry. This thesis
is designed to experimentally verify the model developed by Bateman, test the generator
designed by Bateman, and propose an optimal linear generator design based on the results.
Chapter 3 presents the Bateman model [14] adopted from Baker [10]. Baker developed
relations to predict magnetic flux radially away from the translator and force per coil,
which are presented and discussed. The Simulink simulation developed by Bateman is
presented and explained as well.
After the theoretical model is presented, the design and fabrication of a testing
appa-ratus and experimental generators is discussed in Chapter 4. The design discussion covers
theory and modelling the testing apparatus, power measurement circuit, and experimental
apparatus are briefly discussed. The techniques and materials used to build the generators
is discussed in detail to explain the analysis incorporated within the design.
Following the design of the system, experimental results are presented in Chapter
5. The power generation of experimental generators are compared to the simulated
values of the Bateman model to verify the accuracy of the model. Various designs are
tested for power and voltage output of the generators. The generated power of the
experimental devices is used to make comparisons for validation of Bateman’s model, while
the experimental voltage is tested as an important parameter to determine practicality of
miniature linear generators.
The conclusions and proposal of future work are presented in Chapter 6. The validity of
Bateman’s [14] model designed for predicting power of linear permanent magnet generators
is presented in this chapter and is based on the results of Chapter 5. The practicality of
a linear generator used in a backpack frame to operate personal electronic equipment is
shown. Finally, an optimal generator design is presented, and a proposal of future work
CHAPTER 2
BACKGROUND
The problem of generating power in remote areas has been outlined, and a proposed
solution was presented. This chapter presents an overview of research conducted in the
fields of walking gait kinematics, wave energy converters, and low temperature co-fired
ceramics to support the development of the proposed solution. The research presented in
this chapter shapes the design constraints, generator geometries, and preferred fabrication
materials and methods used in this thesis.
2.1
Kinetics of a Typical Walking Gait
A simple model of a person’s walking gait was developed by Saunders et al. [16].
Saunders et al. models the motion as if the leg of the foot planted on the ground were an
inverted pendulum. When a person walks, they plant their foot on the ground, push their
body up, and pivot over the foot. The other foot then gets planted as their body swings
past the originally planted foot. Figure 2.1 show an illustrated picture of a person taking a
step, highlighting the motion of the planted leg. The arrows depict the direction of travel
of the person. An arc is outlined, by the dotted line, which represents the motion of the
hip of the person as they move through the process of one step. The vertical displacement
Figure 2.1: Picture of an animated person taking a step, highlighting the fact that the planted leg moves through a motion similar to an inverted pendulum [9]
By using inverted pendulum model, a sinusoidal motion of a person’s, and in effect the
backpack’s, center of mass is achieved. This provides a convenient way to approximate the
motion of a suspended backpack and was adopted by Rome et al. [9] and Bateman [14] for
modelling a suspended energy scavenging backpack. The stepping frequency of a person
walking is in the range of 1.7Hz−2.3Hz [9, 17]. The vertical displacement of an average
person as they take a step is considered to be 4cm−7cm [9, 18]. The frequency of 2Hz
and a vertical displacement of 1in (5cm) were used in the modelling and testing of the
generators.
2.2
Wave Energy Converters
In order to directly harness energy from the motion of the oscillating backpack, a
conversion uses this type of generator to convert the energy from waves in the ocean into
usable electricity as shown previously in Figure 1.8. Most consist of a buoy connected to
a magnetic translator. The magnets are surrounded by a series of generators composed of
wrapped, electrically conductive wire, denoted as the stator or stator coils. As the waves
rise and fall, the buoy causes the translator to oscillate through the stator coils. As the
translators move, the magnetic flux within each stator coil changes due to the relative
motion between the two components. The changing magnetic flux couples with the wire
and causes current to flow through the wire.
There is much research being invested in developing this technology because there
is a large movement to develop energy sources that use fuel sources other than fossil
fuels. Ivanova et al. described an octagonal shaped linear permanent magnet generator to
decrease power fluctuations and suppress voltage harmonics [19, 20]. Figure 2.2 displays
a cross-sectional view of one proposal of an octagonal shaped linear permanent magnet
generator. The translator is made up of eight rectangular magnets inside of the stator
coils. The windings on the stator coils are wound parallel to the face of the magnet in a
Figure 2.2: Cross-sectional view of an experimental, octagonal linear permanent magnet generator examined in an attempt to decrease power fluctuations and suppress voltage harmonics in wave energy harvesting [19]
Wang et al. [21] modelled and prototyped a miniature, 15mW generator for use in small
electronics such as “self-winding” watches. A prototype of the device made by Wang et al.
is shown in Figure 2.3. The translator can be seen in the upper-right potion of the picture,
the stator coils are housed in the disk located nearest to the ruler. This device is designed
to produce 15mW of power when running at 6000rpm. This is a rotary generator but
is based on a similar concept to the linear wave generators through its ability to harness
Figure 2.3: Prototype of a miniature permanent magnet generator used for applications in small electronics requiring less than 15mW of power [21]
Danielson et al. and Baker et al. have have described linear generators that are
fundamentally similar to the proposed generator of this thesis, but are much larger in
scale [10, 11, 13, 15, 22]. These papers explore various configurations and modelling
techniques of linear permanent magnet generators. Of particular interest are Danielsson’s
and Baker’s work on air-cored permanent magnet tubular linear generators [10, 13]. Figure
2.4 displays the generator in a linear air-cored induction generator. The isometric picture
in the upper-left corner is a view of the magnetic stack and coils together. The stator coil is
label in the picture as a large white ring surrounding a stack of alternating white and black
disks. The windings of wire are located within the ring. The diagram at the bottom of
the image shows a cross-sectional view of the magnetic translator. The translator consists
of alternating magnets and steel spacers stacked on a center shaft, as indicated by the
alternating black and white disks in Figure 2.4. Four small arrows, and the N and S
symbols denoting north and south power, are located on the surface of each magnet in the
diagram near the bottom of the image. These arrows indicate the direction of the magnetic
reversed. The curved arrows at the boundary of the stack are representative of the shape of
the magnetic field. The device geometry is characterized by several dimensions, including:
Wm is the magnet width, Wp is the spacer width, Ri is the inner radius of the stator coil,
andRo is the outer radius of the stator coil. During operation, the translator will oscillate
back and forth through the stator coil. The magnetic field inductively couples with the
conductive wire in the stator and causes current to flow through the wire.
Figure 2.4: Diagram of a linear air-cored permanent magnet induction generator [10]
Linear generators generally have an iron, or steel, sleeve encompassing the stator coils
to create a consistent magnetic field along the entire width of the stator coils. A system
ferrous metal surrounding the coils will polarize with the magnet in the translator, which
has a conditioning effect of the magnetic field. A cross-sectional view of a linear generator
with a steel sleeve is shown in Figure 2.5. The steel sleeve is labelled stator steel and is
located on the opposite side of the stator coils from the magnet. The flux paths are shown
as a solid line running through the magnets between the wires and through the stator steel.
The flux paths are shown going in a nearly straight path from the magnet to to the stator
steel, illustrating the conditioning of the field. The dashed red line indicates the magnetic
path with no steel surrounding the stator. When no steel is present, the generator is
called an air-cored generator. The strength of the magnetic field of an air-cored generator
weakens as it gets further from the magnet. The field strength of the iron-cored generator
is constituent of the entire breadth of the coils.
Figure 2.5: Cross-sectional area of an iron-cored linear permanent magnet generator, illustrating magnetic flux paths [23]
The air-cored design is less widely used, but is desirable for a suspended backpack
generator because it will have less mass than a traditional iron-cored generator. As
the backpack will be carried by a person and scavenging energy from their muscles, a
generate as much electricity as the iron-cored.
2.3
Low Temperature Co-Fired Ceramic
The generator will be subjected to harsh environments that could cause failures to
sensitive electrical equipment. Low temperature co-fired ceramic (LTCC) is a material that
could be used to build the stator coils to provide added durability and coil density. LTCC
is provided in thin sheets purchased from DuPont. LTCC 951 Green TapeT M is composed of alumina, low temperature glass, and an organic binder [24]. While in the green, unfired
state, the LTCC materials can be machined and printed with electrical circuit elements.
The LTCC sheets can be connected through layers by way of vias, which are vertical holes
through layers of LTCC. The vias are filled with conductive material. Figure 2.6(a) shows
a layer of LTCC with printed circuitry, including vias to connect consecutive layers. The
light gray line that curves down the left side of the disk is electrically conductive paste
that has been applied to the surface of the LTCC layer, the four light gray, round, pads
indicate vias that provide electrical connections between the layers.
(a) Sample of printed LTCC showing printed cir-cuitry and embedded equipment
(b) Multiple layers of an ion mobility spectrome-ter being collated using two guide pins
By developing the stator coils with printed and layered LTCC materials, the generator
would be more resistant to natural elements and frictional wear. When the system of
printed LTCC layers is fired, the low temperature glass within the ceramic melts and
fuses between the separate layers, merging them into one single piece of material, thus
providing a hermetically sealed generator [24]. This provides protection from water, sand,
and any other element that might be encountered while installed in a backpack. While in
the field, it is possible that the frame could get deformed, which could cause rubbing to
occur between the magnets and stator coil. The ceramic would be able to withstand the
rubbing without concerns of the wires becoming exposed.
The fabrication process is shown in Figure 2.7. As can be seen, the start of the process
is forming the blank and preconditioning it. Preconditioning consist of cutting the sheets
of LTCC into the correct size and shape, installing any embedded hardware, as seen in
the center of the disk in Figure 2.6(a), and cleaning the surface to ensure no debris is on
it. After preconditioning, it is recommended that the via holes are created on all layers.
After vias are formed, they should be filled with conductive material, then the conductive
circuit should be printed on the surface of all layers of the ceramic. The next step is to
collate and laminate the layers of ceramic. The layers are aligned using guide pins as
seen in Figure 2.6(b), then they are laminated at a pressure of approximately 20000kP a.
After lamination, the stack of LTCC is then fired in a furnace at 850C◦ for 20 minutes.
The last step in the process is post-fire processing, which includes connecting electrical
CHAPTER 3
DESCRIPTION OF THEORETICAL MODEL AND
PRELIMINARY RESULTS
Bateman began the development of an energy scavenging suspended backpack with
linear inductive generators. She proposed a stator coil and magnetic translator design,
developed an analytical model to predict the performance of the system, and developed
an analytical model to predict the power produced by the system [14]. Much of the coil
design and analytical model were adapted from the work of Baker [15], Wang [21], and
Baker et al. [10] on design of tubular air-cored permanent magnet generators for marine
energy converters. The mechanical model was based on a base excitation vibrations model
developed by Bateman [14].
3.1
Simulink Power Model
3.1.1 Mechanical Model
A Simulink model, shown in Figure 3.1, was developed by Bateman to determine the
maximum power output of a miniature linear permanent magnet generator [14]. The model
predicts the kinetic energy of the system, and the resistive force applied by the induced
magnetic field of the stator coils. The input was set using a MATLAB script that Bateman
The parameters and model inputs are defined via a MATLAB script, which must be
run before the simulation is initiated. The parameters of the system are shown in Table
3.1.
Table 3.1: Model parameters and inputs used to simulate the power generation of linear permanent magnet generators
Parameters Inputs
Spring Constant Oscillation Amplitude Friction Damping Oscillation Frequency
Load Mass Load Acceleration
With the given parameters, the model calculates the net force on the backpack and the
relative velocity of the backpack. To calculate the net force on the backpack, the resistive
force of the induced magnetic field in the stator coils, referred to as the magnetic coupling
force, is required. A function, adapted from Baker [15], calculated the force from the
stator coils based on the relative velocity of the backpack and the position of the stator
with respect to the translator. The velocity, backpack mass, and magnetic coupling force
are then used to calculate the instantaneous power generated by the stator coil and kinetic
energy of the system. The magnetic coupling force, instantaneous power generated by the
Figure 3.1: Original Simulink Model Developed by Bateman to Determine Power Output of Generator [14]
This model uses 2Hz walking frequency and 5cm vertical displacement of load as
parameters. It also requires inputs that were presented in Chapters 1 and 2, which are
listed as follows:
Weight of the pack (28kg) Linear spring constant (8000Nm)
Friction damping coefficient (189.315kgs )
The spring constant and damping coefficient were values determined by Bateman [14] to
yield optimal relative velocity of the backpack with respect to the person.
The model performs calculations over a time interval of 5s with a time step of 10ms.
The magnetic force, spring force, and friction force are used to calculate the net force on
the system, as can be seen by the feedback loops shown in Figure 3.1. The main function
of this model is to predict the maximum power output of a given linear inductive generator
that they are carrying. Being able to input a given generator, backpack loading, speed
of movement, and predict the power provides a method that can be used to design an
optimal generator for a range of conditions that could occur in real-world applications.
3.1.2 Magnetic Coupling Between Translator and Stator Coils
The magnetic force is based on Baker’s work in modelling a tubular air-cored linear
permanent magnetic generator to scavenge energy from the motion of waves in the ocean
[15]. Of specific importance are the equations used to calculate the magnetic force of
the stator due to inductive coupling between the wire and the permanent magnets. The
MATLAB function in the Simulink simulation, shown in Figure 3.1, uses these equations
to approximate the force on the translator from the induced magnetic field in the stator
coils. The calculations done in the MATLAB function are presented in Equations 3.1
through 3.6. The coupling force produced by a segment of stator wire per unit volume
is given by 3.1. The force is a function of the current density (J), equivalent magnetic
flux density (Bg), and geometry relationship between the stator and translator. Solving
Equation 3.1 for force and integrating over the volume of the stator coils yields the force
per stator as shown in Equation 3.2 where a stator is considered to be a single generator
consisting of a series of coils, wrapped in the same direction.
F
vol =J Bge
−r+Rm
lg (3.1)
Fcoil =
Z 2π
0
Z Ro
Ri
Z Cw 0
JBˆge
−r+Rm
Where: V ol Volume of space stator coils occupy (m3)
J Current density (Ampm2 ) ˆ
Bg Maximum magnet flux density at surface of translator (T)
r Radial distance from translator (m)
Rm Radius of ring magnet (m)
lg Length of air gap (m)
Ro Outer radius of stator coils (m)
Ri Inner radius of stator coils (m)
Cw Width of coil windings within stator (m)
Baker [15] developed a relationship to approximate the magnetic flux experienced by
the entire volume of the stator coil without having to use finite element analysis to predict
the decrease in magnetic field. Equation 3.3 calculates a theoretical maximum surface flux
density that can be used to approximate the magnetic flux experienced by the stator coils.
It is based on the geometry of the stator coil, magnets, and steel spacers.
ˆ Bg =
πBrRmwm
2µrRm(Wm+Ws) +πWmWs
(3.3)
Where: Br Remnant flux density of the magnet (T)
Wm Width of ring magnet (m)
µr Relative permeability
Ws Width of steel spacer (m)
The actual flux density varies along the longitudinal axis of the translator surface.
longitudinal position of the stator with respect to the translator in meters.
Ba = ˆBgsin
πx Wm+Ws
(3.4)
To approximate the peak current density, Bateman developed Equation 3.5 [14]. It is
dependent on the geometry of the stator, resistance of the wire, and relative velocity of
the backpack with respect the person. This relationship is used to predict the amount of
current per unit area that will be generated by the stator.
J = vL 2
pBae
−r+Rm lg
RsisV ol
(3.5)
Where: v Instantaneous velocity of translator (ms) Lp Path length of wire within stator (m)
Rsis Internal resistance of stator coils (Ω)
Substituting Equations 3.3, 3.4, and 3.5 into Equation 3.2 and integrating it yields
an equation that was used to calculate the coupling force per coil, which is displayed in
Equation 3.6. This is the output of the MATLAB function in the Simulink simulation that
was developed by Bateman.
Fcoil =
πCwvL2pBa2lg
2Ri+lg−(2Ro+lg)e
−2(r+Rm)lg e−
2gap lg
2RsisV ol
(3.6)
3.2
Stator Coil Design Proposed by Bateman
Bateman [14] proposed a design for a miniature translator and stator coil, which was
adapted from work done by Baker [15]. The translator is composed of a series of ring
Figure 3.2 displays an experimental translator on the left and Bateman’s SolidWorks model
representing the translator on the right [14]. The red disks in the SolidWorks model
indicate the north pole of the magnets and the blue disks represent the south pole. The
magnets and steel spacers have a 2.54cm outer diameter, a 0.79cm inner diameter, and
0.63cm thickness.
Figure 3.2: SolidWorks assembly of Bateman’s proposed translator next to a picture of the experimental translator [14]
Bateman proposed a stator coil design and simulated it using the Simulink power
model [14]. Bateman designed and fabricated this coil using LTCC as a substrate, and
silver paste as the internal conductor. The stator coils were 1.12cm wide, had an inner
radius of 1.29cm, and an outer radius of 2.37cm. The coil contained 480 windings and was
predicted to have an internal resistance of 10Ohms.
Figure 3.3 shows the LTCC coil design. The large blue disks represent layers of LTCC
and the silver paste is shown as silver spirals on the disks. During fabrication of the
stator, the LTCC disks would be pressed and fired to create bonds between the layers.
3.3
Model Results
Bateman [14] simulated the proposed generator to predict the power generation of the
system, and the coupling force of the stator coil. The generated power and the coupling
force were saved and analysed using MATLAB to determine, qualitatively, if the simulation
provided a good approximation. The simulation approximated 2sworth of data to ensure
any steady-state operation of the generator.
Figure 3.4 is a plot of the power that was predicted from the simulation of Bateman’s
proposed generator. The plot shows instantaneous power (W) as a function of time
(s). This plot displays the absolute value of the power while in a real system this type
of generator would produce alternating current. The peak amplitude of the power is
approximately 4.5W −5W. The plot contains seven cycles of data made up of four power
spikes. Each group of data peaks represents half a period of movement of the backpack.
Transient responses can be seen in the first half second of data, denoted by the changing
amplitude of the signal. After the transient response dies out, the amplitude of the cycles
are constant, which illustrates steady-state.
The middle peaks of each cycle have the largest amplitude because the velocity of
the system is at a maximum at the center of the oscillation. Starting at the bottom of
its movement, the backpack will accelerate upward, reaching a maximum velocity at the
midpoint of the oscillation. As the pack moves through the midpoint of oscillation, it loses
velocity, coming to a stop at the top the oscillation. The changing amplitude of power
within each cycle reflects the velocity change of the backpack because the energy generation
of an inductive generator is dependent on changing magnetic fields. More energy will be
produced as changes in magnetic flux increase. At the start and finish of each period of
oscillation, the velocity of the backpack goes to zero. Without motion in the backpack, the
stator experiences no change in the magnetic flux. This is reflected as the valleys, where
Figure 3.4: Plot of power from a generator over a period of two seconds [14]
The change in velocity is displayed by the changes in power magnitude but the harmonic
nature of the signal is due to polarity changes of the magnets. The oscillation of power
generation within each cycle is due to the reversed polarity of each consecutive set of
magnets. At the center of each pole, the power will approach zero because all of the
magnetic flux will be parallel to the motion of the generator, causing the stator coils to
experience no change in magnetic flux. When the pole change approaches the stator, the
power spikes because the magnetic field is perpendicular to the stator coils, causing large
changes in magnetic flux through the coils.
Bateman analysed the coupling force of the stator coils to determine if it would add a
significant burden to a person using the device. Figure 3.5 show a plot of coupling force.
The force is shown on the vertical axis in Newtons and time is shown on the horizontal
axis in seconds. This plot shows similar qualities to Figure 3.4 such as cycles of force
changing polarity. The peak amplitude of the coupling force is 15N. The magnitude of
the magnetic coupling force alternates between positive and negative in each cycle, which
is indicative of the changing motion of oscillation.
Figure 3.5: Plot of coupling force between stator coils and magnetic translator, as a function of time [14]
The force show in Figure 3.5 is due to the magnetic field in the stator coils generated
when current flows through the wire. This force is important because if it becomes greater
than the force from the weight of the load, the pack will cease to move independent of
the person. If the backpack is unable to move relative to the person, no energy will be
generated. Another concern is that as force increases the generator will draw increasingly
larger amounts of energy and fatigue the person using the device. The combination of
the magnetic coupling force and the weight of the device is desired to be under 58.86N to
attain the desired weight reduction presented in Section 1.1.
predicted data that agreed with the physics of the system. It captured the changing
polarity of the magnets in the translator and the changing velocity of the backpack relative
to the user. It was designed to predict the power generated from the tubular air-cored
linear permanent magnet generator and would not be useful in predicting power generation
for other linear generators. A qualitative comparison of the model results to experimental
data was not performed by Bateman. Chapter 4 details the design and fabrication of an
experimental testing apparatus, as well as experimental stator coils, to be used in the
CHAPTER 4
DESIGN AND FABRICATION OF TESTING APPARATUS
AND GENERATORS
In order to accomplish the validation of the model, a test stand, and experimental
generators were designed and fabricated. Constraints were of the translator and stator
coils were presented in Chapter 3. A testing apparatus was designed based on a system
that oscillates at a specific frequency and has a set amplitude. A measurement circuit
was developed to provide optimum resistance to obtain maximum power transfer from the
stator coils. The input of the testing apparatus consists of the forcing frequency of the
oscillations, amplitude of oscillations, and magnitude of load resistance.
4.1
Parameters Used to Develop Testing Methods for Model
Validation
A standard testing process was designed to obtain experimental results that would be
used to determine the validity of the Simulink model. Power was the most important
variable to be tested. A resistive circuit was designed to measure the voltage of the
generator and calculate the dissipated power. The experimental results are compared with
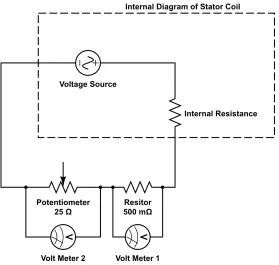
output from Bateman’s model to validate the accuracy of the model. Figure 4.1 shows
a power source and three resistances. The three resistances correspond to the internal
resistance of the generator, a resistor with a constant resistance (500mΩ Resistor), and
a variable resistor (25Ω Potentiometer). A dash block encloses the section of the circuit
corresponding to the stator coil. The internal resistance causes a loss of power through the
coils, leaving the usable generated power to be dropped across the 500nΩ resistor and the
potentiometer. Voltage measurements are taken across the two external resistors, enabling
the power and current to be calculated. By placing two resistors in series, it allowed the
resistance of the potentiometer to be calculated based on the current flowing through the
500mΩ resistor. This was determined to be the most accurate method of measuring the
resistance of the potentiometer.
It was important to accurately measure the resistance of the potentiometer to ensure the
maximum power generation of the generator. The maximum power generation occurs when
the load resistance is equal to the internal resistance of the generator. The potentiometer
was used to vary the load resistance to ensure it was equal to the internal resistance.
The magnetic flux was an important constraint in experimentally determining the
power generation capacity of the device. The coupling force used to calculated the
generated power is a function of the magnetic flux. To ensure the approximation developed
by Baker, an AlphLab Inc. DC MAGNETOMETER was used to map the maximum field
strength of the translator from the surface to 35mmradially outward from the magnets. By
comparing the measured field with the approximations made based on Baker’s work, it will
indicate if the Simulink model is reliably predicting the magnetic flux that is experienced
by the stator coils [15].
In order for the system to be viable, a minimum peak voltage of 3V is desirable. The
generated alternating current will need to be rectified to be stored in a battery. A common
method of rectification consists of passing the current through a forward bias diode, which
Figure 4.1: A resistive circuit designed to measure and calculate the generated power from an experimental linear inductive generator
a voltage drop to activate the diode. If the generated voltage is close to or less than the
voltage needed to activate the diode, all of the power will be dissipated in the rectification
process and will not be available for use.
In order to obtain accurate comparisons, the testing apparatus needs to drive the
oscillation of the system at the same frequency as the model. To accomplish this, a control
system was developed to force a 12V DC motor to operate at a user-chosen angular velocity
that corresponded to the required frequency. The controller was developed using LabVIEW
software, an H-Bridge, and a National Instruments USB-6211 data acquisition board. A
testing apparatus and coils were designed and built based on the given requirements and
deliverables. The materials and designs are discussed further throughout the remainder of
4.2
Test Stand
4.2.1 3D Modelling and Description
An apparatus was designed to simulate the motion of a the suspended backpack, which
is excited by the vertical travel of the wearer while walking. The testing apparatus contains
a magnetic translator, stator coils, a drive system, a speed controller, and a data acquisition
system. A schematic of the testing apparatus and connections is displayed in Figure 4.2.
The computer runs a LabView simulation, which has three purposes. Its first purpose is
to collect the voltage across the resistors and calculate the dissipated power. The second
is to collect data from a quadrature encoder on the motor to determine the frequency of
the oscillations. The last function is to use the measured angular velocity of the motor as
an input to a PI controller, which then outputs a duty cycle to the data acquisition board.
The data acquisition board interprets the duty cycle and pulses an H-bridge on and off to
control the frequency of the motor via pulse width modulation.
The motor shaft is connected to a scotch yolk mechanism used to turn rotation into
harmonic linear oscillation. Figure 4.3 is a schematic depicting the operation of a scotch
yolk mechanism. The motor shaft connect in the center of the scotch yolk, and the
translator is connected to the oscillating bar. The stator is mounted to the base of the
testing apparatus to constrain it from moving as the translator oscillates. Conductive
leads are connected from the stator coils to the measurement circuit as depicted in Figure
4.2. The measurement circuit has leads on either side of the two resistors that connect to
terminals on the data acquisition board, allowing the measured voltage to be sent to the
computer.
Figure 4.3: Schematic of a scotch yolk mechanism used to convert rotation to linear oscillations
Figure 4.4 shows an isometric view of a 3D CAD model of the testing apparatus.
The two black sections represent linear bearings of the scotch yolk mechanism. The
magnetic translator is indicated by the alternating white, red, and blue disks attached
to the large horizontal bearing. The blue disk located at the end of the L shaped support
and surrounding the magnetic translator is the stator coil. As the apparatus moves, the
the fixture.
Figure 4.4: SolidWorks assembly of test apparatus without controller or data acquisition systems
Figures 4.5 and 4.6 display the apparatus at the two extreme positions of translation.
The blue highlighted disk represents the scotch yolk that works in unison with vertical
and horizontal bearing to convert the rotary motion of the motor into linear motion. The
two positions indicated display the peak displacement where velocity goes to zero and the
apparatus begins moving in the opposite direction. The scotch yolk is highlighted and
labelled, as is the point of connection between it and the linear bearing. The offset from
Figure 4.6: 3D CAD model of testing apparatus in a fully retracted position
4.2.2 Materials and Fabrication
The base of the testing apparatus, as well as the mounting brackets, are made primarily
from aluminium and were custom fabricated on the campus of Boise State University. The
two bearings are comprised of Parker linear slides. The custom fabrication was completed
using a combination of a CNC mill and a manual lathe. The motor used to drive the motion
is a Pololu 67:1 Metal Gear motor with a 64 count per revolution encoder connected to
![Figure 1.1: Example of Technology System Being Developed for Deployed Soldiers [1]](https://thumb-us.123doks.com/thumbv2/123dok_us/8923586.1844020/17.612.212.441.50.332/figure-example-technology-developed-deployed-soldiers.webp)
![Table 1.1: Power consumption of individual electronic devices that make up the landwarrior system, a personal combat system designed for soldiers [4]](https://thumb-us.123doks.com/thumbv2/123dok_us/8923586.1844020/19.612.142.504.94.481/consumption-individual-electronic-devices-landwarrior-personal-designed-soldiers.webp)
![Figure 1.2:Power needed(W) vs.Stored energy(Wh) of various portable electronicequipment [5]](https://thumb-us.123doks.com/thumbv2/123dok_us/8923586.1844020/20.612.150.500.91.494/figure-power-needed-stored-energy-various-portable-electronicequipment.webp)
![Figure 1.3: Ragone plot comparing energy density and power density of small scale powersources [5]](https://thumb-us.123doks.com/thumbv2/123dok_us/8923586.1844020/22.612.119.535.53.415/figure-ragone-comparing-energy-density-power-density-powersources.webp)
![Figure 1.4: Ragone plot comparing energy density and power density of thermoelectric,photovoltaic, piezoelectric, and chemical energy storage devices [6]](https://thumb-us.123doks.com/thumbv2/123dok_us/8923586.1844020/23.612.120.531.262.494/figure-ragone-comparing-density-thermoelectric-photovoltaic-piezoelectric-chemical.webp)
![Figure 1.5: Backpack with a piezoelectric actuator stack in place of bottom strap buckle [7]](https://thumb-us.123doks.com/thumbv2/123dok_us/8923586.1844020/25.612.163.487.346.581/figure-backpack-piezoelectric-actuator-stack-place-strap-buckle.webp)
![Figure 1.7: Backpack mounted on vertical slides with a rotary electric generator [9]](https://thumb-us.123doks.com/thumbv2/123dok_us/8923586.1844020/27.612.145.509.301.607/figure-backpack-mounted-vertical-slides-rotary-electric-generator.webp)
![Figure 2.2: Cross-sectional view of an experimental, octagonal linear permanent magnetgenerator examined in an attempt to decrease power fluctuations and suppress voltageharmonics in wave energy harvesting [19]](https://thumb-us.123doks.com/thumbv2/123dok_us/8923586.1844020/37.612.196.446.55.319/sectional-experimental-octagonal-permanent-magnetgenerator-uctuations-voltageharmonics-harvesting.webp)
![Figure 3.5: Plot of coupling force between stator coils and magnetic translator, as afunction of time [14]](https://thumb-us.123doks.com/thumbv2/123dok_us/8923586.1844020/54.612.164.477.133.397/figure-plot-coupling-force-stator-magnetic-translator-afunction.webp)