GUEST EDITORS
F. A. Clive Wright
A,D, Anthony S. Blinkhorn
Band Vahid Saberi
CACentre for Oral Health Strategy, NSW Department of Health
BFaculty of Dentistry, University of Sydney
CPopulation Health, Planning and Performance, North Coast Area Health Service
DCorresponding author. Email: [email protected]
NSW PUBLIC HEALTH
BULLETIN
ISSN 1034 7674
Oral health in NSW
Improved oral health information for NSW
Oral health services are an integral part of the New South Wales (NSW) health care system.1A population approach to the prevention of dental decay through water fluoridation and a systematic prioritisation of access to public dental health services on the basis of need have been the founda-tions of policy and provision of oral health services in NSW for more than half a century.
Oral health information collected on a population basis is used for a variety of planning purposes: monitoring trends and patterns in oral health and disease; assessing treatment needs across populations; identifying and prioritising imple-mentation programs; and evaluating the outcomes of pro-grams and approaches. Planning information is collected in various ways: randomised monitoring surveys either of the clinical status of populations or their use and perceptions of oral health and oral health services; aggregate routine data collected from service users; service-mix profiling from either questionnaire surveys or routine data collection analyses; special ad hoc surveys which investigate specific population groups or geographical areas; and longitudinal evaluation of specific programs and intervention regimens.2 No single method provides the full picture of a population’s needs, expectations or priorities, but each approach contributes significantly to providing more comprehensive evidence to underpin public policies and decision-making.
Policy changes and implementation of innovative approaches to prevention and provision of oral health services must make best use of limited resources and be based on sound evidence and research evaluation. Changes are occurring in the directions for prevention and service delivery in NSW,
led largely by national and state strategic planning and funding opportunities. These developments must be evaluated against best practice and best investment opportunities in public oral health provision.3–5
This special issue of the Bulletin provides the most recent objective oral health information on the people of NSW. It builds upon the previous National Oral Health Survey of Adults of 1987–88, data collections from School Dental Service compilations dating back to the 1970s and the recent collaborative research with the Australian Research Centre for Population Oral Health.6–8
Between 1996 and 2000, NSW adopted a screening approach to reporting the prevalence and severity of dental decay in chil-dren. The Save Our Kids Smiles (SOKS) program systemati-cally under-reported the extent of dental caries in NSW children.9Further, the introduction of a more targeted school dental service program in 2001 only collected information from school children at designated schools within disadvan-taged populations, and only reported oral health data on those children who required dental treatment. Con sequently, since 2001, with the lack of representative clinical data, oral health information on NSW children has not been included in national datasets by the Australian Institute of Health and Welfare.10The randomised selection of schools and children for the current child dental survey is thus a milestone in NSW and Australia. Rather than relying on routine data collection from an increasingly biased sample of public service users, this current survey provides a more representative sample on which to base sound future goals and targets. The child dental survey described by Phelan et al. in this issue of the Bulletin
38 | Vol. 20(3–4) 2009 NSW Public Health Bulletin
also provides adequate numbers of children in the key age groups, 5–6 years and 11–12 years, for area health service level monitoring and planning. This too is the first time such information has been available for rational local planning purposes.
There are gaps still in the objective randomised oral health data available. For example, the age ranges in the child dental survey do not include preschool children, some adolescent groups and populations with special needs. However, the data now available for NSW children 5–12 years of age are of sufficient dimension and robustness to provide area health services and the NSW Department of Health with strong markers for child oral health status. Changes can be measured against such markers as decay experience and enamel fluorosis as both population-based and specific preventive programs and different service modalities are implemented.
The Child Dental Health Survey also confirms the need for policy and planning directions to focus on reducing inequalities in oral health. A more complete picture is emerging on who and where the most advantaged children are with respect to oral health gains. This complete overview raises the question of what oral health services can do to address the determinants of this inequality and what they can do to provide a better framework for inter-vention programs.
Sivaneswaran’s analysis of the adult oral health survey findings in NSW show that NSW data are consistent with trends across Australia.8In many aspects, the NSW popu-lation has achieved a higher level of oral health gain (for example, lower than average rates of total tooth loss) since the previous adult oral health survey than Australia overall. Again, however, it is the inequity in both access to dental services and the oral health outcomes that are the striking findings. The question the findings pose is how can we reduce the higher burden of oral diseases carried by those on low-incomes, those living in rural and remote NSW, and those without private dental health insurance.
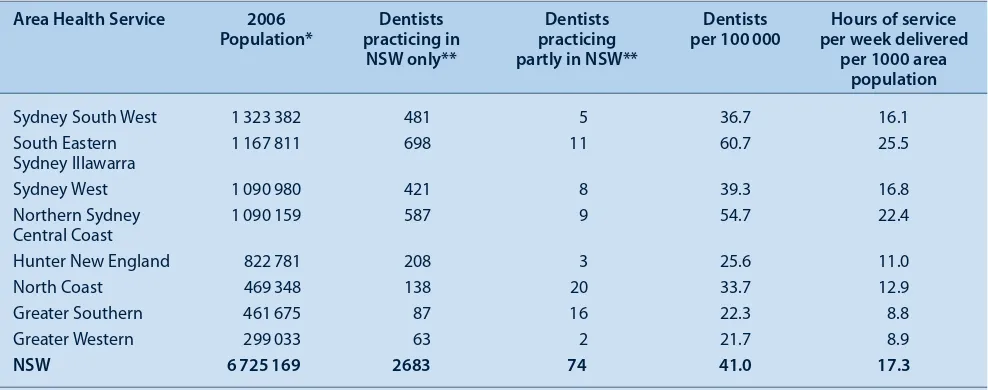
The paper by Skinner et al., also published in this issue of the Bulletin, provides an insight into the oral health work-force in rural NSW and current initiatives that aim to meet the challenges of access, especially for rural and low-income communities.
Unlike the child dental survey, the NSW section of the adult oral health survey does not provide a sufficiently large sample to break down the oral examination informa-tion by area health service. There is therefore an ongoing need to both complement the data already gained with additional ad hoc surveys and establish a cycle of repeat randomised oral epidemiological surveys. However, the representative nature of the data collected at the state level, and their use in a sound and exploratory fashion, provide
one of the first opportunities in NSW to evaluate exactly how well the NSW oral health system has been moving toward its stated strategic goals and objectives: for example, assessing the levels of oral health gain; setting reasonable targets for the next decade; identifying equity issues that have been disclosed to permit policy changes to reshape investment; recognising which efforts are required to reduce inequalities in access to dental services and oral health outcomes; and determining which public-private partnerships could be considered to find better geograph-ical distributions to access problems.
Clinical oral health data collected through randomised surveys do not exist in a vacuum. Highly valuable infor-mation collected through the NSW Population Health Survey Program can be viewed in parallel with the present data to provide a more complete picture of the links between oral health activities and population perceptions of oral health. For example, the 2005–2006 Report on Child Health, the 1997–2007 Report on Young Adults and the 1997–2007 Report on Older People supplement infor-mation from the oral health clinical data sets to permit more robust analyses of changing patterns and dental service usage in relationship to what is being measured at the clinical level.11–13
About 50% of 5–12-year-old children are reported to be caries free in the present survey, while the 2005–2006 Report on Child Health found that 66.3% of 5–15-year-old children did not report any oral health problem within the previous 12 months. The perception of oral health need at a population level is therefore lower than suggested by the objective (clinical) data. In the younger aged population therefore, health planners should be vigilant to ensure that the overall trend toward improved oral health in children and adolescents does not lead to a lessening of advocacy for population prevention of dental disease or early child-hood interventions.
Similarly, the somewhat static proportion of those aged over 65 who have visited a dental professional within the previous 12 months between 2002 and 2007 should be weighed against the objective evidence of the massive decline in the rates of edentulism (total tooth loss) and increased retention of more natural teeth in older people than was previously the case in 1987–1988.13
With one clear exception, what is evident in both sets of clinical data, and what runs through the NSW Population Health Survey Reports, is the low impact that our current clinical and preventive practices are having on reducing inequalities in oral health outcomes. The exception relates to water fluoridation.
States and the United Kingdom, both the current reports on NSW oral health information give us no reason for complacency.
The question that should therefore be at the forefront of our minds from the information presented in the following papers is whether we have the right preventive and early intervention systems in place, and the right assessment tools for tackling the major issue of inequalities in oral health. Wealth, ethnicity, access to private insurance and geography are key modifiers in the prevalence and distri-bution of dental disease and in access to dental services. Programs and methods to reduce inequities and inequali-ties should be the focus of intensive evaluation and invest-ment. This approach should be accompanied by the development of an oral health equity assessment process to ensure that both initiatives and traditional dental prac-tices are appropriately evaluated for inequity reductions as well as overall oral health gains for the NSW community.
References
1. Centre for Epidemiology and Research. The health of the people of New South Wales. Report of the Chief Health Officer, 2006. North Sydney: NSW Department of Health; 2006.
2. Lipton JA. Research evaluation and policy in dental public health. Curr Opin Dent 1991; 1(3): 329–36.
3. NSW Department of Health. A New Direction for NSW: State Health Plan: towards 2010. Sydney: NSW Department of Health; 2007.
4. National Advisory Committee on Oral Health. Australia’s National Oral Health Plan 2004–2013. Australian Health Ministers’ Conference, 2004.
5. NSW Department of Health. Public Oral Health Directions 2008. Sydney: NSW Department of Health; 2008. Available at: http://www.health.nsw.gov.au/pubs/2008/oral_health_dir_08. html (Cited 20 February 2009.)
6. Barnard PD. National oral health survey of Australia 1987–88. Canberra: Australian Government Publishing Service; 1993.
7. Carr LM. Dental health of children in Australia 1977–1983. Canberra: Australian Government Publishing Service; 1987.
8. Slade GD, Spencer AJ, Roberts-Thomson KF, editors. Australia’s dental generations: the National Survey of Adult Oral Health 2004–06. Dental Statistics and Research Series No. 34. Canberra: Australian Institute of Health and Welfare; 2007.
9. NSW Department of Health. Review of the Save Our Kids Smiles (SOKS) Program. Volume II: Technical Report. Sydney: NSW Department of Health; 2001. Available at: www.health.nsw.gov.au/pubs/2001/pdf/soksv2.pdf (Cited 20 February 2009.)
10. Australian Research Centre for Population Oral Health. National Oral Health Plan Monitoring Group: Key Process and Outcome Performance Indicators, First Follow-up Report 2002–2005. Adelaide: ARCPOH; revised November 2007. Available at: http://www.arcpoh.adelaide.edu.au/publications/ report/National_plan/NOHP%20KPIs%20Fisrt%20Follow-up%20Report%202002-2005.pdf (Cited 20 February 2009.)
11. Centre for Epidemiology and Research. Report on child health from the New South Wales Population Health Survey
2005–2006. Sydney: NSW Department of Health; 2008. Available at: http://www.health.nsw.gov.au/pubs/2008/ childreport0506.html (Cited 20 February 2009.)
12. Centre for Epidemiology and Research. Report on young adults from the New South Wales Population Health Survey 1997–2007. Sydney: NSW Department of Health; 2008. Available at: http://www.health.nsw.gov.au/resources/ PublicHealth/surveys/hsa_0716to24_pdf.asp (Cited 20 February 2009.)
13. Centre for Epidemiology and Research. Report on older people from the New South Wales Population Health Survey
40 | Vol. 20(3–4) 2009 NSW Public Health Bulletin
In 2001, the National Oral Health Monitoring Group pro-posed key indicators for assessment of oral health over time in Australia.1 Two signature age groups were chosen as benchmark age groups. These were 5–6 and 11–12-year-old children. These age groups are used by the World Health Organization (WHO) in order to allow international com-parisons of children’s oral health status.2Children’s dental caries (decay) is measured for primary (baby) teeth using the
Child Dental Health Survey 2007: a snapshot of
the oral health status of primary school-aged
children in NSW
Objectives: The Child Dental Health Survey 2007 was commissioned to establish the oral health status of school children in NSW aged 5–12 years, to provide reliable regional oral health statistics and contribute to national population-based data collections. Methods: A total of 7975 children were clinically examined at 107 public, catholic and independent schools across NSW. Results: Key findings from the survey include: mean dmft for 5–6-year-olds of 1.53; mean DMFT for 11–12-year-olds of 0.74; 61.2% of 5–6-11–12-year-olds and 65.4% of 11–12-year-olds have never experienced decay in their primary and permanent teeth, respectively. These figures compare favourably to national benchmarks set in 2001. Conclusions: Data from the survey will be used as a baseline to measure the success of early intervention and pre-vention programs, for international comparisons, to provide solid evidence to support population oral health planning and for ongoing surveillance of populations of interest.
Claire Phelan
A,D, Roy Byun
B, John C. Skinner
Aand Anthony S. Blinkhorn
CACentre for Oral Health Strategy, NSW Department of Health
BNSW Public Health Officer Training Program,
NSW Department of Health
CFaculty of Dentistry, University of Sydney
DCorresponding author. Email: [email protected]
dmft (decayed, missing due to caries, filled teeth) index and for permanent teeth using the DMFT (Decayed, Missing due to caries, Filled Teeth) index. The lower the index, the better the dental health of the population. In addition, the propor-tion of children free from decay is also recorded. This meas-urement is critical to assess the impact of preventive programs and the need for clinical dental services.
In New South Wales (NSW), recent epidemiological data about children’s oral health were based on those seeking treatment in the public dental system and therefore were biased towards populations with high disease levels. In order to provide meaningful data that would allow inter-state and international comparisons, a scientifically based Child Dental Health Survey was commissioned by the Chief Dental Officer for NSW in 2007.
The survey was conducted in conjunction with NSW area health services, the Australian Research Centre for Population Oral Health (ARCPOH) at the University of Adelaide and the University of Sydney. Ethics approval for the survey was granted from the NSW Population and Health Services Research Ethics Committee and from the State Education Research Approvals Process, NSW Department of Education and Training.
The aim of the survey was to assist in planning oral health services by providing reliable regional oral health statistics for primary school-aged children while also contributing to national population-based data collections. The survey represents a more efficient approach to oral health data collections than those available through public dental system collections or through previous risk assessment programs undertaken in NSW.3 It is the first survey in 20 years to use a randomised sample to investigate and report on various groups within the NSW child population. The aim of this paper is to present a snapshot of regional statistics and to provide evidence on the distribution of dental disease in children from populations of interest.
Note that within NSW Health, the term ‘Aboriginal’ is generally used in preference to ‘Aboriginal and Torres Strait Islander’, in recognition that Aboriginal people are the original inhabitants of NSW.
Methods
The survey covered a representative sample of children aged 5–12 years from metropolitan and non-metropolitan public, Catholic and independent schools in NSW. A two-stage sam-pling design was employed, with schools defined as the primary sampling units. First, schools were stratified by area health service region and a sample of schools was selected from each region to ensure adequate regional sample sizes. Prior to selection, schools within each region were sorted by the Index of Relative Socio-Economic Disadvantage, which is one of the Socio-Economic Indexes for Areas (SEIFA), to ensure a spread of schools from regions with various socio-economic backgrounds. Second, a random sample of chil-dren enrolled at each of these schools was selected (n⫽76). Lists of student names were created and sorted by date of birth. Age was calculated as date of examination minus date of birth. Skip intervals were then applied for each age group to generate the required sample.
Children aged 5–6 and 11–12 years were over-sampled to allow area health service comparisons of disease status. These data have been identified by NSW Health as key data to support state and area health service planning, reporting and performance indicators.
Twenty teams of calibrated dental therapists and dental assis-tants collected the information during the 2007 calendar year. Standard equipment, including portable air syringe compressors, lighting and dental instruments were used to maximise inter-examiner reliability. A principal survey examiner conducted the training and calibration of exam-ination teams, and also completed inter-examiner reliability testing on a sub-sample of children. The reliability of each of the examiners relative to the principal survey examiner was determined by calculating the intra-class correlation coeffi-cient (ICC) of count data for each replicate pair and the Kappa values for categorical coding of individual tooth and surface status. The ICC was calculated using the method of Shrout and Fleiss, and Kappa statistics were calculated using the method of Cohen.4,5
Data were recorded on optical mark recognition forms developed by ARCPOH. These forms were retrofitted to TeleForm version 10 for scanning and verification. Data were then exported to Microsoft Access for further clean-ing, following which data analysis was performed in SAS for Windows version 9.1.3.
Basic demographic data were collected, including date of birth, sex, postcode of residence and Aboriginality. Country of mother’s birth and Centrelink concession card status were also collected. The level of dental caries in an indi-vidual was recorded by tooth surface and used to calculate tooth-level status. The average decay experience (mean number of dmf/DMF teeth) is an expression of the sever-ity of the disease in the population. Need for immediate
treatment (defined as requiring dental treatment for pain, abscessed teeth, grossly decayed teeth, avulsed or frac-tured teeth, or other severe conditions with oral manifesta-tions) was recorded as was dental fluorosis using the Thylsrup and Fejerskov (T-F) Index.6
For each child, the postcode of residence was used to determine the area health service, fluoridation status of the reticulated water supply using the database maintained by the Centre for Oral Health Strategy, socioeconomic status using the SEIFA index and remoteness categories using the Accessibility/Remoteness Index for Australia. The estimated residential population at 30 June 2007 of 5–12-year-old children within each area health service region and age-specific class sizes in each school, were used to calculate sampling weights for each child.7These weights were applied when calculating regional age-specific indices and indices for population subgroups, to obtain estimates that were representative of 5–12-year-old children in NSW (Tables 1–3). NSW Health consulted closely with ARCPOH throughout the survey to ensure high reliability and validity of data so that national comparisons would be possible.
Results
Assessment of inter-examiner reliability
To assess the reliability of clinical measurements between examiners, replicate pairs of examinations were conducted with 131 children, who were examined by the principal survey examiner and by one of 20 clinical examiners. The number of replicate pairs for each examiner ranged from five to eight and examinations were conducted at nine dif-ferent schools, with the number of examiners per school ranging from one to six.
High levels of agreement were obtained for tooth pres-ence, missing, decayed or filled teeth (ICC values ranged 0.89 to 1.00; Table 4). Excellent agreement was obtained for decayed, missing or filled status of individual teeth or surface (Kappa values were 0.86 and 0.89, respectively; Table 5).
Child dental health status
A total of 7975 children were examined from 107 schools. There were 3923 male and 4052 female respondents. In the two key indicator age groups, there were 2095 in the 5–6-year-old group and 2418 respondents in the 11–12-year-old group. The mean ages of these groups were 6.1 years and 11.8 years respectively.
Five–six-year-old age group
42 | Vol. 20(3–4) 2009 NSW Public Health Bulletin
Table 1. Weighted oral health indicators in primary teeth of 5–6-year-old children by NSW area health service
Area Health Service No. of Mean dmft Mean no. decayed teeth Caries free (%)
children* All children d⬎0 All children d⬎0
Sydney South West 313 1.48 3.80 1.1 2.8 61.1
South Eastern Sydney Illawarra 257 0.91 3.14 0.5 1.8 71.1
Sydney West 323 1.77 4.31 1.4 3.3 59.1
Northern Sydney Central Coast 304 0.99 3.52 0.7 2.5 71.8
Hunter New England 256 1.20 3.24 0.9 2.5 62.9
North Coast 215 2.75 4.64 1.9 3.3 40.7
Greater Southern 236 2.16 4.40 1.6 3.2 50.8
Greater Western 192 2.66 4.87 1.8 3.3 45.4
NSW 2095 1.53 3.94 1.1 2.8 61.2
dmft: decayed, missing due to caries, filled teeth index for primary teeth; d: decayed primary teeth. Source: The Child Dental Health Survey, NSW 2007. Centre for Oral Health Strategy.
*The number of children were rounded to the next whole integer for ease of interpretation and hence the sum may differ due to rounding.
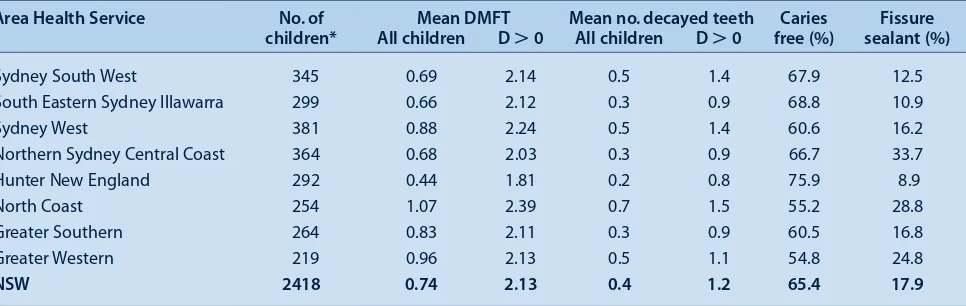
Table 2. Weighted oral health indicators in permanent teeth of 11–12-year-old children by NSW area health service
Area Health Service No. of Mean DMFT Mean no. decayed teeth Caries Fissure
children* All children D⬎0 All children D⬎0 free (%) sealant (%)
Sydney South West 345 0.69 2.14 0.5 1.4 67.9 12.5
South Eastern Sydney Illawarra 299 0.66 2.12 0.3 0.9 68.8 10.9
Sydney West 381 0.88 2.24 0.5 1.4 60.6 16.2
Northern Sydney Central Coast 364 0.68 2.03 0.3 0.9 66.7 33.7
Hunter New England 292 0.44 1.81 0.2 0.8 75.9 8.9
North Coast 254 1.07 2.39 0.7 1.5 55.2 28.8
Greater Southern 264 0.83 2.11 0.3 0.9 60.5 16.8
Greater Western 219 0.96 2.13 0.5 1.1 54.8 24.8
NSW 2418 0.74 2.13 0.4 1.2 65.4 17.9
DMFT: Decayed, Missing due to caries, Filled Teeth index for permanent teeth; D: decayed permanent teeth. Source: The Child Dental Health Survey, NSW 2007. Centre for Oral Health Strategy.
*The number of children were rounded to the next whole integer for ease of interpretation and hence the sum may differ due to rounding.
varied widely between area health services. The levels of untreated decay (the d component of the index), showed similar area health service differences. North Coast, Greater Southern and Greater Western all recorded high levels of untreated decay: 1.9, 1.6 and 1.8, respectively.
These marked differences in mean dmft and d scores were also reflected in the proportions of children in the differ-ent area health services who were caries free. The propor-tions varied from 71.8% to 40.7%.
Eleven–twelve-year-old age group
The mean DMFT for 11–12-year-old children was 0.74 and the mean D value was 0.4 (Table 2). Among 11–12-year-old children with untreated decay in their permanent teeth (D⬎0), mean DMFT was 2.13, with an average of 1.2 decayed permanent teeth. Again, large differences were found between area health service regions, with Hunter New England having the lowest mean DMFT score of 0.44 and North Coast having the highest at 1.07.
Table 2 also shows that the differences in untreated decay rates were considerable: 0.2 in Hunter New England and up to 0.7 in the North Coast. The overall proportion of 11–12-year-old children free from dental decay in their permanent teeth was 65.4%; however, these proportions varied from 54.8% to 75.9%.
The survey collected data on the presence of fissure sealants in each child. The proportion of children in the 11–12-year-old age group with at least one fissure sealant present in their permanent teeth was 17.9% statewide and varied from 33.7% in Northern Sydney Central Coast to 8.9% in Hunter New England (Table 2).
Subpopulation statistics for the whole sample
Table 3. Weighted oral health indicators for 5–12-year-old children by NSW population subgroups
Population subgroup No. of children Mean Mean no. of Caries free (%)
dmft/DMFT decayed teeth
Aboriginality
Aboriginal 458 2.64 1.8 36.2
Non-Aboriginal 6591 1.54 0.9 52.8
Centrelink Concession Card holder
Yes 2807 2.14 1.4 42.5
No 4959 1.34 0.7 56.6
Immediate treatment needed
Yes 414 5.11 4.1 3.6
No 7470 1.43 0.8 54.3
Fluoridated areas
Fluoridated 6815 1.56 0.9 52.7
Non-fluoridated 1160 2.01 1.2 44.0
Socioeconomic status*
1st quintile (highest) 1132 1.09 0.5 61.0
2nd quintile 1375 1.37 0.8 57.7
3rd quintile 1859 1.86 1.1 46.2
4th quintile 2128 1.62 1.0 51.7
5th quintile (lowest) 1481 2.02 1.3 44.3
Remoteness**
Major cities 4992 1.48 0.9 53.9
Inner regional 2135 1.85 1.1 48.1
Outer regional 711 2.21 1.3 42.2
Remote and very remote 137 2.27 1.4 40.9
NSW 7975 1.61 1.0 51.7
DMFT: Decayed, Missing due to caries, Filled Teeth index for permanent teeth; dmft: decayed, missing due to caries, filled, teeth index for primary teeth. *SEIFA: Australian Bureau of Statistics Socio-Economic Indexes for Areas. **ARIA: Accessibility/Remoteness Index of Australia. Source: The Child Dental Health Survey, NSW 2007. Centre for Oral Health Strategy.
Table 4. Intra-class correlations (ICC) for assessment of inter-rater reliability* of the Child Dental Health Survey, NSW 2007
Index per child No. of examiners No. of children ICC
Number of teeth present 20 131 1.00
Number of teeth missing due to pathology 4 6 0.96
Number of decayed teeth 20 70 0.97
Number of filled teeth 19 46 0.89
Number of decayed, missing or filled teeth 20 82 0.99
Number of decayed, missing or filled surface 20 82 0.99
*For some indicators, not all examiners were able to be assessed or some children were excluded from the assessment as the relevant conditions were not present. Source: The Child Dental Health Survey, NSW 2007. Centre for Oral Health Strategy.
Table 5. Kappa statistics for assessment of inter-rater reliability of the Child Dental Health Survey, NSW 2007
Index No. of examiners No. of children % agreement Kappa
Decayed, missing or filled category of individual teeth 20 82 93.0 0.86
Decayed or filled category of individual surface 20 80 94.7 0.89
44 | Vol. 20(3–4) 2009 NSW Public Health Bulletin
dental disease experience than non-Aboriginal children in the survey (2.64 versus 1.54 dmft/DMFT; Table 3) and had on average twice as many decayed teeth (1.8 versus 0.9).
The Centrelink Concession Card holder status of chil-dren’s parents or guardians was collected in order to deter-mine socioeconomic status. Data on children for 2807 Centrelink Health Care Card, Pensioner Concession Card and Commonwealth Seniors Health Card holders in NSW were collected in the survey. These children experienced substantially higher rates of dental disease than the remainder of the survey population (2.14 versus 1.34 dmft/DMFT; Table 3) and had on average twice as many decayed teeth (1.4 versus 0.7).
The survey identified 414 children in NSW (5.2% of the survey population) who required immediate treatment. Those that required immediate treatment had a mean dmft/DMFT rate of 5.11 and had 4.1 decayed teeth on average (Table 3). Only 3.6% of children requiring imme-diate treatment had never experienced decay.
In 2007, children living in fluoridated areas of NSW had lower mean dmft/DMFT rates than those living in non-fluoridated areas (1.56 versus 2.01; Table 3) and there were a higher proportion of children who had never expe-rienced decay compared with children in non-fluoridated areas (52.7% versus 44%).
The mean dmft/DMFT rate by socioeconomic status was also compared using the SEIFA index of relative socio-economic disadvantage, with the mean dmft/DMFT rate increasing from 1.09 in the highest socioeconomic status quintile to 2.02 in the lowest quintile (Table 3). Similarly, the mean number of decayed teeth increased from 0.5 in the highest quintile to 1.3 decayed teeth in the lowest quin-tile. The proportion of children aged 5 to 12 years with no caries experience decreased from 61.0% in the highest quintile to 44.3% in the lowest quintile.
Oral health status deteriorated with increased remoteness. In NSW in 2007, mean dmft/DMFT increased from 1.48 in the major cities to 2.27 in the remote and very remote areas (Table 3). The number of decayed teeth also increased with remoteness, from an average of 0.9 decayed teeth in the major cities to 1.4 in the remote and very remote areas. The proportion of children with no decay experience decreased with increasing remoteness, falling from a proportion of 53.9% in the major cities to 40.9% in the remote and very remote areas.
Discussion
The data from the survey provide an important snapshot of the oral health status of primary school-aged children in NSW. While statewide data show disease levels compara-ble to national rates, there are still large variations in NSW
particularly in terms of remoteness, Aboriginality, access to water fluoridation and socioeconomic status.
The mean dmft in 5–6-year-old children in NSW is 1.53, which compares favourably to the national benchmark in 2001 of 1.89. Children aged 5–6 years in NSW had on average 1.1 primary teeth that were decayed. The mean dmft varied from 0.91 in South Eastern Sydney Illawarra to 2.75 in the North Coast and the mean number of decayed primary teeth varied from 0.5 in South Eastern Sydney Illawarra to 1.9 in the North Coast, reflecting both rural/ urban differences in disease status as well as access to fluoridated water supplies.
The mean DMFT of 11–12-year-old children in NSW is 0.74, which compares favourably to the national bench-mark in 2001 of 0.95. Children aged 11–12 years in NSW had, on average, 0.4 permanent teeth that were decayed. The mean DMFT varied from 0.44 in Hunter New England to 1.07 in the North Coast and the mean number of decayed permanent teeth varied from 0.2 in Hunter New England to 0.7 in the North Coast.
The high level of dental disease detected in Aboriginal children in this survey is consistent with the findings of previous child dental health surveys.9In NSW, 16 Aboriginal Community Controlled Organisations provide dental services to local communities using a combination of Com -monwealth and NSW Government funding. These services are often in rural and remote communities that do not have access to fluoridated water supplies.
The NSW Government, via the NSW Department of Health and the Centre for Oral Health Strategy, have implemented a range of programs to prevent dental decay in children and to identify disease early and intervene where appropriate. These programs include initiatives to encourage water supply authorities to introduce water fluoridation, the Early Childhood Oral Health Program and various oral health promotion initiatives.10These health promotion activities are related to the priorities of both the State Health Plan and NSW State Plan with the latter describing the state oral health strategy as being ‘...to design and implement new models of care with a focus on prevention and early inter-vention’.11The State Health Plan also includes the expansion of the ‘…availability of fluoridated water to the State’s pop-ulation’ and the need for better oral health promotion pro-grams’.12In order to monitor the progress of these programs, surveys of child dental disease status will be required on an ongoing basis.
finding of the Child Dental Health Survey 2007 that statewide only 17.9% of children aged 11–12 years had one or more fissure sealants present in their permanent teeth. It has been proposed that the target coverage should be 25% by 2012.
The Child Dental Health Survey 2007 has provided high quality data that encourages area health services to make the shift to an evidence-based population health approach and allows NSW Health to set targets for proven preven-tive strategies and to evaluate prevenpreven-tive programs. Area health services have further benefited through the devel-opment of local expertise in epidemiological survey methods and through having access to updated scanning and data processing technology at the state-level. The use-fulness of the survey data has been enhanced by the time-liness of data processing, the analysis and release of which took approximately 8 months. The survey has established baseline data that will be comparable with data to be col-lected by the National Child Dental Health Survey planned for 2010 and 2011.
Conclusions
• NSW Health has demonstrated that it is possible to undertake a statewide survey of school children’s dental disease status with a minimum of disruption to schools and to the ongoing provision of clinical oral health services.
• Data from the Child Dental Health Survey 2007 provide solid evidence to support population oral health planning at both regional and state levels, and facilitate ongoing surveillance of populations of interest.
• The rate of dental disease in Aboriginal children is a continuing cause for concern, being almost twice that of the NSW child population.
Acknowledgments
The authors gratefully acknowledge the assistance and expertise during the survey planning phase of Dr Clive Wright from the Centre for Oral Health Strategy and, from ARCPOH, Professor John Spencer, Dr Kaye Roberts-Thomson, Anne Ellershaw, Dr Loc Do and Dr Jason Armfield. The authors also acknowledge Dr Sandra Meihubers for conducting the calibration and reliability testing for NSW Health survey examination teams, Dr Alan Patterson for protocol develop-ment, the exam teams and co-ordinators for administering the survey and Sam Sterland and staff from the National Church Life Survey for retrofitting and scanning of the data forms to Teleform.
References
1. Australian Research Centre for Population Oral Health. National Oral Health Plan Monitoring Group: Key Process and Outcome Performance Indicators, First Follow-up Report 2002–2005. Adelaide: ARCPOH; revised November 2007.
Available at: http://www.arcpoh.adelaide.edu.au/publications/ report/National_plan/NOHP%20KPIs%20Fisrt%20Follow-up%20Report%202002-2005.pdf (Cited 20 February 2009.)
2. World Health Organization. Global InfoBase data warehouse. Dental Caries Prevalence and Severity. Geneva: WHO; 2008. Available at: http://www.who.int/infobase/reportviewer.aspx? rptcode=ALL&surveycode=160022a1&dm=6#pgstring1 (Cited 20 February 2009.)
3. NSW Department of Health. Review of the Save Our Kids Smiles (SOKS) Program. Volume I: Report. North Sydney: NSW Health Department; 2001.
4. Shrout PE, Fleiss JL. Intraclass correlations: uses in assessing rater reliability. Psychol Bull 1979; 86(2): 420–8.
doi:10.1037/0033-2909.86.2.420
5. Cohen J. A coefficient of agreement for nominal scales. Educational and Psychological Measurement. Educ Psychol
Meas 1991; 51(1): 95–101.
6. Fejerskov O, Baelum V, Manji F, Møller IJ. Dental fluorosis: a handbook for health workers. Copenhagen: Munksgaard; 1988: p. 123.
7. Australian Bureau of Statistics. Population by age and sex,
Australia, 2006. ABS Catalogue No. 3235.0. Canberra: ABS;
2007. Available at: www.abs.gov.au/ausstats (Cited 20 February 2009.)
8. Centre for Epidemiology and Research. The health of the people of New South Wales. Report of the Chief Health Officer, 2006. Sydney: NSW Department of Health; 2006. Available at: http://www.health.nsw.gov.au/public-health/chorep/atsi/atsi_pop_agesex_atsi.htm (Cited 20 February 2009.)
9. Jamieson LM, Armfield JM, Roberts-Thomson KF. Oral health of Aboriginal and Torres Strait Islander children. Australian Institute of Health and Welfare, Dental Statistics and Research Unit. AIHW Cat. No, DEN 167. Canberra: AIHW (DSRU Series No. 35); 2007.
10. NSW Department of Health. Early Childhood Oral Health Guidelines for Child Health Professionals. Sydney: NSW Department of Health; 2007.
11. Government NSW. Premier’s Department. A New Direction for NSW: State Plan. Premier’s Department, 2006.
12. NSW Department of Health. A New Direction for NSW. State Health Plan towards 2010. Sydney: NSW Department of Health; 2007.
13. Weintraub JA. Pit and fissure sealants in high-caries risk individuals. J Dent Educ 2001; 65(10): 1084–90.
14. Locker D, Jokovic A, Kay EL. The use of pit and fissure sealants in preventing caries in the permanent dentition of children. Br Dent J 2003; 195(7): 375–8.
doi:10.1038/sj.bdj.4810556
15. NSW Department of Health. Pit and Fissure Sealants: Use of in Oral Health Services NSW. Sydney: NSW Department of Health; 2008. Available at: http://www.health.nsw.gov.au/ policies/pd/2008/pdf/PD2008_028.pdf (Cited
46 | Vol. 20(3–4) 2009 NSW Public Health Bulletin
In New South Wales (NSW), the lack of representative clin-ical data on the oral health of adults has curtailed a compre-hensive and co-ordinated approach to planning for oral health services, policy and program development. Although
The oral health of adults in NSW, 2004–06
Abstract: Objectives: The 2004–06 National Survey of Adult Oral Health was Australia’s second oral examination survey of a nationally representa-tive sample of adults. The aim of this paper is to provide a brief overview of oral health in the NSW adult population from the findings of the survey. Methods: A three-stage, stratified, clustered sam-pling design was used to select NSW residents aged 15 years and over. Self-reported information about oral health was obtained through telephone inter-views. People with natural teeth were offered clinical examinations. Results: 3630 people were inter-viewed and 1099 underwent a clinical examination. Only 5.5% of the study population were edentulous (all natural teeth missing) compared with the national estimate of 6.4%. The Decayed, Missing, Filled Teeth (DMFT) caries severity index was 12.8, equal to that of the Australian population; prevalence of untreated decay was 27.1%, which was not signif-icantly different to the national estimate of 25.5%. Some 60.3% of the NSW survey sample had visited a dentist within the last 12 months (nationally 59.4%) and 56.8% visited for a check-up (56.2% nationally). Oral health, use of dental services and perceptions of need varied significantly by geo-graphic location, private insurance patronage and eligibility for public dental care. Conclusions: The oral health of the NSW adult population and patterns of dental care are similar to that estimated nationally. The prevalence and severity of dental diseases and oral health behaviours are influenced by social and geographic factors.
Shanti Sivaneswaran
Centre for Oral Health Strategy, NSW Department of Health Email: [email protected]
clinical data have been collected on the oral health of patients who attended public dental care in 1995–96 and 2001–02, the 1987–88 National Oral Health Survey remained the only survey that had collected oral examination data on a repre-sentative sample of NSW residents.1–4
In 2004, the Centre for Oral Health Strategy was responsi-ble for conducting the NSW component of the National Survey of Adult Oral Health 2004–06 in accordance with methods developed by the Australian Research Centre for Population Oral Health (ARCPOH) at the University of Adelaide, South Australia. The survey was a cross-sectional study of a representative sample of people aged 15 years and over across each state and territory, and described levels of oral disease, perceptions of oral health and patterns of dental care. Detailed methodology of the survey, national findings and NSW findings have been reported elsewhere.5,6The aim of this paper is to provide an overview from the findings of the survey of oral health in the NSW adult population, by using key indicators to compare NSW data between population subgroups and with national estimates. Data presented here were drawn from the national report and the NSW publication.5,6
Methods
A three-stage, stratified, clustered sampling design was used to select people from the target population of NSW residents aged 15 years and over. The sampling frame was households with telephone numbers listed in the electronic white pages database. Self-reported information about oral health and characteristics associated with it were obtained through telephone interviews. People with natural teeth were invited to attend a dental clinic for a clinical examination. Standardised clinical oral examination was carried out by 11 dentists trained and calibrated in the survey procedures by ARCPOH. Reliability testing was carried out against an ARCPOH principal survey exam-iner. Inter-examiner reliability was similar to benchmarks reported in the United States and United Kingdom national oral health surveys.
Data were weighted to compensate for individuals’ differ-ent probabilities of selection and survey participation rates. Additional data on height, weight and waist meas-urements were collected in NSW. Data collection began in July 2004 and was completed in September 2006. Statistical significance in the survey was reported using 95% confidence intervals (95% CIs). This criterion for judging statistical significance is more conservative than
the alternative method of calculating P-values because 95% CIs that overlap to a small degree could be found to differ to a statistically significant degree (at P⬍0.05) using a hypothesis test. Data analysis was carried out by ARCPOH and, at the time of writing, no secondary analy-sis of the NSW unit record files made available to the Centre for Oral Health Strategy has been carried out.
Results
Socio-demographic characteristics of NSW participants
Out of 3630 NSW adults interviewed, 1099 underwent a clinical examination. One-half of the survey sample was female (49.8%), two-thirds lived in the capital city (64.1%), one-half had dental insurance (48.6%) and a quarter were government Health Care Card holders (26.4%).
Oral health status of NSW adults
Complete loss of teeth (edentulism) is a marker of dental mortality. It is a consequence of both extensive dental disease and a surgical approach to its treatment. In NSW, only 5.5% of the population were edentulous compared with the national estimate of 6.4%. In the National Survey of Adult Oral Health, a threshold of 21 teeth was used as an indicator of professionally defined inadequacy of the natural dentition. The percentage of NSW adults who had fewer than 21 teeth (11.7%) was similar to the national figure of 11.4%. There was no statistically significant dif-ference between NSW dentate (people with teeth) adults who wear dentures in the upper or lower jaws (15.9%) compared with the national estimate of 14.9%. The preva-lence of untreated coronal decay was reported as the per-centage of dentate people who had at least one or more decayed surfaces on the crowns of their teeth. In NSW the prevalence of untreated coronal decay was 27.1% com-pared with the national estimate of 25.5%. There was no significant difference in the number of teeth missing due to pathology between dentate persons in NSW and those in the whole of Australia. The DMFT index reflects a person’s lifetime experience of dental caries. The DMFT
for NSW (12.8) is the same as that for the Australian population. An indicator for the severity of periodontal disease is a measurement of periodontal pocket depths more than 4 mm. The percentage of NSW adults who had at least one site with a periodontal pocket depth of 4 mm or more (21.4%) was not significantly different to the national estimate of 19.8% (Table 1).
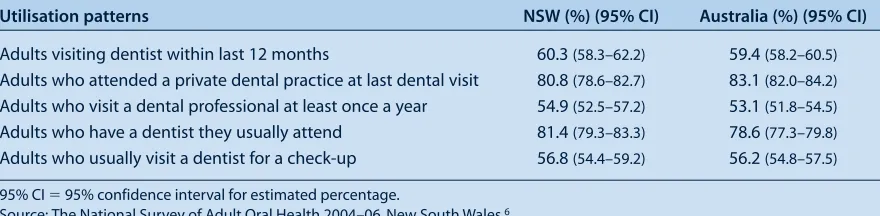
Utilisation patterns of dental services by NSW adults Time since last visiting a dentist is a key indicator of access to dental care. In NSW, 60.3% of adults visited a dentist within the last 12 months, which was not significantly dif-ferent from the national estimate of 59.4%. The majority of adults visited a private dental practice (80.8%), which was not significantly different to the whole Australian population (83.1%). The visiting behaviours of NSW adults was not different from that of all Australian adults with 54.9% of NSW adults visiting at least once a year compared with the national estimate of 53.1%. Usual attendance at the same dentist implies continuity of care and again there are no sig-nificant differences between NSW and all Australian adults. Approximately half of NSW adults visited a dentist for a check-up, which was similar to the figure for all Australian adults (Table 2).
Oral health perceptions of NSW adults
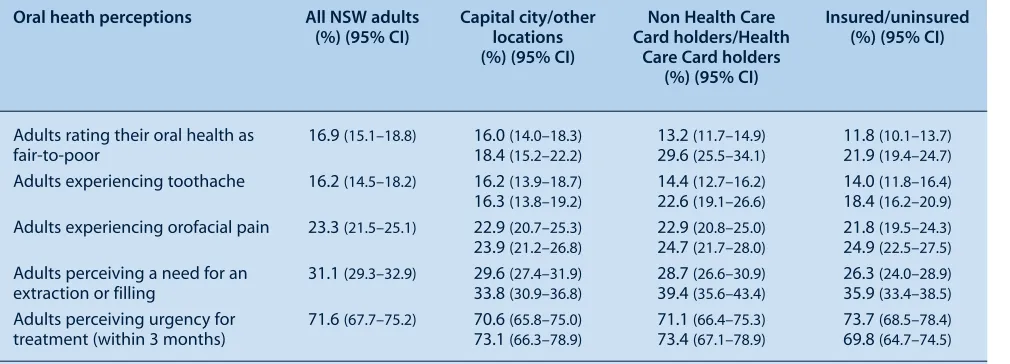
In addition to clinical examination, self-reported oral health, rates of pain and perceived needs for the most common dental treatments were collected to provide addi-tional indicators of subjective oral health. There was no significant difference between NSW and all Australian adults in self-reporting of oral health, experiencing toothache and orofacial pain. Similarly, there was no dif-ference in rates of the perceived need for extraction or filling. Those who perceived a need for extraction or filling were asked about the urgency of needed dental treatment. There was no difference in perceived urgency for treatment, with 71.6% of NSW adults reporting a need for treatment within 3 months, which is not significantly different to the national estimate of 69.3% (Table 3). Table 1. Key indicators of oral health status of NSW adults and comparison with national estimates
Oral health status NSW (95% CI) Australia (95% CI)
Percentage of adults with complete tooth loss 5.5 (4.8–6.3) 6.4 (6.0–6.9)
Percentage of adults with fewer than 21 natural teeth 11.7 (10.5–13.1) 11.4 (10.7–12.1)
Percentage of dentate adults who wear dentures 15.9 (14.5–17.4) 14.9 (14.2–15.7)
Percentage of adults with untreated coronal decay* 27.1 (23.6–30.9) 25.5 (23.7–27.3)
Average number of teeth per person missing due to pathology 4.9 (4.4–5.4) 4.5 (4.3–4.8)
Average number of decayed, missing or filled teeth per person 12.8 (11.9–13.7) 12.8 (12.4–13.3)
Percentage of adults with ⬎4 mm periodontal pocket depth** 21.4 (17.8–25.5) 19.8 (17.9–21.8)
95% CI: 95% confidence interval for estimated percentage/estimated mean.
*Percentage of people who have at least one or more decayed surface on the crowns of their teeth.
48 | Vol. 20(3–4) 2009 NSW Public Health Bulletin
Health Care Card holders and those without insurance also have significantly less favourable patterns of utilisation on all indicators of dental care (Table 5). All three aspects of usual dental attendance patterns (attending at least once a year, usually attend the same dentist and attending for a check-up) were also significantly lower among residents outside of the capital city.
It was therefore not surprising that significantly more Health Care Card holders rated their oral health as fair-to-poor, reported experiencing more toothache and perceived a need for treatment. Significantly more uninsured adults also reported their oral health as poor and perceived a need for treatment (Table 6).
Discussion
The major findings from this study indicate that generally, the oral health of the NSW adult population is similar to the whole of the adult population in Australia. Since the 1987–88 survey, the proportion of NSW adults who had no natural teeth more than halved to 5.5%, which is consistent with the figure of 5.1% reported in the 2007 NSW Adult Health Survey.7In dentate adults, there were similar reduc-tions in the percentage with an inadequate natural dentition. Improvements were also reported in the decay experience since the last survey, with a fluoride generation (those born since the 1950s and 1960s) of NSW residents who have now Table 2. Key indicators of utilisation patterns of dental services by NSW adults and comparisons with national
estimates
Utilisation patterns NSW (%) (95% CI) Australia (%) (95% CI)
Adults visiting dentist within last 12 months 60.3 (58.3–62.2) 59.4 (58.2–60.5)
Adults who attended a private dental practice at last dental visit 80.8 (78.6–82.7) 83.1 (82.0–84.2)
Adults who visit a dental professional at least once a year 54.9 (52.5–57.2) 53.1 (51.8–54.5)
Adults who have a dentist they usually attend 81.4 (79.3–83.3) 78.6 (77.3–79.8)
Adults who usually visit a dentist for a check-up 56.8 (54.4–59.2) 56.2 (54.8–57.5)
95% CI⫽95% confidence interval for estimated percentage.
Source: The National Survey of Adult Oral Health 2004–06. New South Wales.6
Table 3. Key indicators of oral health perceptions of NSW adults and comparisons with national estimates
Oral health perceptions NSW (%) (95% CI) Australia (%) (95% CI)
Adults rating their oral health as fair-to-poor 16.9 (15.1–18.8) 16.4 (15.5–17.4)
Adults experiencing toothache 16.2 (14.5–18.2) 15.1 (14.2–16.1)
Adults experiencing orofacial pain* 23.3 (21.5–25.1) 22.6 (21.6–23.6)
Adults perceiving a need for an extraction or filling 31.1 (29.3–32.9) 32.9 (31.7–34.0)
Adults perceiving urgency for treatment (within 3 months) 71.6 (67.7–75.2) 69.3 (67.4–71.3)
95% CI⫽95% confidence interval for estimated percentage.
*Percentage of participants who reported pain in the face, jaw, temple, in front of the ear or in the ear during the last month. Source: The National Survey of Adult Oral Health 2004–06. New South Wales.6
Oral health of NSW adults by population subgroup The oral health of NSW adults by major socio-demographic subgroup were defined according to residential location, dental insurance status and by government Health Care Card status. A government Health Care Card is a conces-sion card issued by the Australian Government that entitles the holder to services, including public dental care. Eligibility for a Health Care Card is determined by a means test based primarily on income, assets and family composition.
Table 4. Oral health status of NSW adults by population subgroup
Oral health status All NSW adults Capital city/other Non Health Care Insured/uninsured
(95% CI) locations Card holders/Health (95% CI)
(95% CI) Care Card holders***
(95% CI)
Percentage of adults with complete 5.5 (4.8–6.3) 4.0 (3.3–4.8) 2.0 (1.6–2.5) 2.3 (1.7–3.0)
tooth loss 8.1 (6.6 –9.8) 15.4 (13.3–17.8) 8.4 (7.2–9.8)
Percentage of adults with fewer than 11.7 (10.5–13.1) 10.3 (8.7–12.1) 6.0 (5.1–7.1) 7.3 (6.0–8.8)
21 natural teeth 14.3 (12.4–16.4) 31.3 (27.9–34.8) 16.2 (14.2–18.4)
Percentage of adults with untreated 27.1 (23.6–30.9) 21.4 (17.6–25.6) 23.8 (19.8–28.3) 20.7 (15.6–26.8)
coronal decay* 37.4 (30.7–44.6) 36.9 (30.0–44.3) 33.2 (28.6–38.2)
Average number of decayed, missing or 12.8 (11.9–13.7) 12.2 (11.1–13.3) 11.5 (10.6–12.5) 12.8 (11.5–14.1)
filled teeth per person 13.9 (12.3–15.5) 16.6 (14.9–18.3) 13.1 (11.9–14.2)
Average number of teeth per person 4.9 (4.4–5.4) 4.4 (3.7–5.0) 3.7 (3.2–4.2) 4.1 (3.4–4.8)
missing due to pathology 5.9 (4.9–6.8) 8.4 (7.2–9.7) 5.7 (5.0–6.5)
Percentage of adults with ⬎4 mm 21.4 (17.8–25.5) 25.1 (20.2–30.7) 21.0 (17.0–25.5) 21.7 (16.8–27.6)
periodontal pocket depth** 14.5 (9.8–21.0) 35.5 (23.4–49.7) 21.6 (17.1– 27.0)
95% CI⫽95% confidence interval for estimated percentage/estimated mean.
*Percentage of participants who have at least one or more decayed surfaces on the crowns of their teeth.
**An indicator for the severity of periodontal disease is measurement of periodontal pocket depths more than 4 mm.
***A Health Care Card is a concession card issued by the Australian Government that entitles the holder to services including public dental care. Source: The National Survey of Adult Oral Health 2004–06. New South Wales.6
Table 5. Utilisation patterns of dental health services by NSW adults by population subgroup
Utilisation patterns All NSW adults Capital city/other Non Health Care Insured/uninsured
(%) (95% CI) locations Card holders/Health (%) (95% CI)
(%) (95% CI) Care Card holders
(%) (95% CI)
Adults visiting dentist within last 60.3 (58.3–62.2) 63.3 (60.9–65.7) 63.5 (61.3–65.7) 74.2 (71.8–76.6)
12 months 55 (51.7–58.2) 51.4 (47.9–54.8) 48.3 (46.0–50.7)
Adults who attended a private dental 80.8 (78.6–82.7) 82.0 (79.3–84.5) 86.3 (84.2–88.1) 88.0 (85.7–90.0)
practice at last dental visit 78.6 (74.9–81.8) 65 (61.2–68.7) 74.4 (71.3–77.2)
Adults who visit a dental professional 54.9 (52.5–57.2) 58.8 (55.6–62.0) 58.1 (55.4–60.7) 69.3 (66.2–72.3)
at least once a year 47.8 (44.7–50.9) 44.4 (40.3–48.5) 41.1 (38.4–43.8)
Adults who have a dentist they usually 81.4 (79.3–83.3) 82.9 (80.5–85.0) 83.4 (81.1–85.5) 90.2 (88.3–91.8)
attend 78.8 (74.8–82.2) 74.8 (71.1–78.2) 72.3 (69.1–75.2)
Adults who usually visit a dentist for a 56.8 (54.4–59.2) 61.1 (57.9–64.3) 61.6 (59.1–64.1) 71.3 (68.3–74.1)
check-up 49.2 (45.6–52.7) 40.4 (36.7–44.1) 42.6 (39.7–45.6)
95% CI⫽95% confidence interval for estimated percentage.
Source: The National Survey of Adult Oral Health 2004–06. New South Wales.6
reached adulthood and who have been exposed to fluori-dated water and fluoride in toothpaste since childhood.
Despite marked reductions in tooth loss and dental decay experience, the burden of oral disease persists with one in four NSW adults having at least one tooth with untreated dental decay and a similar proportion having destructive periodontal disease and oral facial pain. The pervasive nature of oral disease, together with the dramatic increase in retention of natural teeth in adults, has implications for the state dental care system and dental workforce.
Virtually all aspects of oral health measured in this survey were significantly more frequent and severe in Health
50 | Vol. 20(3–4) 2009 NSW Public Health Bulletin
Table 6. Oral health perceptions of NSW adults by population subgroup
Oral heath perceptions All NSW adults Capital city/other Non Health Care Insured/uninsured
(%) (95% CI) locations Card holders/Health (%) (95% CI)
(%) (95% CI) Care Card holders
(%) (95% CI)
Adults rating their oral health as 16.9 (15.1–18.8) 16.0 (14.0–18.3) 13.2 (11.7–14.9) 11.8 (10.1–13.7)
fair-to-poor 18.4 (15.2–22.2) 29.6 (25.5–34.1) 21.9 (19.4–24.7)
Adults experiencing toothache 16.2 (14.5–18.2) 16.2 (13.9–18.7) 14.4 (12.7–16.2) 14.0 (11.8–16.4)
16.3 (13.8–19.2) 22.6 (19.1–26.6) 18.4 (16.2–20.9)
Adults experiencing orofacial pain 23.3 (21.5–25.1) 22.9 (20.7–25.3) 22.9 (20.8–25.0) 21.8 (19.5–24.3)
23.9 (21.2–26.8) 24.7 (21.7–28.0) 24.9 (22.5–27.5)
Adults perceiving a need for an 31.1 (29.3–32.9) 29.6 (27.4–31.9) 28.7 (26.6–30.9) 26.3 (24.0–28.9)
extraction or filling 33.8 (30.9–36.8) 39.4 (35.6–43.4) 35.9 (33.4–38.5)
Adults perceiving urgency for 71.6 (67.7–75.2) 70.6 (65.8–75.0) 71.1 (66.4–75.3) 73.7 (68.5–78.4)
treatment (within 3 months) 73.1 (66.3–78.9) 73.4 (67.1–78.9) 69.8 (64.7–74.5)
95% CI⫽95% confidence interval for estimated percentage.
Source: The National Survey of Adult Oral Health 2004–06. New South Wales.6
different Australian jurisdictions, the social gradients and oral health outcomes observed for the NSW population are consistent across Australia.
The NSW Oral Health Strategic Directions sets the plat-form for oral health action in NSW into the next decade and calls for a range of interventions to tackle fundamen-tal causes of disadvantage. Linkages with the National Oral Health Plan, in a nationally coherent approach to dental services priorities and prevention, is supported by this state survey and the national report.9This approach includes a strong emphasis on water fluoridation, one of the few public health measures that reduce the social inequalities in caries experience.10
Providing more equitable access to dental care in the public sector and outside of Sydney remains a challenge. In NSW, holders of Health Care Cards Pensioner Concession Cards and Commonwealth Seniors Health Cards are eligi-ble for public dental care.11Data from Centrelink indicate approximately 1.6 million NSW residents are eligible for public dental care, of which 441 385 are Health Care Card holders and the remainder are Pensioner Concession Card and Commonwealth Seniors Health Card holders. However, only 16% (approximately 457) of the 3472 practicing den-tists in NSW are working in the public dental sector.12
In 2008, new dental awards were gazetted with salary enhancements for dental clinicians and a new career struc-ture that emphasises clinical skills and career pathways to attract and retain clinical staff in the public sector. NSW Health has strategies in place to attract new graduates and dentists to regional areas of NSW to reduce the inequitable distribution of dentists across the state. A new regional dental school training dentists and oral health therapists has been established at Charles Sturt University in Orange.
Although this latest survey provides current information on oral health for a representative sample of the NSW adult population, the small number of people from rural and remote areas enrolled in the survey does not allow spe-cific insight into these localities.6 Similarly, the small number of Aboriginal and Torres Strait Islander Australians included in this survey calls for further surveys with dif-ferent sampling frames. Data collected from such surveys would permit policy development aimed at reducing the inequalities in access to dental services and oral health outcomes for Aboriginal and Torres Strait Islander Australians and residents of rural and remote NSW.
Conclusions
Oral health of the NSW adult population and patterns of dental care are similar to national estimates. Oral disease is disproportionately more frequent among Health Care Card holders, the uninsured and those living outside of Sydney. These groups also have significantly less favourable pat-terns of dental care.
Acknowledgments
The author wishes to acknowledge: the Australian Research Centre for Population Oral Health; the NSW survey team – the dental exam-iners, dental recorders, appointment coordinators; the NSW area health services and Dr Clive Wright, NSW Chief Dental Officer.
References
1. Brennan DS, Spencer AJ, Slade GD. Caries experience among public funded dental patients in Australia, 1995-96: type of care and geographic location. Aust Dent J 2000; 45(1): 37–45. doi:10.1111/j.1834-7819.2000.tb00240.x
2. Brennan DS, Spencer AJ. Adult Dental Programs Survey 2001–02. Adelaide: AIHW Dental Statistics and Research Unit, the University of Adelaide; 2003.
4. Barnard PD. National Oral Health Survey Australia 1987–88. Canberra: Australian Government Publishing Service; 1993.
5. Slade GD, Spencer AJ, Roberts-Thomson KF, editors Australia’s dental generations: the National Survey of Adult Oral Health 2004–06. Dental Statistics and Research Series No. 34. Canberra: Australian Institute of Health and Welfare; 2007.
6. AIHW, Dental Statistics and Research Unit. The National Survey of Adult Oral Health 2004–06. New South Wales. Dental Statistics and Research Series No. 40. Canberra: Australian Institute of Health and Welfare; 2008.
7. Centre for Epidemiology and Research. Report on Adult Health from the 2007 New South Wales Population Health Survey. Sydney: NSW Department of Health; 2008.
8. Centre for Oral Health Strategy. New South Wales Oral Health Strategic Directions 2005–2010. Sydney: NSW Department of Health; 2008.
9. National Advisory Committee on Oral Health. Australia’s National Oral Health Plan 2004–2013. Australian Health Ministers’ Conference, 2004.
10. Slade GD, Spencer AJ, Davies MJ, Stewart JF. Influence of exposure to fluoridated water on socioeconomic inequalities in children’s caries experience. Community Dent Oral Epidemiol 1996; 24(2): 89–100. doi:10.1111/j.1600-0528.1996.tb00822.x
11. NSW Department of Health. Eligibility of Persons for Public Oral Health Services in NSW. Policy Directive PD 2008_006. November 2008. Available at: http://www.health.nsw.gov.au/ policies/pd/2008/PD2008_066.html (Cited 1 March 2009.)
52 | Vol. 20(3–4) 2009 NSW Public Health Bulletin
Over the past two decades there has been a considerable decline in the dental caries experience of 5- and 12-year-old children in most industrialised countries.1,2 However, the quality of much of the dental epidemiological data is somewhat dubious making comparisons difficult. Australia, the United States (US) and the United Kingdom (UK) have well-established epidemiological programs recording the dental health of both adults and children.
A number of host and environmental factors are related to an individual’s caries experience.3These factors include age, gender, dietary intake, fluoride exposure, dental attendance
Comparison of the dental health of adults
and children living in NSW with their
counterparts in the US and UK
Abstract: This paper aims to place the findings of the NSW Adult and Child Dental Health Surveys in an international context. The comparator coun-tries are the US and the UK, both of which have well-documented epidemiological dental health data. The US has a mainly private system of dental care, similar to NSW, whereas the UK has primarily a government-funded dental care program. The adult data collected in the last 20 years in all three locations indicates greatly improved oral health with a decline in the propor-tions of people with no natural teeth. The majority of children have few dental problems but inequal-ity remains with some children in lower socio-economic groups still having high levels of dental ill health, which contributes to a lower quality of life. Improving population levels of oral health in all three countries will require collective decision-making by stakeholders and politicians to finance plans for action and manage change to help those individuals for whom dental disease is still a major problem.
Anthony S. Blinkhorn
Faculty of Dentistry, University of Sydney Email: [email protected]
patterns, socioeconomic status and rural or urban location. There is evidence from longitudinal studies in the UK that the rapid market penetration of fluoride toothpaste changed the caries experience of children as did the fluoridation of public water supplies in Australia.4
The objective of this paper is to compare the dental health of children and adults living in New South Wales (NSW), the US and the UK using data from well-described epidemiological studies.
Methods
Data from national adult and child surveys in the UK were extracted and compared with NSW data collated by the Australian Research Centre for Population Oral Health (ARCPOH) at the University of Adelaide and data from the US National Health and Nutrition Examination Survey 2003–2004.5–8
Details of the UK and US studies have been well docu-mented elsewhere. NSW data were drawn from the Australian National Survey of Adult Oral Health, which was undertaken from 2004 to 2006 and the NSW Child Dental Health Survey that examined children in 2007.7–9
Results
Adults
The proportions of people who were classified as having lost all of their natural teeth (edentulous) are presented in Table 1. Levels of total tooth loss were of little clinical sig-nificance for people aged under 35 years. NSW had the lowest prevalence of total tooth loss within every age cat-egory except for adults aged 75 years and over. Both the US and NSW fared much better than the UK.
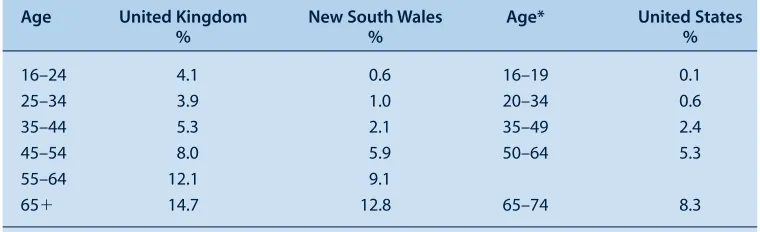
Table 2 presents the mean number of missing teeth per person in each location according to age. The NSW and US participants have similar levels of tooth loss, much lower than that recorded by the UK. The NSW and US surveys had similar proportions of participants with one or more decayed (carious) teeth; the percentages were approximately half that reported by the UK Adult Dental Health Survey (Table 3).6,8
Children
The data for children were confined to 5–6-year olds and 11–12-year olds as these age groups are used by the World
Health Organization (WHO) in their pathfinder database. The US data are more difficult to unravel as 2–5-year-olds are grouped, which is a disadvantage as dental caries increases over time. Including younger children in the age group will lower the mean dmft (decayed, missing due to caries, filled teeth) index.
Table 4 shows that the UK and NSW have similar mean dmft scores, with the US slightly lower at 1.1; for reasons already stated, this score may be an underestimate.
The data presented in Table 5 detail the mean DMFT scores for 11–12-year-old children. Once again, comparisons Table 1. Proportion of adults in the UK, NSW and US who are edentulous, according to age
Age United Kingdom* New South Wales United States
% Age % %
16–24 0
25–34 0 20–34 0 0
35–44 1 35–49 1 3
45–54 6
55–64 20 50–64 8 10
65–74 36 65–74 20 24
75⫹ 58 75⫹ 36 31
* More age categories were used in United Kingdom.
Sources: Adult Dental Health Survey. London: Office for National Statistics; 2000.6The National Survey of Adult Oral Health 2004–06. Canberra: AIHW; 2007.7Trends in oral health status: United States 1988–1994 and 1999–2004.8
Table 2. The mean number of missing teeth of adults in the UK, NSW and US, according to age
Age United Kingdom New South Wales Age* United States
% % %
16–24 4.1 0.6 16–19 0.1
25–34 3.9 1.0 20–34 0.6
35–44 5.3 2.1 35–49 2.4
45–54 8.0 5.9 50–64 5.3
55–64 12.1 9.1
65⫹ 14.7 12.8 65–74 8.3
*United States age categories are not a direct match.
Sources: Adult Dental Health Survey. London: Office for National Statistics; 2000.6The National Survey of Adult Oral Health 2004–06. Canberra: AIHW; 2007.7Trends in oral health status: United States 1988–1994 and 1999–2004.8
Table 3. Proportion of adults in the UK, NSW and US with one or more carious teeth, according to age
Age United Kingdom New South Wales Age* United States
% % %
16–24 51 24 16–19 18
25–34 60 27 20–34 28
35–44 51 30 35–49 26
45–54 57 24
55–64 54 23 50–64 22
65⫹ 54 22 65–74 20
*United States age categories are not a direct match.