Research and Development Projects Upon Real Options View
Dominik Metelski
1, Antonio Mihi-Ramirez
1, Jesus Arteaga-Ortiz
21 University of Granada
Campus Cartuja, 18071 Granada, Spain E-mail: [email protected], [email protected]
2University of Las Palmas de Gran Canaria
35017 Las Palmas de Gran Canaria, Spain E-mail: [email protected]
http://dx.doi.org/10.5755/j01.ee.25.3.2737
Weinvestigate the importance of R&D expenditures for SMC (small and medium companies) and for Blue Chips, focusing on the existence of relation between Research and Development (R&D) option value and some variables such as relative probability of innovation, level of capital expenditures, expected innovation rents, expenditures with respect to the implementation of new technologies, proportions of money, proportions of indebtedness, operating cash flows, patents of affiliated companies, numbers of workers, market concentration and the efficiency of work. Empirical analysis also includes R&D projects valuation worksheet based upon the competition duopoly model that we applied to Brazilian Embraer and Canadian Bombardier. Embraer and Bombardier are 3rd and 4th largest suppliers of commercial aircrafts. These are main rival competitors in the segment of small commuter planes. Our main objective was to study changes of R&D projects performance when alterations of environmental factors are simulated. Basically, we observed significant difference between SMCs and Blue Chips. SMC tend to start new R&D projects on their own while Blue Chips buy other companies that already have access to new technologies. Moreover, in the group of small companies, R&D costs are significantly positive, while Blue Chips show opposite results as R&D costs are negative and statistically significant in this group. In addition, R&D projects and patents possessed by investigated companies affect positively R&D projects valuation. Future growth, which forms part of the value of a company, depends on the number of patents pertaining to companies and newly started R&D projects which subsequently will become patents possessed by those companies.
Keywords: Innovation and R&D, Financial Management, Comparative Entrepreneurship, Real Options.
Introduction
Real options (RO) technique is used to value investments decisions under uncertainty (e.g., Dixit & Pindyck, 1994; Trigeorgis, 1996; Miller & Bertus, 2005; Schneider et al., 2008). This real options framework implies that any corporate decision to invest or divest in assets is simply viewed as an option (Miller & Bertus, 2005). Applications of RO method can be found in numerous areas (Trigeorgis, 1996; Graham & Harvey, 2001; Miller & Bertus, 2005;), but real options valuation methods have tended to follow financial option pricing techniques (Black & Scholes, 1973; Merton, 1973; Margrabe, 1978; Cox et al., 1979; Geske, 1979; Singh & Vives, 1984; Carr, 1988; Newton et al., 2004; Miller & Bertus, 2005; Mileris, & Boguslauskas, 2011) which are applicated into key business segments of different areas companies like manufacturing, inventory, natural resources, research and development, strategic decisions, technology, and stock valuation (Coy, 1999; Miller & Bertus, 2005; Mileris, & Boguslauskas, 2011). And currently, although use of traditional methodology like the net present value is more used by companies (Schneider et al., 2008; Willigers & Hansen, 2008), relevance of RO method is growing up continuously and therefore it
probably becomes a new paradigm in investment decisions in short future (Coy, 1999; Perlitz et al.,1999; Copeland & Antikarov, 2001).
Background
R&D projects resemble a financial option to buy (call option) (Amram & Kulatilaka, 1999). They contain the right to acquire certain assets during certain period of time which is unknown “ex ante”, investing certain quantity of funds (capex). Likewise financial options they contemplate an underlying asset, strike price, time to expiry, uncertainty that accompanies the project itself (volatility) and time value of money (risk-free interest rate) .
Continuing the viewpoint of options approach to evaluate R&D projects, where investigation cost is a premium of R&D option and disbursements to carry out a project itself constitute the strike price. The pay-off of such an option depends on possible success of products commercialized and introduced into the market. The expected value depends on future cash flows that are going to generate a determined project of investment. This value is quite difficult to predict for R&D projects because consumers reaction regarding a new product or technology is unknown a priori (Black-Scholes, 1973). Neither precise moment of its discovery is known what diminishes credibility of any forecast. Simply, one option leads up in its nature to bring into existence other RO’s. Consequently, R&D project is in reality a compound option, since its exercise entails the entrance in the phase of introduction of a new product which usually sparks the existence of such real options as option to differ, abandon, expand, contract or exchange (Trigeorgis, 1996). They should also be reflected in total valuation of R&D projects in particular the option to commit to additional expenditures on advertising and developing a distribution network (Otto, 2000). The exercise price is an indispensable investment corresponding to future cash flows (capital expenditures). For R&D option exercise price is necessary to produce and commercialize new products or technologies once required patents are obtained. The time to expiry of R&D option is a period that remains up to the moment of a closure or opening of the possibility to carry out an investment through the payment of the exercise price (capex). Innovative activities are reflected in contemporary conceptions of technological innovations (Snieska & Vasauskaite, 2005; Vasauskaite et al., 2012), butthe firm concentrates more on improving financial results (Snieska & Venckuviene, 2011). Interpretation of innovation in business, industry as well as in public sectors is totally diverse (Daugeliene & Juocepyte, 2012). In the case of R&D option it is the time that remains until a company reaches that “eureka” moment of innovation or until any catastrophic event is occurred (Ottoo, 2000). In other words, that other competitors possibly might obtain patents or product/technology earlier or, by any reason, a product is not admitted to the market. In this case such option expires unexpectedly. Time to expiry of R&D option is unknown in the moment of its valuation (Ottoo, 2000). That is to say, the moment in which diverse R&D projects are finished is unknown; however, some methods exist to approach the above-mentioned term. This issue we will describe further presenting a duopoly model which is employed to valuate R&D projects. Also, the average historical project duration might be considered. That average may be calculated taking an industry data for
every particular sector. In addition, this method is complicated in the case of a completely innovative project. R&D in certain sectors (e.g. biotechnological) is a subject of bigger risk (Otto, 2002).
Duopoly model
As we have indicated earlier R&D projects can be perceived as a real option on expected innovation rents attributed to a new product or technology. This option is a call, and deduction of its value is based on the formula of Black & Scholes (1973) and Merton (1973)1. Nevertheless the duopoly model that we are going to utilize in our investigation involves the competition between two rival companies that compete with each other (Otto, 2000).
Fisher (1978) showed that expected rate of return on the hedge security is equivalent to risk-free rate of interest plus risk premium on the hedge security. It adjusts the model in terms of the competition between two rival companies that compete with each other (Otto, 2000).
Thus, we can derive probabilities of success for two companies utilizing one of the following techniques (Ottoo, 2000):
• Relative number of patents possessed by each company in its sector;
• If we do not have these numbers then we can use relative value of intangible assets for each company. Nevertheless, many companies do not itemize their patents in their accounting books or they use different "accounting criteria" so this method requires a very good knowledge of accounting;
• Another simpler method consists of estimating the percentage of R&D costs incurred by companies in the period of last couple of years compared with totality of the sector they belong to. It is assumed that certain quantity of the funds spent on R&D is later converted into a determined number of patents generated, adequate for each sector. To make the estimation even more precise, data of more than one year are used, smoothing out in this manner the effect of abrupt oscillations that could arise unexpectedly in a short period of time (in our study we use data from last 5 consecutive years).
However, probabilities should be estimated for paired companies, in other words, taking data for two closest competitors that compete with each other and then estimating their relative probability of success adjusted by their market concentration factor. For instance, EADS is the main Boeing’s competitor controlling appx. 65 % of the commercial aviation sector where they compete with each other. Among other important competitors are Lockheed Martin and BAE Systems. Even though there are many other companies in the entire sector of Aerospace/Defense, they compete for different market segments. Thus, relative probabilities of those two companies would be of 36,2 % and 28,36 % respectively.
Necessary data to carry out the subsequent calculations were collated utilizing Edgar database (2010),
1 V = Max[0,R(T) – K] where:
V = Pay-offs of R&D option
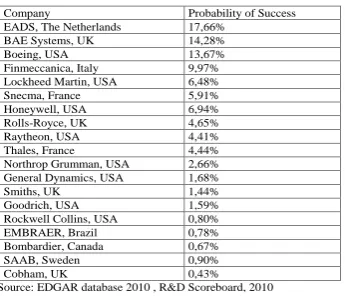
Table 1
Table 1. Probabilities of success for new R&D projects.
Company Probability of Success
EADS, The Netherlands 17,66%
BAE Systems, UK 14,28%
Boeing, USA 13,67%
Finmeccanica, Italy 9,97%
Lockheed Martin, USA 6,48%
Snecma, France 5,91%
Honeywell, USA 6,94%
Rolls-Royce, UK 4,65%
Raytheon, USA 4,41%
Thales, France 4,44%
Northrop Grumman, USA 2,66% General Dynamics, USA 1,68%
Smiths, UK 1,44%
Goodrich, USA 1,59%
Rockwell Collins, USA 0,80%
EMBRAER, Brazil 0,78%
Bombardier, Canada 0,67%
SAAB, Sweden 0,90%
Cobham, UK 0,43%
Source: EDGAR database 2010 , R&D Scoreboard, 2010
R&D projects generate certain number of patents which is characteristic for each sector. Nevertheless, a patent in a biotech sector and pharmaceutical is more valuable in comparison with other sectors because more money should be spent to generate it (Damodaran, 2004; R&D Scoreboard, 2010).
Table 2
Table 2: Number of Patents corresponding to the money spent on them (in different sectors)
Sector Nº of patents for each 20 m $ of R&D costs Electronic & electric 7,82
IT Hardware 7,73
Personal Care 6,70
Automotive Components 5,16
Chemical 4,38
Aerospace &Defence 3,44
Health 3,01
Programming & Services of
Computers 1,46
Automotive (vehicles) 1,20 Pharmaceuticals & Biotechnology 1,12 Source: EDGAR database 2010, R&D Scoreboard, 2010
Once we derive probabilities of success for each company, we can adjust the time to expiry in order then to study R&D options utilizing the duopoly model.
Consequently, time to expiry in our duopoly model approaches and probabilities of success depend on the relative number of patents pertaining to each company in its sector. For example a company that has 2000 patents in the sector that covers 20000 patents will have equal to 10 %. Further, if = 5 % then
t =( ( ) ( ))2
) (
H L
H
X f X f
X f
= 2
15 , 0
1 , 0
= 4, 44 (1) which means that time to expiry will be of 4.44 years. Risk of the project measures the uncertainty that accompanies the project, specifically to the future cash flows. For R&D projects of the companies that quote on a stock exchange, the risk is estimated through a "proxy" variable related to the price of common stock and variations of which reflect the uncertainty that accompanies to its future cash flows.
Time value of money is the “price” of money and it depends on the life length of a project. The more time requires the project, more risk it runs. Therefore, a higher rate is applied for long-term projects. Generally, the rate of return of Treasury Bonds is applied. Though a truly
risk-free asset exists only in theory, in practice most professionals and academics use short-dated government bonds of the currency in question (Dimson et al., 2002). For USD investments (Embraer and Bombardier), usually the US Treasury bills are used, while a common choice for EUR investments are German government bills or Euribor rates. The mean real interest rate of the US Treasury bills during the 20th century was 1 % p.a. (Dimson et al., 2002). Corresponding figures for Germany are inapplicable due to hyperinflation during the 1920s.) That's why our selection of the US Treasury Bonds for both US companies is the right one(see Figure 1).
Figure 1. Performance of Treasury Bonds with different maturities. Source: the author’s elaboration
For example, to valuate R&D project that requires 5 years, we should apply the rate of 4,12 %. The equation in which the duopoly model rests upon is the following one (Otto, 2000):
Gx =
) ( ) 0 ( ) ( { ) ( ) (
) (
2 1
1N d K N d
V r X f X f
X f
H L
H
e
t(
h
k) (2) whereis the probability of success of the company H (hightype),
is the probability of success of the company L (lowtype),
r is the risk free interest rate,
t is the time to expiry of the option; t constitutes the variable that is not known “ex ante” and only approximates this term.
t = ( )
1
H
X
f when the company investigated has a
monopoly
t = [ ( ) ( )]2
) (
H L
H
X f X f
X f
when the company
investigated has competitors
= price of the underlying asset; innovation rents that can be attributed to the discovery of a new product or technology (expected innovation rents).
dV1 = v
V1dt + v
V1dzv (3) where:
v
2
v
is the instantaneous variance of the expectedreturn;
dzv is the Gauss-Wiener process; describes the uncertainty that accompanies the project;
K (0) is capital expenditures incurred to obtain the new technology;
The exercise price has the following dynamics:
dK =
kKdt +
kKdzk (4)where: k
is the instantaneous expected rate of increase of theexercise price;
2
k
is the instantaneous variance of the exercise price;dzk is the standard Wiener process;
h
k
is the cost to insure the exercise price (excess of the rate of return of the hedge security assets over the rate of return of the exercise price); alpha is the equivalent of the risk free interest rate;
h
is the equivalent to the risk free interest rate plus (
h) premium on the hedge security;The real option that is evaluated is a call with uncertain exercise price that follows a diffusion process. To solve its stochastic character this term is insured utilizing the asset that is called a hedge security. It compensates unexpected changes of the exercise price. This is possible when stochastic changes of the hedge security are perfectly associated with stochastic component of changes in the exercise price (Fisher, 1978). This is the reason that justifies the replacement of the risk free interest rate by this factor.
, represent bivariate cumulative normal distributions in points and respectively]:
(5)
In other words, , might be perceived as probabilities reflecting that our RO will expire in value. Thus, , values close to 1 reflect that R&D projects have a big probability of success. In the case of Embraer and Bombardier these two N()’s took value of 0,99997815 and 0,99975067 respectively.
The conditional volatility that we use to obtain is:
k v vk
k
v2
2
2
(6) Subsequently we employ this model for Embraer and Bombardier case. These two companies perfectly fit to our duopoly model as they directly compete with each other in the segment of small commuter 70-seat aircrafts (Embraer 145, Embraer 170 and CRJ200 CRJ700 respectively).
Valuation of opportunities of growth. Case of
Embraer and Bombardier
Embraer - “Empresa Brasileira de Aeronáutica S.A.” - engages in the development, production, and sale of jet and turboprop aircrafts for civil and defense aviation markets. The Family of aircrafts Embraer commercialize consists of the E-Jets Series, comprising the Embraer 170, 175, 190 and 195 aircrafts. With the latter one, Embraer advanced to the 70-110 seat market. The inaugural flight of the first model, the Embraer 170, was made on 19 February 2002. The main rival company of Embraer is Canadian Bombardier.
Bombardier Inc. is the third largest aircraft company in the world in terms of yearly delivery of commercial airplanes overall, and the fourth largest in terms of yearly delivery of regional jets. Bombardier's most popular aircraft currently include its Dash 8, CRJ100/200/440, and CRJ700/900/1000 lines of regional airliners. Bombardier also has an assembly plant, for its future C-series aircraft, which Bombardier is marketing as a replacement for aging DC-9, MD-80 and early, smaller versions of the Boeing 737. This new jet competes with the Boeing 737–600, Boeing 737–700, Airbus A318 and Airbus A319 and Embraer 195. Bombardier claims the C-series, which the company will offer in 110-seat and 130-seat versions, will burn at least 20 % less fuel per trip than its "nearest" Embraer competitor and achieve "high 20s (percentage) savings" vs. the Boeing 737–600 or -700.
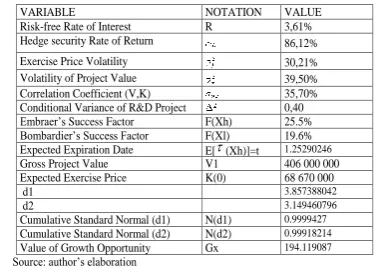
As we can see these two companies are direct competitors and perfectly fit to our duopoly model. Further, we show calculations of the value of R&D option for Embraer in terms of the model presented previously (see Table 3)2.
Table 3 Table 3: Valuation Worksheet for EMBRAER.
VARIABLE NOTATION VALUE
Risk-free Rate of Interest R 3,61%
Hedge security Rate of Return 86,12%
Exercise Price Volatility 30,21%
Volatility of Project Value 39,50%
Correlation Coefficient (V,K) 35,70%
Conditional Variance of R&D Project 0,40 Embraer’s Success Factor F(Xh) 25.5% Bombardier’s Success Factor F(Xl) 19.6% Expected Expiration Date E[(Xh)]=t 1.25290246
Gross Project Value V1 406 000 000
Expected Exercise Price K(0) 68 670 000
d1 3.857388042
d2 3.149460796
Cumulative Standard Normal (d1) N(d1) 0.9999427 Cumulative Standard Normal (d2) N(d2) 0.99918214 Value of Growth Opportunity Gx 194.119087 Source: author’s elaboration
Continuing the example of Embraer and Bombardier, we carried out a study of the performance of the dependent term (variable), applying changes of independent variables and presenting results in the shape of a distribution through the simulation of Monte Carlo. In our example R&D projects valuation is Gx = 191,11millions $US and this is
2
more realistic value of R&D option for Embraer as MCS is the technique that reduces the uncertainty involved in estimating future outcomes
R&D option considered as a compound option
Embraer/Bombardier as well as other companies should regard another type of real options previously mentioned. In other words, options to delay an investment, options to abandon, options to contract and to expand. All of these real options make up the value of a company. Above all the option to expand should be factored in because it substantially augments the future innovation rents, or said in another way, future investments in publicity and marketing that will take place at some stage, say, in time (after discovering and patenting a product/technology) will obviously lead up to a higher cash flows ( will exchange for ). This is the option of growth and it could be expressed through the following formula:
M (V2, V1,
, t2) = max [V2 – V1, 0] (7)where:
M is the premium of the option to expand; signifies the costs of marketing;
is the price of the underlying asset for this option: expected rents that assume certain expenditures on marketing (if we invest M, then changes by , );
is the exercise price (previous expected rents); R&D option value is then:
GM = V2 N(d3) – V1N(d4) (8) where:
d3 =
t
t
t
t
V
V
2 2 1 2
) ( ln
y d4 = d3 - ρ
t
2t
2 22 2 2
2
2
v v
v
Compound option can be expressed as: GH = GX +GM ert2(9) Further,
GH =
) ( ) 0 ( ) ( { ) ( ) (
) (
2 1
1N d K N d
V r X f X f
X f
H L
H
e
t(
h
k)+
e
tr
2
[ V2 N(d3) – V1N(d4)] (9)
Nevertheless the objective of this analysis does not consist of taking into account all the potentially implied RO’s of the company subject of our study (would be impossible due to lack of necessary data), but simply to center us in the study of the RO’s incorporated in R&D projects which constitutes the more practical approach and obviously of a greater importance.
Methodology and Discussion
Database
We carry out this empirical study mostly to enhance our findings in terms of managerial uncertainty when it
comes to R&D projects. Thus we are using a larger sample analysis expecting that we will arrive at a certain conclusions that will let us better understand R&D projects management. The data utilized in this study were collected using EDGAR- DATABASE 2010. EDGAR is a database for the US Security and Exchange Commission filings required for publicly traded companies. Also, some data were taken from R&D Scoreboard, 2010. In the investigation we use data of 285 companies that are traded on world financial markets with the highest R&D costs in the year 2010. The database contains the following information for each company (data that let us estimate R&D options values for each company on a separate basis). These are: share price , capitalization, sales in the last three or four years, forecasts of sales for the next year – pessimistic and optimistic, expected innovation rents, probability of success on the part of both companies investigated and their main competitors, derived expenditures of the implementation of new technologies/products (capital expenditures) from the last three or four years, R&D costs in the last five years, minimum and maximum price of a common stock in the last year and projects volatilities (volatility of the price of a common stock).
Based on (Singh & Vives, 1984; Newton et al., 2004) in our statistical analysis we also use other data such as goodwill, proportion of money, proportion of indebtedness, tangible assets, intangible assets, Herfindahl-Hirschm index, number of workers, efficiency of work, cost of own capital, P/E, Franchise Factor, B/V in order to study their relations with opportunities of growth contained in R&D options, VAOC and capitalization of investigated companies. These data are employed in our statistical analysis for the purposes of reflecting the division into two groups of companies – SMC and Blue Chips (Singh & Vives, 1984). Our investigation will discover whether there are any significant issues regarding the size of a company in terms of its R&D projects management. We recall that it might be of a certain importance when coupled with the agency costs that often arise in bigger companies (Jensen and Meckling, 1976; Piper and Weinhold, 1982).
Accounting Adjustments
The rules of above-mentioned accounting applied to extract some financial data utilized in this investigation present certain objections as they leave a quite extensive degree of the flexibility for financial accountants in classifying the R&D and other intangible assets and this consists above all in different ways of recognition of these terms. Therefore, we carry out our own analysis and we decipher of what these financial data consist.
Descriptive Study
Our focus will be on the six most numerous sectors: Semiconductors, Biotechnologies, Programming & Software, Communication, Chemical and Medical Equipment (see Figure 2).
14% 12%
11% 7% 5% 4%
47% Semiconductors
Biotechnology
Programming & Software Communication Systems
Figure 2. Sectors of the highest importance
In the last years the total value of R&D costs for 285 companies subject to our investigation (representative sample for all population of companies) follows a strong upward trend.
Characteristics of R&D Options
Our findings indicate that majority of companies (279) have their R&D options "in the money", which means that their expected innovation rents that can be attributed to R&D exceed derived expenditures of the implementation of future technological innovations.
Further, in 166 cases R&D projects were not evaluated above their option’s premium. This may reflect that managers of these companies do not manage R&D projects properly (deployment of new technologies/products is very expensive) but it is also possible that some of the data used in this study, as for example the expected innovation rents (projected in analytical estimations) have not yet reflected the influence of those technological innovations. In other words, R&D projects by their nature can lead to an unexpected discovery (they contain a “eureka” factor), the one that itself cannot be evaluated a priori considering only the data from previous years. We should also emphasize that only 10 companies had their value of R&D option equal to zero. These companies lose their resources spent for R&D projects or simply the analysts are not yet capable of properly predicting the future sales with respect to the innovations.
All in all, R&D projects add value to the companies since according to the calculations obtained compound valuations of R&D options for all the companies
investigated exceeded the values of their R&D costs plus expenditures that correspond to their implementations.
Hypotheses
Formulation of hypotheses constitutes a proposal with respect to some empirical elements and other concepts and their mutual relations that emerge beyond the facts and known data, for the purpose of arriving at a greater comprehension of these ones. In this study 4 hypotheses (H1-H4) are formulated and they permit to derive some objectives in our investigation.
Hypothesis 1 (H1): Performance of R&D projects remains very well explained by the factors that served us to value R&D options and certain size-of control factors (number of workers, efficiency of work, market concentration) because these ones reflect managerial agency costs. Some of the variables were left the same as we used for the calculation of ROs value. We add several variables to better fit the model. D/A, C/A, GW CF, HH,
N, L are added to reflect the level of debt or cash in companies subject to our investigation. SMC's are in majority of cases severely indebted whilst larger Blue Chip companies have excessive cash flows which might bring into existence the agency costs, the problem we marked in the introduction of this paperwork. GW reflects a division for large and small companies and the number of patents they might be in possession. HH reflects market concentration. Further, N and L are two variables controlling the number of employees and the efficiency of workforce which in bigger companies should be lower due to formalization and bureaucracy problems). Also for SMC evaluating (R&D) has been revealed as weak and insufficient. In contrast, medium and large companies evaluate R&D as developed and very developed (Kanovska & Tomaskova, 2012). We wonder whether these factors affect the value of R&D projects.
The main objective in any statistical elaboration is a construction of a good model. This occurs when the variability of independent variables explains a higher percentage of the variability of the dependent term (in this study the value of R&D option) and when in a model the problems of heteroscedasticity, autocorrelation and multicollinearity do not appear. In other words, some serious errors that reduce the importance of the results are not committed. Appropriate variables of the model are selected so that the investigation is good. In this model we introduce variables that exert significant influence on the value of R&D option and indicate the difference among various groups of companies in terms of managerial uncertainty and agency costs.
Hypothesis 2 (H2): R&D costs that reflect own investments in R&D influence positively in the value of R&D projects for SMC and negatively in the Blue Chips.
R&D costs represent opportunities of growth only in the group of SMC and these projects add value to these companies. The opposite occurs in the group of Blue Chips. In this group when a company invests in its own R&D projects it actually diminishes its opportunities of growth due to agency costs.
Hypothesis 3 (H3): Valuation of companies depends on the value of R&D projects and pending patents that these companies possess or are expecting (reflected in intangible assets).
R&D projects augment the value of future sales. Further, they maintain certain percentage of sales pertaining to the past. Assume that a company X belonging to automotive (vehicles) sector remains behind its rivals and does not develop and investigate any new designs for its cars. Such a company refraining itself from investing in R&D would lose bit by bit its percentage in the market. Therefore, the company X would presumably diminish its sale (year after year). In other words, companies that consider their R&Ds as a key-factor in their strategies can maintain themselves always in the top of the product’s life cycle (maintaining large mark-ups).
products rather on their own investments in R&D which later become patents while Blue Chips buy other companies or they participate in a capital of other companies already with an access to new technologies and patents which helps them to manage their excessive cash more efficiently and evade agency costs.
In the group of SMC own patents influence positively the component of future growth. Nevertheless patents of affiliated companies affect negatively that component in this group of companies. On the other hand, in the group of Blue Chips the contrary thing occurs: own patents affect negatively the component of future growth and patents of affiliated companies influence positively in this term. SMCs support their R&D projects rather on their own investments while Blue Chips buy other companies that already have access to new technologies (with "know-how").
Methodology of Investigation
The methodology of this analysis consists of statistical analysis which main objective is to show that, in reality, not only in theoretical models a relation between the variables of the previous model exists and those above-mentioned variables explain the value of R&D option. R&D option can be presented as a function of the following variables:
Gt = Gt (V, P, K, X,
v,
k,
, D/A, C/A, CF, GW, N, HH, L) (10)The model that we employ could be denoted through the following equation:
Gt = γ +
1V +
2Px +
3Py +
4(I+D) +
5K +
6σv +
7
+
8
v,k +
9C/A +
10D/A +
11GW +
12CF +
13HH +
14N+
15L +
t (11)where V, P, K, X, D/A, C/A, CF, GW, N, HH, L we define as before, except that Y is defined as R&D of other companies from the same sector.
To apply the model we use the data collected from Edgar database. EDGAR is a database for the US Security and Exchange Commission filings required for publicly traded companies. Also, some data were taken from R&D Scoreboard, 2010.
Results of investigation
The results of the analysis that we carry out are supported in several regressions and they are obtained from endogenous variables (R&D option value, VAOC and capitalization) that are regressed on each one of potentially explanatory variables (the same test is carried out in three groups, in other words, for all companies, SMC and Blue Chips).
In our investigation we have obtained the following results that reflect performance of R&D projects: (see Table 4).
Table 4
Relation among the value of R&D option with the variables that influence in the option VARIABLE ALL SMC BLUE
CHIPS Expected Innovation Rents 0.25 *** (0.01) 0.15 *** (0.01) 0.25*** (0.01) Probability of success(I) 58.43 *** (7.77) 5.65** (1.97) 68.72 *** (14.92) Probability of success(C) -35.82*** (5.21) -2.08* (0.97) -43.90 ** (5.20) R&D Costs -0.26 ***
(0.06)
0.10** (0.04)
-0.23 * (0.12) CAPEX 0.28 ***
(0.06)
0.17 * (0.08)
0.28 * (0.11) Volatility of the
underlying asset -0.72 (1.40) -0.15 (0.11) -4.28 (6.20) Alpha 0.51
(0.63)
4.74 (4.76)
140.47 (234.41) Correlation (v,k) -31.79
(49.18)
-0.16 (4.49)
-81.04 (143.69) C/A (Cash/Assets) -139.59
(189.26)
-12.14 (16.46)
-746.09 (689.75) D/A (Debt/Assets) -30.81
(179.07) 18.72 (16.24)
-396.01 (612.87) Goodwill 0.03 ***
(0.01) -0.00 (0.01) 0.0312* (0.015) CF (Operative
Benefits + R&D)
0.08 ** (0.03) 0.048** (0.01) 0.064 (0.05) Herfindhal-Hirschman Index -1.87 (28.31) -1.92 (3.42) 82.31 (92.34) N. of employees -0.001
(0.00)
-0.001 (0.00)
-0.001 (0.00) Work efficiency 259.59 *
(113.37) 17.14 (21.88)
405.13 (251.10)
Standard errors of the statistics in parenthesis. Two-tailed test of t-student is applied. * P <0.05; **p <0.01; ***p <0.001; p stands for p-value and
the asterisks *, **, *** stand for statistically significant results.
According to the results presented in Table 4 the following variables: expected innovation rents, probability of success (I), CAPEX, coefficient alpha, CF and efficiency of work influenced positively the value of R&D option. However, only coefficients of the first three above-mentioned variables were statistically significant in all groups subject to our investigation (CF only in the SMC group). The probability of success for a “rival” company, volatility of the project, proportion of cash C/A (cash/assets) and number of workers influenced negatively (only the success factor coefficient was statistically significant). R&D costs, proportion of indebtedness D/A, index HH and the goodwill provide different results for each group of companies. R&D costs and D/A influenced positively the value of R&D option for SMC and negatively for the Blue Chips.
Further, the result is significant for the coefficient of R&D costs in both groups and the hypothesis 2(H2) can be accepted with a sufficient degree of credibility. On the other hand, Herfindahl-Hirschman index and goodwill present negative coefficients of regression associated with the value of R&D option for the group of SMC and positive in the group of Blue Chips (only coefficient of goodwill for Blue Chips was statistically significant).
(regressions of the dependent term when regressed on each one of the explanatory variables on a separate basis) were statistically significant.
Another quite important issue is that volatility of the project (which is contradictory to the Black-Scholes model) influenced negatively the value of R&D option (although results were not statistically significant). This happens because majority of the projects have very high intrinsic values, in other words, the options analyzed were "deep in the money". Given the equation: Company’s Valuation = Value of existing products + Value of patents + Value of future R&D projects (Damodaran, 2004), we carry out another cross-sectional regression to study the influence of the value of R&D option (value of future R&D projects) and intangible assets plus the goodwill (own patents and patents of affiliated companies) on company’s valuation (see Table 5).
Table 5
Influence of R&D projects and patents in the performance (Market Value) of companies
VARIABLE ALL SMC BLUE CHIPS
Constant 5600.36***
(1426.46)
1060.81*** (85.76)
17084.73*** (4062.04) R&D Option Value 11.47***
(0.56)
0.51 (0.45)
10.82*** (0.91) Intangible Assets (reflect
patents)
1.68*** (1.68)
0.92*** (0.17)
1.47*** (0.28)
Standard errors of the statistics in parenthesis. Two-tailed test of t-student is applied. ***P <0.001; p stands for p-value, *** stands for
statistically significant results.
The results reveal that for each group of companies the value of R&D option and value of patents (own patents and those of affiliated companies) are related positively with company’s valuation because all the results are significant except the coefficient of the value of R&D option for SMC (see Table 6). This supports the hypothesis 3 (H3) with a sufficient degree of credibility. The hypotheses H3 and H2 are not contradictory (although they seem to be) since the last one (H2) is connected rather with the relations between R&D costs and the valuation of R&D projects and the H3 corresponds to the influence that the value of R&D projects and patents (own or other) exert on the total valuation of the company. In other words, the evidence that R&D costs only promote opportunities of growth for SMC and not for Blue Chips does not deny another type of evidence for this last group of companies that stands for a positive relation of a company’s valuation with its R&D projects value (although we expected the opposite).
Further, we present results of another regression where the value of opportunities of growth is portrayed as a function of intangible assets (patents) and goodwill (patents and intangible value of companies that pertain to their parent-companies) (see Table 6).
Table 6
Influence of intangible assets and goodwill in VAOC. Comparison among SMC and Blue Chips VARIABLE SMC BLUE CHIPS Constant 1004.85***
(94.19)
8079.33* (3590.05) Intangible Assets (own
patents)
2.88*** (0.59)
-2.28** (0.76) Goodwill (other patents) -0.02
(0.27)
2.22 *** (0.47)
Standard errors of the static in parenthesis. Two-tailed test of t-student is applied. * P <0.05; **p <0.01; ***p <0.001; p stands for p-value *, **,
***, stand for significant results statistically.
Also, the results of our study support hypothesis (H4), because coefficients of intangible assets (positive) and goodwill (negative) for SMC indicate that these companies support their opportunities of growth rather by starting new R&D investments on their own (if this was not the case, then these companies would presumably diminish their opportunities of growth). The contrary occurs when it comes to the Blue Chips where coefficients were the opposite. Besides, the test of Chow (see Table 7) confirms that the model built by the subset of companies with the lowest capitalization and the model that includes all the companies subject of the study are significantly different. In other words, they have different coefficients of regression (break even for 90 companies with lower capitalization). This reflects that the relation between the opportunities of growth (VAOC) and the variable “intangible assets” and goodwill is different for SMC.
Table 7
Comparison of different models that are made up of different subsets of the same sample (test of Chow)
Chow Breakpoint Test: 90
F-statistic 2.13 Probability 0.077
Log likelihood ratio 8.66 Probability 0.07
Conclusions
In this paperwork some real options frameworks were demonstrated to value R&D projects. We focused on the case of Brazilian Embraer and its main competitor Canadian Bombardier. In order to value Embraer’s R&D projects we employed a duopoly model which reflected some flexibility factors and the competition between both rival companies subject of our investigation.
We also present a duopoly model for R&D options for these two rival companies that compete with each other, testing several formulated hypotheses.
The main objective behind our Hypothesis 2 was to demonstrate that R&D costs (premiums of R&D options) affect positively R&D projects values for SMC with capitalization below 1 billion US$ and negatively in the group of Blue Chips mainly due to the agency costs. The Hypothesis 3 supported the possibility that R&D projects and patents possessed by investigated companies form part of the valuation of those and affect positively R&D projects valuation. In the Hypothesis 4 we highlighted the supposition regarding own patents and other patents belonging to affiliated companies and controlled by a parent company and their possible influence on the opportunities of growth. We also demonstrated different results for SMC and for Blue Chips. The investigation that we carried out supported all formulated hypotheses.
The results of our investigation provide evidence that the component of future growth, which forms part of the value of a company, depends on the number of patents pertaining to companies and newly started R&D projects which subsequently will become patents possessed by those companies. Our results indicate significant difference between SMCs and Blue Chips. Basically, SMC tend to start new R&D projects on their own while Blue Chips buy other companies that already have access to new technologies. Further, R&D costs only represent opportunities of growth for SMCs. This reflects that R&D
costs affect positively the value of R&D projects only in this group of companies. On the other hand, in the group of Blue Chips the opposite is the case because R&D costs influence negatively R&D projects, which means that they do not represent such opportunities of growth. The Blue Chips base their access to new technologies rather through buying other companies that already have "know-how", whilst SMCs start new projects. SMCs do not buy other companies and if this was the case, then they would presumably diminish their opportunities of growth. Also, this research study provides empirical evidence through descriptive statistics and econometric investigation. We proved that R&D projects add value to companies (in both groups of companies).
The hypothesis 3 (H3) was supported with a sufficient degree of credibility. This hypothesis (H3) is not contradictory (although it might seem to be) to the hypothesis 2 (H2) as the latter corresponds rather to the relation between R&D costs and valuation of R&D projects and H3 corresponds to the influence that R&D projects and patents (own or other pertaining to associated companies) exert on total valuation of companies. Besides, the results of our investigation may contribute to the management of R&D projects as we indicate which environmental factors favour R&D projects in terms of their valuation.
References
Amram, M., & Kulatilaka, N. (1999). Real Options. Cambridge, Mass: Harvard Business School Press.
Black, F., & Scholes, M. (1973). The pricing of options and corporate liabilities. Journal of Political Economy, 81, 637– 659. http://dx.doi.org/10.1086/260062
Carr, P. (1988). The valuation of sequential exchange opportunities. The Journal of Finance, 43, 1235–1256. http://dx.doi.org/10.1111/j.1540-6261.1988.tb03967.x
Copeland, T., & Antikarov, V. (2001). Real Options: A Practitioner’s Guide, New York: Texere Publishing Limited. Cox, J., Ross, S., & Rubinstein, M. (1979) Option pricing: A simplified approach. Journal of Financial Economics, 7,
229–263. http://dx.doi.org/10.1016/0304-405X(79)90015-1 Coy, P. (1999). Exploiting uncertainty. Business Week, 3632, 118–123.
Daugeliene, R., & Juocepyte, S. (2012). The evolvent of criteria for assessment of innovation expression in the state level. Inzinerine Ekonomika-Engineering Economics, 23(2), 154–162. http://dx.doi.org/10.5755/j01.ee.23.2.1540
Damodaran, A. (2004). Application of option pricing theory to equity valuation. New York: NYU’s Stern School of Business.
Dimson, E., Marsh, P. & Staunton, M. (2002). Triumph of the Optimists. Princeton: Princeton Universtity Press. Dixit, A., & Pindyck, R. (1994). Investment under Uncertainty. Princeton: Princeton University Press.
Fisher, S. (1978). Call options pricing when the exercise price is uncertain, and the valuation of index bonds. Journal of Finance. 33(1), 169–176. http://dx.doi.org/10.1111/j.1540-6261.1978.tb03396.x
Edgar Database (2010). [online] http://www.sec.gov/edgar.shtml
Graham, J., & Harvey, C. (2001). The theory and practice of corporate finance: Evidence from the field. Journal of Financial Economics, 60, 187–243. http://dx.doi.org/10.1016/S0304-405X(01)00044-7
Geske, R. (1979). The value of compound options. Journal of Financial Economics, 7, 63–81. http://dx.doi.org/10.1016/0304-405X(79)90022-9
Jensen, M. C., Meckling, W. H. (1976).Theory of the Firm: Managerial Behavior, Agency Costs and Ownership structure. Journal of Financial Economics, 3(4), 305-360. http://dx.doi.org/10.1016/0304-405X(76)90026-X
Kanovska, L. & Tomaskova, E. (2012). Interfunctional Coordination at Hi-Tech Firms. Inzinerine Ekonomika-Engineering Economics, 23(1), 70–76.
Margrabe, W. (1978). The value of an option to exchange one asset for another. Journal of Finance, 33, 177–186. http://dx.doi.org/10.1111/j.1540-6261.1978.tb03397.x
Mileris, R., & Boguslauskas, V. (2011). Credit Risk Estimation Model Development Process: Main Steps and Model Improvement. Inzinerine Ekonomika-Engineering Economics, 22(2), 126–133
Miller, L., & Bertus, M. (2005). License valuation in the aerospace industry: A real options approach. Review of Financial Economics, 14, 225–239. http://dx.doi.org/10.1016/j.rfe.2005.04.001
Newton, D. P., Paxson, D., & Widdicks, M. (2004). Real R&D options. International Journal of Management Reviews, 5– 6, 113–130. http://dx.doi.org/10.1111/j.1460-8545.2004.00099.x
Ottoo, R. E. (2000). Valuation of corporate growth opportunities: a real options approach. New York & London: Garland Publishing, Inc.
Ottoo, R. E. (2002). Financing policy and the underinvestment problem of new business ventures. The Annual conference Academy of Entrepreneurial Finance, [paper online] http://www.aoef.org/papers_2002.htm
Perlitz, M., Peske, T., & Schrank, R. (1999). Real options valuation: the new frontier in R&D project evaluation? R&D Management, 29(3), 255–269. http://dx.doi.org/10.1111/1467-9310.00135
Piper, T. R., & Weinhold, W. A. (1982). How much debt is right for your company? Harvard Business Review, July/August, 153–167.
R&D Scoreboard. (2010) [database online] http://www.innovation.gov.uk/rd_scoreboard/downloads/2010_rd_scoreboard_ analysis.pdf
Schneider, M., Tejeda, M., Dondi, G., Herzog, F., Keel, S., & Geering H. (2008). Making real options work for practitioners: a generic model for valuing R&D projects. R&D Management, 38(1), 85–106. http://dx.doi.org/10.1111/ j.1467-9310.2007.00500.x
Snieska, V., & Vasauskaite, J. (2005). Innovations in Enlarged European Union from the Point of Innovation Diffusion Theory. Inzinerine Ekonomika-Engineering Economics(2), 96–105.
Snieska, V., & Venckuviene, V. (2011). Hybrid Venture Capital Funds in Lithuania: Motives, Factors and Present State of Development, Inzinerine Ekonomika-Engineering Economics, 22(2), 157–164. http://dx.doi.org/10.5755/j01.ee. 22.2.312
Singh, N., & Vives, X. (1984). Price and Quantity Competition in a Differentiated Duopoly. The RAND Journal of Economics, 15(4), 546–554. http://dx.doi.org/10.2307/2555525
Trigeorgis, L. (1996). Real options: Managerial flexibility and strategy in resource allocation. Cambridge: MIT Press. Vasauskaite, J., Mihi, A., & Venclauskiene, D. (2012). Evaluation of reasons for decision to implement new technologies
in Lithuanian manufacturing enterprises. Economics and Management, 17 (2), 615–623. http://dx.doi.org/10.5755 /j01.em.17.2.2189
Willigers, B. J. A., & Hansen, T. L. (2008). Project valuation in the pharmaceutical industry: a comparison of least-squares Monte Carlo real option valuation and conventional approaches. R&D Management, 38(5), 520–537. http://dx.doi.org/10.1111/j.1467-9310.2008.00530.x
Dominik Metelski, Antonio Mihi-Ramirez, Jesús Arteaga-Ortíz
Tyrimo ir plėtros projektai realių alternatyvų požiūriu
Santrauka
Šiame tyrime analizuojamos realios galimybės pasirinkti ir įvertinti metodą, kuris pagrįstas dviejų konkuruojančių kompanijų konkurencijos analize. Taip pat siekiama nustatyti jų mokslinių tyrimų bei plėtros darbų (MTEP) projektų vertę, nustatant ryšį tarp MTEP pasirinkimo galimybės ir kai kurių kintamųjų, tokių kaip santykinė inovacijos tikimybė, kapitalo sąnaudų lygis, laukiama inovacijos renta, naujų technologijų diegimo sąnaudos, pinigų santykis, įsiskolinimo santykis, einamieji grynųjų pinigų srautai, kompanijos filialų patentai bei tam tikri valdymo aspektai, tokie kaip darbuotojų skaičius, rinkos koncentracija ir darbo našumas. Pasirinkimo galimybių metodas numato, kad bet koks kolektyvinis sprendimas investuoti arba atsiimti lėšas yra vertinamas paprasčiausiai kaip galimybė rinktis (Miller ir Bertus, 2005). Pasirinkimo galimybės remiasi metodais, kurių aktualumas pastaruoju metu nuolat didėja. Todėl šio darbo tikslas yra nustatyti dviejų pasirinktų kompanijų MTEP projektų vertę.
Šiame darbe nagrinėjama MTEP sąnaudų svarba mažoms ir vidutinėms įmonėms (MVĮ) ir Blue Chip kompanijoms (t. y. garsioms ir finansiškai stabilioms kompanijoms) Analizei naudojome tipinį, į tarptautinių finansų rinkų sąrašus įtrauktų, kompanijų pavyzdį. Dažniausiai, dėl agentinių kaštų, didelės kompanijos yra linkusios iššvaistyti savo perviršinį laisvą kapitalą, kai tuo metu MVĮ, priimdama sprendimus dėl investavimo, elgiasi daug protingiau.
Taip pat šiame darbe pateikiamas bipolinis modelis MTEP pasirinkimo galimybėms bei modelio pritaikymui Brazilijos kompanijos Embraer ir Kanados kompanijos Bombardier atveju. Tai daroma norint patikrinti kelias iškeltas hipotezes. 1) MTEP projektų vykdymą labai gerai paaiškina veiksniai, kurie yra kaip MTEP pasirinkimo galimybių vertė, tam tikri dydžio/kontrolės veiksniai (darbuotojų skaičius, darbo našumas, rinkos koncentracija), nes jie atskleidžia vadovavimo agentinius kaštus. 2) MTEP kaštai, kurie atspindi savas investicijas į MTEP, daro teigiamą įtaką MTEP projektų vertei MVĮ atveju ir neigiamą įtaką Blue Chips kompanijų atveju. 3) Kompanijų vertinimas priklauso nuo MTEP projektų ir patentų, kuriuos šios kompanijos yra įsigijusios arba kurių įsigijimo laukia (matyti nematerialiame turte). 4) Nuosavi patentai ir kiti patentai, priklausantys kompanijos filialams ir valdomi pagrindinės kompanijos, daro įtaką augimo galimybėms, nors MVĮ ir Blue Chips kompanijų atvejais, rezultatai skiriasi.
Remiantis Singh ir Vives (1984) bei Newton ir kt. (2004), šioje statistinėje analizėje panaudoti ir kiti duomenys, pvz.: geranoriškumas, pinigų santykis, įsiskolinimo santykis, materialus turtas, nematerialus turtas, Herfindahl-Hirschm indeksas, darbuotojų skaičius, darbo našumas, nuosavo kapitalo kaina, P/E (kainos ir pelno akcijai santykis), Franšizės veiksnys, B/V.
Šiame tyrime tirtos 285 kompanijos, kurių akcijomis prekiaujama pasaulio finansų rinkose ir kurios turi didžiausius MTEP kaštus 2010 metais. Jos pateikia labai naudingos informacijos apie požiūrį į vadovavimą. Tokiu būdu, kalbant apie hipotezę 1, galima teigti, jog gauti rezultatai patvirtina, kad MTEP projektai priklauso nuo įvairių veiksnių, tarp jų: laukiamos inovacijos rentos, dviejų konkuruojančių viena su kita kompanijų sėkmės tikimybių, sąnaudų, atsiradusių dėl naujų technologijų diegimo, draudimo įmokų, reikalingų apsidrausti nuo sąnaudų nevienodumo, kurios atitinka tų naujų technologijų diegimą, pinigų santykio, įsiskolinimo santykio, einamųjų grynųjų pinigų srautų, kompanijos filialų patentų, darbuotojų skaičiaus, rinkos koncentracijos ir darbo našumo. Kalbant apie hipotezę 2, rezultatai parodė, kad MTEP kaštai (MTEP pasirinkimo galimybių draudimo įmokos) daro teigiamą įtaką MTEP projektų vertei MV įmonėse, kai kapitalizacija mažesnė už 1 milijardą JAV dolerių, ir neigiamą įtaką (daugiausiai dėl agentinių kaštų) Blue Chip grupės kompanijose. Hipotezė 3 patvirtino galimybę, kad nagrinėtų kompanijų MTEP projektai ir turimi patentai turi nemažą įtaką vertinant jas. Rezultatai taip pat patvirtino 4 hipotezę , kad savi patentai ir kompanijos filialams priklausantys, ir pagrindinės kompanijos valdomi patentai, daro įtaką augimo galimybėms.
Taigi tyrimo rezultatai įrodo, kad būsimojo augimo sudėtinė dalis, kuri turi įtaką vertinant kompanijas, labai priklauso nuo patentų skaičiaus ir naujai pradėtų MTEP projektų, kurie vėliau tampa tų kompanijų turimais patentais. Mūsų rezultatai atskleidė nemažą skirtumą tarp MVĮ ir Blue Chips
kompanijų. Dažniausiai MVĮ yra linkusios pačios pradėti naujus MTEP projektus, o Blue Chips perka kitas kompanijas, jau turinčias priėjimą prie naujų technologijų. Be to, MTEP kaštai atkleidžia tik augimo galimybes MV įmonėms. Tai parodo, kad MTEP kaštai daro teigiamą įtaką MTEP projektų vertei tik šioje kompanijų grupėje. Antra vertus, Blue Chips kompanijų grupėje yra priešingai. MTEP kaštai daro neigiamą įtaką MTEP projektams, todėl jos nerodo tokių augimo galimybių. Blue Chips kompanijos savo priėjimą prie naujų technologijų pagrindžia daugiausia per kitų kompanijų, turinčių
„know-how“ pirkimą, kai tuo metu MVĮ pradeda naujus projektus. MVĮ neperka kitų kompanijų, o jei taip ir būtų, tada jos tikriausiai sumažintų savo augimo galimybes.
Raktažodžiai:inovacija ir moksliniai tyrimai bei projektavimo-konstravimo darbai, finansinis valdymas, lyginamoji verslininkystė, realios pasirinkimo galimybės.