Forecasting of River Sediment Amount using
Machine Model
Fatih ÜNEŞ
1,
A. Burhan KARAEMİNOĞULLARI
1, Bestami TAŞAR
11
Department of Civil Engineering, Iskenderun Technical University, Turkey Corresponding author. Email: [email protected]
Abstract— Accurate estimation of sediments is important in river structures. The amount of suspended sediments is mostly determined by measurements from observation stations, sediment k ey curve, artificial intelligence modeling methods. In this study, the estimation of the sediments content was performed by using hydrometeorological parameters such as river flow, air temperature and precipitation measured between 2011 -2017 at Omaha Station in Nebrask a. For the estimation of sediments amount, Support Vector Machines ( SVM) and Generalized Regression Neural Network (GRNN) methods were used. These models were compared by using correlation coefficient (R), mean absolute error (MAE) and root of mean square errors (RMSE). When the measurement and model results were comp ared, SVM and GRNN models gave consistent results in the estimation of sediments content in rivers. Nevertheless, the SVM method showed slightly better correlation and lower error performance than the GRNN method.
Keywords—Sediment, Prediction, Support vector machine,Generalized regression neural network.
I. INTRODUCTION
In water resources engineering; Accurate estimation of sediment transported in rivers is of particular importance for the design and planning of river structures. Sediments such as rock fragments, gravel and sand carried by rivers are formed by scraping from the river basin or river bed. The sediment movement is complex and differs according to the topography, geological condition and flow characteristics of the basin. Determining the amount of sediment transported in the regulation of transportation network operations such as flood control and transportation in determining the reservoir volume, selection of water intake and type is an important engineering study. If not taken into consideration; It reduces the capacity of the hopper, leads to clogging of the mouth of the intake structure and shortens the economic life of the plants and leads to material losses. Therefore, accurate sediment observations are directly proportional to the development of soil and water resources.
It is not easy to determine because the amount of sediment varies according to many parameters. It is observed that non-linear functions are formed in the complex structure and appropriate and economical methods are used to solve them.
Usually, the amount of sediment is determined by measurements from field observation stations. Although the measured values from the station give healthy results, they are important in terms of time and cost. even, In some rivers, when the flow rate decreases, sediment
measurement is not possible. For these reasons, the estimation of sediment amount is needed in the design of water structures.
In the last years, the artificial intelligence approaches are a technique widely used in water resources engineering and hydrology [1-17].
Thangaraj and Kalaivani [18] estimated the water level in the river using support vector machines. Lafdani et al. [19] investigated their capabilities using Artificial Neural Network (ANN) models to estimate the amount of suspended sediment (SSL) per day in their articles. Afan et al. [20], artificial neural networks (ANN) have been used in their studies to estimate the amount of sediment daily. For this purpose, two different ANN algorithms, feed-forward artificial neural network (FFNN) and radial based function (RBNN) used. They used daily sediment and flow data from the Rantau Panjang station on the Johor River. The results predicted the amount of sediment by the data generated by producing daily flow and sediment time series. When comparing the results, they showed that the FFNN model outperformed the RBNN model in predicting daily sediment.
mean square errors (MSE), mean absolute error (MAE) and correlation coefficient (R) according to three statistical criteria. When comparing the results, they observed that the ANN approach had better sediment prediction than other methods.
Yilmaz et al. [22], have tested various regression models to calculate the amount of sediment in two stations (in Turkey-Coruh). Choubin et al. [23], tried to estimate the amount of sediment using hydro-meteorological data. They used artificial intelligence method models such as Artificial Neural Networks (ANN) and Adaptive Neural Fuzzy Inference System (ANFIS) for sediment time series modeling.
II. STUDY AREA
In this study, support vector machine (SVM) Generalized Regression Neural Network (GRNN) were used for prediction of sediment on Missouri river. The study area was selected as the Douglas county region in the State of Nebraska in the United States. In this study, data were obtained from Omaha station for near 6 years of water year measurements and data were obtained from USGS [24] and US climate data [25]. Figure 1 shows the general view of the Missouri River at Omaha station and the views of the selected area.
III. METHODS
In this study, estimation of sediment amount was made by using hydro-meteorological parameters such as river flow, air temperature and precipitation measured between 2011-2017 at Omaha Station in Nebraska state of Missouri river. Support Vector Machines (SVM) and Generalized Regression Neural Network (GRNN), which are among the artificial intelligence methods, were used to estimate the sediment amount.
3.1 GENERALIZED REGRESSIO N NEURAL NETWO RK (GRNN)
The GRNN method is a supervised artificial neural network model that is radial-based and usually works as an estimator. The strengths of this algorithm are that they produce consistent and fast results and are easy to model. In this artificial neural network model, one neuron is held in the pattern layer for each sample data in the training data set. Therefore, in studies where the training data set is too high, the layer structure grows in direct proportion to the number of sample data, increasing the number of processes and memory requirement.
3.2SUPPO RT VEC TO R MAC HINES (SVM)
Founded by Vladimir Vapnik and Alexey Chervonenkis [26] in 1963, Support Vector Machines (SVM) is a supervised learning algorithm based on statistical learning theory. It is mainly us ed to separate data from two classes in an optimal way. For this purpose, decision limits or in other words hyperplanes are determined. Today, SVMs are used in many classification problems ranging from face recognition systems to sound analysis, from water resource engineering to stock market calculations. In this study, SVM method with Poly Kernel function is used.
IV. METHOD RESULTS
In this section, sediment estimation results of Support Vector Machines (SVM) and Generalized Regression Artificial Neural Network (GRNN) methods are examined. Correlation coefficient (R), root mean square error
(RMSE) and mean absolute error (MAE) were calculated in the evaluation of the results of the models.
The correlation coefficient (R) measures the strength of the linear correlation between the binary values x and y. R value closest to 1 is the most logical and appropriate. Mean absolute error (MAE) measures the average error magnitude. RMSE and MAE are used to diagnose the probability of errors. RMSE, MAE can go from zero t o infinity. Lower values mean more useful.
Expressions of the statistical criteria used in the study are given in equations 1-3.
(1) ESTIMATION MEASURE n 1 j
S
S
n
1
MAE
(2)
2ESTIMATION MEASURE n 1 i
S
S
n
1
RMSE
(3)
Here, n is the number of data and S is the daily suspended sediment / sediment amount, concentration (mg / L).
4.1GRNN METHOD RESULTS
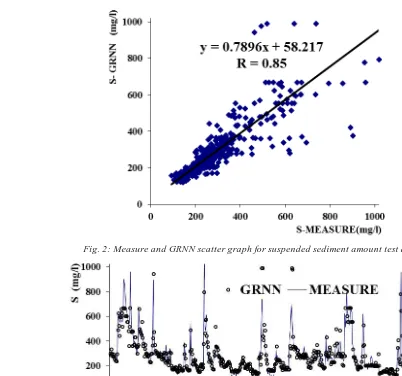
Fig. 2: Measure and GRNN scatter graph for suspended sediment amount test data
Fig. 3: Measure and GRNN distribution graph for suspended sediment amount test data
Figure 3. shows that distribution of GRNN model test results are quite close to observed values of sediment for the study area. As it is seen in Figure 2, correlation coefficient is calculated as 0.85 for test set of GRNN method.
4.2SVMMETHOD RESULTS
In SVM analyze, input and output data files were created by using daily measurement data flow, precipitation, temperature and time series in SVM model application .
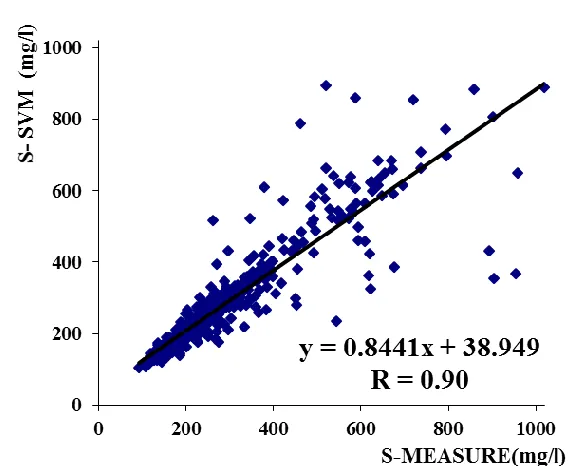
Fig. 4: Measure and SVM scatter graph for suspended sediment amount test data
Fig. 5: Measure and SVM distribution graph for suspended sediment amount test data
Results of SVM model show that the correlation coefficient is high and the sediment estimations are closer to the actual values shown in Figure 5. Correlation coefficient is calculated as 0.90 for SVM results as it is seen in Figure 4. The result parameters of the MAE,
RMSE and R obtained from the test data will be shown in table form. The results will be used to compare estimations and performance. The statistical results of the models are given in Table 1
Table 1: MAE, RMSE and R parameter results obtained for test data of GRNN and SVM model
Methods Method inputs MAE (Mg/L)
RMSE (Mg/L) R
GRNN Qt, Qt-1, Pt, Pt-1, Tt, St-1 39.80 81.53 0.85
SVM Qt, Qt-1, Pt, Pt-1, Tt, St-1 24.38 55.61 0.90
MAE: Mean absolute error, RMSE: Root mean square error, R: Correlation coefficient. Q (t): Daily flow, Q(t-1): Daily flow time series, P (t): Daily precipitation,
According to Table 1, when MAE, RMSE and R statistical criteria were compared, all models were good. All models are evaluated separately; GRNN (39.80 - 81.53 - 0.85) and SVM (24.38 – 55.61 – 0.90) models were found to perform well. Nevertheless , it is observed that the SVM model has a low error rate with high correlation. In addition, the GRNN model are close to SVM prediction performance. When the results were examined, GRNN and SVM models were found to perform better in sediment estimations.
Nevertheless, the SVM method showed slightly better correlation and lower error performance than the GRNN method.
V. CONCLUSION
In this study, daily suspended sediment amount in Missouri River were estimated by using Support Vector Machine (SVM) and Generalized Artificial Neural Network (GRNN) methods. Since the amount of sediment in the river structures actually contains a large number of parameters, the use of the artificial intelligence models, in the solution of this complex problem has enabled us to obtain the most realistic results.
When the SVM model results were compared to the GRNN model, it was observed that the SVM and GRNN model results were close and good.
Since Support Vector Machine applications analyzed for river structures have a low error level and the observed values are close to the estimates, it can be used as an alternative method for the prediction of sediment concentration compared to the classical methods.
ACKNOWLEDGEMENTS
In this paper, hydrological and meteorological data were obtained from USGS (US Geological Survey). The authors would like to thank USGS staff for the transmission of hydrological Measure data.
REFERENCES
[1] Taşar B., Üneş F., Demirci M., Kaya YZ. Yapay sinir ağları yöntemi kullanılarak buharlaşma miktarı tahmini, DÜMF Mühendislik Dergisi 2018; 9(1): 543-551.
[2] Üneş F., Doğan S., Taşar B., Kaya Y., Demirci M. The Evaluation and Comparison of Daily Reference Evapotranspiration with ANN and Empirical M ethods.
Natural and Engineering Sciences 2018; 3(3): Supplement, 54-64.
[3] Kaya, YZ., Taşar, B. Evapotranspiration Calculation for South Carolina, USA and Creation Different ANFIS M odels for ET Estimation. ”Air and water – components of the
environment” conference proceedings p. 217-224, Cluj-Napoca Romania, 2019, DOI: 10.24193/AWC2019_22.
[4] Tașar, B., Unes, F., Varcin, H. (2019) Prediction of the Rainfall – Runoff Relationship Using NeuroFuzzy and Support Vector M achines. 2019 ”Air and Water –
Components of the Environment” Conference Proceedings,
Cluj-Napoca, Romania, p. 237-246, DOI: 10.24193/AWC2019_24.
[5] Tasar B., Kaya YZ., Varcin H., Üneş F., Demirci M. Forecasting of Suspended Sediment in Rivers Using Artificial Neural Networks Approach, International Journal of Advanced Engineering Research and Science (IJAERS)
2017; 4(12): 79-84.
[6] Üneş F., Demirci M., Taşar B., Kaya YZ., Varçin, H., M odeling of dam reservoir volume using generalized regression neural network, support vector machines and M 5 decision tree models. Applied Ecology and Environmental Research 2019; 17(3): 7043-7055.
[7] Üneş F., Bölük O., Kaya YZ., Taşar B., Varçin H. Estimation of Rainfall-Runoff Relationship Using Artificial Neural Network M odels for M uskegon Basin, International Journal of Advanced Engineering Research and Science
(IJAERS) 2018; 5(12): 198-205.
http://dx.doi.org/10.22161/ijaers.5.12.28
[8] Kaya, YZ., Üneş, F., Demirci, M., Tasar, B., Varcin, H. Groundwater Level Prediction Using Artificial Neural Network and M 5 Tree M odels. Air and water components of the environment conference, 2018; DOI: 10.24193/AWC2018_23
[9] Demirci M., Taşar B., Kaya YZ, Varçin, H. Estimation of Groundwater Level Fluctuations Using Neuro-Fuzzy and Support Vector Regression M odels, International Journal of Advanced Engineering Research and Science 2018; 5(12): 206-212. http://dx.doi.org/10.22161/ijaers.5.12.29
[10]Demirci, M ., Unes, F., Kaya, YZ., M amak, M ., Tasar, B., Ispir, E. Estimation of groundwater level using artificial neural networks: a case study of Hatay -Turkey. In 10th
International Conference „Environmental Engineering “ 2017, M arch.
[11]Demirci M., Üneş F., Körlü S. Modeling of groundwater level using artificial intelligence techniques: a case study of Reyhanlı region in Turkey. Applied Ecology and Env.
Research 2019; 17(2): 2651-2663.
http://dx.doi.org/10.15666/aeer/1702_26512663
[12]Kaya, YZ., Üneş, F., Demirci, M., Taşar, B., Varçin, H. Groundwater Level Prediction Using Artificial Neural Network and M 5 Tree M odels. Aerul si Apa. Componente ale Mediului, 2018,195-201.
Üneş F., Demirci M., Mertcan Z, Taşar B., Varçin H., Ziya Y. Determination of Groundwater Level Fluctuations by Artificial Neural Networks. Natural and Engineering Sciences 2018; 3(3): Supplement, 35-42.
[13]Üneş F, Maruf AG., Taşar B. Ground Water Level Estimation for Dörtyol region in HATAY. International Journal of Environment, Agriculture and Biotechnology 2019; 4(3): 859-864.
Data-Driven Techniques, Pol. J. Environ. Stud. 2019; 28(5): 1-12. DOI: 10.15244/pjoes/93923
[15]Unes F., Gumuscan F. G., Demirci M . (2017). Prediction of Dam Reservoir Volume Fluctuations Using Adaptive Neuro Fuzzy Approach. European Journal of Engineering and Natural Sciences , 2 (1) , 144-148 .
[16]Demirci, M ., Unes, F., & Akoz, M . S. (2016). Determination of nearshore sandbar crest depth using neural network approach. International Journal of Advanced Engineering Research and Science, 3(12).
[17]Kalaivani, R., & Thangaraj, P. (2012). River water level prediction in satellite images using support vector machine. International Journal of Computer Applications, 43(23).
[18]Lafdani, E. K., Nia, A. M ., & Ahmadi, A. (2013). Daily suspended sediment load prediction using artificial neural networks and support vector machines. Journal of Hydrology, 478, 50-62.
[19]Afan, H. A., El-Shafie, A., Yaseen, Z. M ., Hameed, M . M ., M ohtar, W. H. M . W., & Hussain, A. (2015). ANN based sediment prediction model utilizing different input scenarios. Water resources management, 29(4), 1231-1245. [20]Tasar B., Kaya YZ., Varcin H., Üneş F., Demirci M.
Forecasting of Suspended Sediment in Rivers Using Artificial Neural Networks Approach, International Journal of Advanced Engineering Research and Science (IJAERS)
2017; 4(12): 79-84.
[21]Yilmaz, B., Aras, E., Nacar, S., & Kankal, M . (2018). Estimating suspended sediment load with multivariate adaptive regression spline, teaching-learning based optimization, and artificial bee colony models. Science of the Total Environment, 639, 826-840.
[22]Choubin, B., Darabi, H., Rahmati, O., Sajedi-Hosseini, F., & Kløve, B. (2018). River suspended sediment modelling using the CART model: a comparative study of machine learning techniques. Science of the Total Environment, 615, 272-281.J. Clerk M axwell, A Treatise on Electricity and M agnetism, 3rd ed., vol. 2. Oxford: Clarendon, 1892, pp.68–73.
[23]USGS.gov | Science for a changing world [WWW Document], n.d. URL https://www.usgs.gov/
[24]U.S. Climate Data. About the climate in the United States. www.usclimatedata.com