V
V
A
A
R
R
I
I
A
A
B
B
L
L
E
E
S
S
E
E
L
L
E
E
C
C
T
T
I
I
O
O
N
N
I
I
N
N
T
T
H
H
E
E
M
M
O
O
D
D
E
E
L
L
I
I
N
N
G
G
O
O
F
F
N
N
I
I
G
G
E
E
R
R
I
I
A
A
E
E
C
C
O
O
N
N
O
O
M
M
I
I
C
C
G
G
R
R
O
O
W
W
T
T
H
H
A
A
d
d
e
e
w
w
a
a
l
l
e
e
F
F
.
.
L
L
u
u
k
k
m
m
a
a
n
n
11,
,
K
K
a
a
y
y
o
o
d
d
e
e
A
A
y
y
i
i
n
n
d
d
e
e
22,
,
B
B
o
o
l
l
a
a
L
L
.
.
S
S
o
o
l
l
a
a
n
n
k
k
e
e
33,
,
A
A
n
n
i
i
h
h
u
u
n
n
l
l
o
o
p
p
o
o
O
O
.
.
A
A
l
l
i
i
c
c
e
e
441
Department of Mathematics, Landmark University, Omu-Aran, Nigeria
2
Department of Statistics, Federal University of Technology, Akure, Nigeria
3
Department of Demography and Social Statistics, Obafemi Awolowo University, Ile-Ife, Nigeria
4
Department of Statistics, Ladoke Akintola University of Technology, Ogbomoso, Nigeria
Corresponding Author: Adewale F. Lukman, [email protected]
ABSTRACT: This study aimed at identifying and
retaining factors that contributed immensely to economic growth in Nigeria based on some variable selection methods. Stepwise regressions are often not efficient when there is multicollinearity. It was observed that the model suffers the problem of multicollinearity and this necessitate the use of other variable selection based on Partial least squares and Lasso. In this study, twelve factors were available to predict economic growth. It was observed that oil revenue, non-oil revenue and Capital Expenditure on Transfers have positive impacts on Nigeria economic growth and should be retained.
KEYWORDS: Variable selection methods, Oil revenue,
Non-oil revenue, Capital expenditure, Economic growth.
1. INTRODUCTION
Economic growth is often obtained by comparing the gross domestic product in a year with previous year. [AO95] defines the economic growth of a country as the increase over time in the country economic capacity to produce goods and services that are needed to improve the citizens’ standard of living. In the list of factors affecting the Nigerian economic growth are federal government revenue and expenditure. Revenues are government generated income from taxation, excise duties, customs or other sources. [IWI14] claims that oil and non-oil revenue are the two main sources of federal government revenue.
Oil revenue is the most important source of revenue to the federal account. These are revenue from crude oil and gas exports, receipts from petroleum profits tax and royalties and revenue from domestic crude oil sales while non-oil revenue are generated from Companies Income Tax (CIT), Custom and Excise Duties, (CED), Valued Added Tax (VAT), Education Tax (ET), Personal Income Tax (PIT), Levies, public debt, grants, aids among others. Government expenditure refers to government spending which is used to achieve its strategic objectives and satisfy the needs of its citizens. These can be categorized into two main components
namely recurrent and capital expenditure. Capital expenditure is government spending on certain projects in order to enhance the well-being of its citizen usually for a long period of time ([AKL15]). They includes capital expenditures on health, agriculture, construction, transport and communication, electricity, defense, internal security, national assembly, education, pensions and gratuities etc. Also, recurrent expenditure is basically governments spending that happen repeatedly e.g. payment of salaries.
In this study, some variable selection techniques were applied to economic growth data measured by nominal gross domestic product which represent the response variable. The predictors are revenue classify into oil, non-oil revenue, federal government retained revenue and federation account; recurrent and capital expenditure classified into administration, social and community services, economic services, transfers.
Variable selection is an aspect in regression that deals with selection of best subset of predictors and it aims towards achieving a better regression model. In variable selection, some of the variables are included while some are excluded. Those that were included are those that contributed significantly to the dependent variable. The focus in variable selection methods includes accurate predictions, determining which variables are meaningful and stability. Stepwise or forward regressions are generally used due to their simplicity. However, the performance of these methods is poor when multicollinearity exists. Variable Importance Projection (VIP) scores obtained from Partial Least Squares (PLS) regression is used in lieu of forward or stepwise regression. Modern procedures such as Least Angle Shrinkage and Selection Operator LASSO introduced by [Tib96], Least Angle Regression (LARS) introduced by [E+04] improve model stability and predictions.
that contributed immensely to economic growth in Nigeria. Stepwise regression is built on the concepts of Ordinary Least Square estimator. This often is not efficient when the predictor variables are related, that is, when there is multicollinearity problem. In this study, variable selection that is not multicollinearity influenced is taken into consideration.
The paper is structured as follows. Descriptions of the variable selection methods in this study are given in section 2. Results and Discussion are given in section 3. Finally, the conclusion is provided in section 4.
2. LITERATURE REVIEW
[PSM08] defined economic growth as the ability of a country to enhance its production of goods and services using their internally generated resources. Over the years, economic growth in Nigeria is characterized with instability when compared with other developing nations ([Aud12]). Consequently, internal and external shocks have been observed in the Nigeria economy ([Aud12]). Economic growth of a country is mostly measured in terms of increase in gross domestic product (GDP). This has received considerable attention from different scholars. Despite this growth, the choice of a modelling framework has remained inconclusive both at the theoretical and empirical levels in Nigeria. Capital expenditure is government long term spending on certain projects such as road construction, electricity so as to enhance its citizen standard of living. Recurrent expenditure is basically recurring short time spending on wages and salary, and consumable items such as drugs for health services, etc. and they only last for a short period of time. There has been a noticeable increase in capital and recurrent expenditure in Nigeria without commendable improvement in our economic growth ([M+12]). Baro ([Bar90]) examined the relationship that exists between government size, growth rate and saving using a simple growth model. He observed that a significant positive relationship exist between the variables and concluded that public expenditure should be geared towards productivity. Easterly and Rebelo ([ER93]) examined the effect of income and government expenditure on Gross Domestic Product (GDP) using Ordinary Least Squares. They observed that the economic growth direction in Nigeria is influenced by government activities. [DA02] conducted investigation on the endogenous growth model of government expenditure and income. They found out that this is crucial in predicting future economic growth. Ogbulu ([Ogb09]) established the relationship between budgetary operation and economic growth using regression analysis. He
regressed GDP on Oil and Non-Oil Revenue, Expenditure broken down into Administrative, Economic, Social Expenditure and Transfer Expenditure for a period of thirty-seven years. The results of the short run regression shows that oil revenue do not result in increased output level of GDP. Olugbenga and Owoye ([OO07]) revealed that a long-run relationship exist between government expenditure and economic growth using a group of 30 OECD countries during the period 1970-2005. They concluded that unidirectional relationship exists from government expenditure to growth for 16 of the countries which confirms the Keynesian hypothesis. Also, for 10 other countries, causality runs from economic growth to government expenditure which confirms with the Wagner’s law. Finally, for a group of four countries, they discovered the bi-causal relationship between government expenditure and economic growth. Laudau ([Lau83]) investigated the impact of government expenditure on economic growth for a sample of 96 countries and observed that government expenditure had a negative effect on growth of real output. Komain and Brahmasrene ([KB07]) studied the relationship between government expenditures and economic growth in Thailand using Granger causality test. Results revealed that both variables are not co-integrated. Moreover, they observed that a unidirectional relationship runs from government expenditures to growth. In addition, government expenditure had a significant positive impact on economic growth. In India during the period 1950-2007, Ranjan and Sharma ([RS08]) revealed that government expenditure have a significant positive impact on economic growth. Government spending had a positive relationship with economic growth in Saudi Arabia ([AlY00]).
2.1. VARIABLE SELECTION METHODS
2.1.1 Stepwise Regression
This procedure is used to examine the impacts of each variable on the response variable step by step. Variables whose contributions are insignificant to the explained variation will be removed. The different types of stepwise regression are forward selection, backward elimination and stepwise method. ([CHP99]).
2.1.2 Forward Selection
retained if its coefficient significantly differs from zero. The residual obtained from step one is correlated with each of the predictors; the variable with the highest correlation coefficient is included in the model. The variable is also retained if the coefficient statistically differs from zero, otherwise excluded from the model. A search for the next variable to be included continues in this order. The procedure continues until no predictors can be included ([CHP99]).
2.1.3 Backward Elimination
The response variable is regress on all the predictor variables. Variable(s) whose regression coefficients are significantly different from zero are retained otherwise eliminated. The response variable is further regress on the retained variable in step one. Variables are eliminated if regression coefficients are not significantly different from zero. This procedure continues until the regression coefficients of all retained variables significantly differ from zero. ([CHP99]).
2.1.4 Stepwise Method
The stepwise method combines both features of forward and backward selection procedure. The method started by regressing the response variable but with the possibilty of deleting a variable, as in backward elimination is considered. Here, variable retained earlier in the model may be eliminated in subsequent stages. The method of retaining or eliminating variables is not different from the one used in forward and backward elimination selections. Often, two different levels of significance are required for adding or deleting variables from the model ([CHP99]).
2.2. PLS VARIABLE SELECTION METHOD
The problem of multicollinearity is often inevitable in linear regression models. When this problem exists, OLS estimator is inappropriate because it will not give a precise solution. Wold ([Wol66]) introduced the Partial Least Squares Regression (PLS) as alternative to OLS estimator to deal with multicollinearity. It may be used with any number of regressors. Also, can be adopted when the number of regressors is more than the number of observations. PLS attempts to obtain new factors that will play the same role as the explanatory variables. These new factors are referred to as latent variables or components. Each component is linear combination of the explanatory variables. PLS has the best predictive power especially for problems with multicollinearity or high dimensional data set. In PLS, the response variable, Y, is regress on a subset of the k orthogonal (latent) vectors stored in a score
matrix of size n x k by which important features of X have been retained. The Score matrix is formed by taking linear combinations of column of the design matrix, X. The predictive method of Wold ([Wol66]) and the SIMPLS method of de Jong ([DeJ93]) are available methods of formulations for partial least squares. The number of components that will be used is a function of the data. Selecting the right components can help improves the model fit to the original data otherwise this can lead to over fitting affecting future predictions. The number of PLS components can be chosen through cross validation. One at a time validation, test set validation and splitting the data into blocks are the different types of cross validation.
Cassel et al. ([CJ05]); Geladi ([Gel05]); Kang and Billor ([KB13]) used PLS to retain few variables that explain a high percentage of the variation in the response variable. Variable importance for prediction (VIP) is a useful tool in summarizing the contribution of a variable to a model. Explanatory variables with small regression coefficient (in absolute value) and VIP is subject to deletion. An explanatory variable with High VIP score has greater contribution on the response variable ([Wol94]). Predictors with relatively small VIP coefficients, less than one (1), are considered to have a small contribution to the predictor variable and might be dropped from the model; predictors with VIP scores close to or greater than one (1) can be considered the most relevant for explaining Y. This is called “greater than one rule”, and is used as the criterion for variable selection ([HK03]; [CJ05]).
2.3. LASSO
Data analysts are not often satisfied with the use of OLS estimates based variable selection methods especially when there is multicollinearity. OLS regression estimates are unbiased with high standard error and poor prediction. Some biased estimation techniques such as ridge regression, partial least squares and principal components provides more stable models but they do not set coefficients to zero and this often leads to problem of model interpretation. LASSO type estimators are consistent estimators for the regression coefficients under appropriate condition ([KF00]). Least Absolute Shrinkage and Selection Operator (LASSO) was introduced by Tibshirani ([Tib96]) and it provide more stable and accurate result than other methods of variable selection earlier mentioned. LASSO estimate is defined as
where t≥0 is lasso tuning parameter. It minimizes the residual sum of squares subject to the sum of the absolute value of the coefficients being less than a constant, t. The lasso aims for parsimony using the constraint, . Important predictors are included in the model, and less important predictors shrink, potentially to zero since the overall magnitude of the coefficients is constrained. Lagrangian equivalent form of lasso is defined as:
λ =1 (2)
Equation (1) and (2) are equivalent for any λ
such that t≥0. The tuning parameter can be chosen based on any of the model criterion: AIC, BIC, Mallows’ Cp and Cross-validation.
The parameter λ is what controls the strength of the penalty; as λ increases, more shrinkage is employed and more coefficients are set to zero. Shrinkage and setting coefficient to zero helps in prediction accuracy.
3. DATA DESCRIPTION AND MODEL
This paper uses annual extracted from the Central Bank of Nigeria Statistical bulletin for the period of 1981–2011. The long-run empirical model is specified as follows:
+
12 12+ (3)
Where Y denote Nominal Gross Domestic Product, represent Recurrent Expenditure on Administration, represent Recurrent Expenditure on Social and Community Services, represent Recurrent Expenditure on Economic Services, represent Recurrent Expenditure on Transfers, represent Capital Expenditure on Administration, represent Capital Expenditure on Social and Community Services, represent Capital Expenditure on Economic Services, represent Capital Expenditure on Transfers, represent Oil Revenue, represent Non-oil Revenue, represent Federation Account and represent Federal Government Retained Revenue.
4. RESULTS AND DISCUSSION
This paper focus on identifying factors that significantly contributes to economic growth in Nigeria. The explanatory variables of interest are revenue classify into oil, non-oil revenue, federal
government retained revenue and federation account; recurrent and capital expenditure classified into administration, social and community services, economic services, transfers respectively. Nominal gross domestic product value is taken as proxy to the economic growth. A condition index of 11254 revealed that the model suffers from multicollinearity.
4.1. VARIABLE SELECTION RESULT BASED ON STEPWISE REGRESSION SELECTION
Results for Table 1 using forward selection approach shows that five out of the predictor variables (X2,
X10, X8, X9, and X12) were selected to build a model
to predict economic growth (Y). In backward elimination, out of the twelve variables, six variables (X2, X7, X8, X9, X10, X12) were selected to predict the
variable Y. The result of stepwise method and forward selection are the same. The same variables were selected to predict the variable Y.
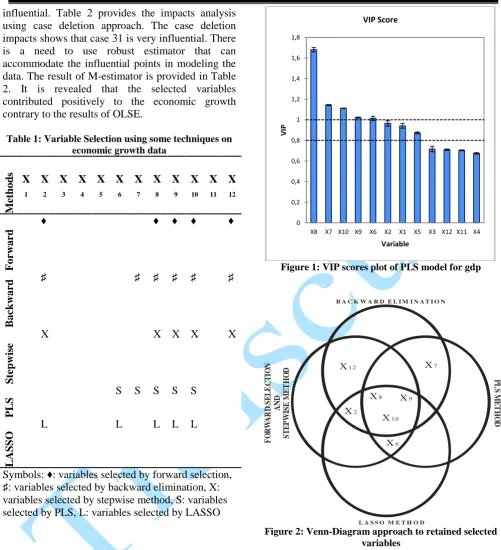
4.2. VARIABLE SELECTION RESULT BASED ON PLS METHOD
Following the greater than 1 rule, variables X1 - X5
and X11 - X12 with small VIP scores in the PLS
model are excluded and variables X6 - X10 are
selected to build the model to predict Y. This is further illustrated in Figure 1 and Table 1.
4.3. VARIABLE SELECTION RESULT BASED ON LASSO METHOD
Following lasso estimation result in Table 1, variables X1, X3, X4, X5, X7,X11, X12 were shrink to
zero and therefore were excluded from the model while variables (X2, X6, X8, X9, X10) were selected to
build the model to predict variable Y. 4.4. SUMMARY RESULTS OF THE VARIABLE SELECTION METHODS
Using Venn-diagram approach in Figure 2, the most contributing variables to the economic growth of Nigeria using all the methods of variable selection are X8, X9 andX10. Table 2 provides the model fitting
influential. Table 2 provides the impacts analysis using case deletion approach. The case deletion impacts shows that case 31 is very influential. There is a need to use robust estimator that can accommodate the influential points in modeling the data. The result of M-estimator is provided in Table 2. It is revealed that the selected variables contributed positively to the economic growth contrary to the results of OLSE.
Table 1: Variable Selection using some techniques on economic growth data
Me
thod
s
X
1
X
2
X
3
X
4
X
5
X
6
X
7
X
8
X
9
X
10
X
11
X
12
Forw
ard
♦ ♦ ♦ ♦ ♦
B
ackw
ard
♯ ♯ ♯ ♯ ♯ ♯
Ste
pw
is
e
X X X X X
PL
S S S S S S
L
A
SS
O
L L L L L
Symbols: ♦: variables selected by forward selection, ♯: variables selected by backward elimination, X: variables selected by stepwise method, S: variables selected by PLS, L: variables selected by LASSO
Figure 1: VIP scores plot of PLS model for gdp
X2
X9
X1 0 X8
X6
X7 X1 2
F
O
R
W
A
R
D
S
E
L
E
C
T
IO
N
A
N
D
S
T
E
P
W
IS
E
M
E
T
H
O
D
B A C K W A R D E L I M I N A T I O N
P
L
S
M
E
T
H
O
D
L A S S O M E T H O D
Figure 2: Venn-Diagram approach to retained selected variables
Table 2: Impact of Influential points on OLS estimator coefficients and M-estimate
Full Data Coefficients
VIF (26) (31) M-estimator
coefficients
-18522154.96 -16794285.82
(-9.33%)
-329601.330 (-0.98%)
-361281.22
713.778 1.380 667.578
(-6.47%)
1.870 (-99.74%)
18.8895
31.224 3.357 36.150
(15.78%)
1.822 (-94.16)
2.3832
-105.281 3.626 -118.015
(12.09%)
10.632 (-110.10%)
8.1208
0 0,2 0,4 0,6 0,8 1 1,2 1,4 1,6 1,8
X8 X7 X10 X9 X6 X2 X1 X5 X3 X12 X11 X4
V
IP
5. CONCLUSIONS
In this paper, different selection methods were used to select the contributing factors to the Nigerian economic growth. The factors which are twelve were subsequently reduced to three (3) by taking the intersection of all factors selected by each of the variable selection methods. A linear model is fitted to these variables with high coefficient of determination which in turn shows that the variables accounted for most of the variation in the response variable. The diagnostic checks detect the presence of influential cases but the model does not suffer multicollinearity. This method is a possible solution to multicollinearity problem by selecting a subset of the predictor variables, X. The variable selection methods PLS-VIP and LASSO were used in this study to circumvent this problem. Finally, the factors were model using M- estimator to accommodate the influential cases. However, it was observed that oil revenue, non-oil revenue and Capital Expenditure on Transfers have positive impacts on Nigeria economic growth and should be retained.
REFERENCES
[Aud12] Audu N. P. - The impact of fiscal policy on Nigerian economy. International Review of Social Sciences and Humanities, 4(1): 142-150, 2012. [AlY00] Al-Yousif Y. – Does Government
Expenditure Inhibit or Promote Economic Growth: Some Empirical Evidence from Saudi Arabia. Indian Economic Journal, 48(2), 2000.
[AO95] Anyanwu J., Oaikhenan H. - Modern Macroeconomics: Theory and Application in Nigeria. Onitsha: Joanee Educational Publishers Ltd. , 1995. [AKL15] Ayinde K., Kuranga J., Lukman A.
F. - Modeling Nigerian government expenditure, revenue and economic growth: co-integration, error correction mechanism and combined estimators analysis approach. Asian Economic and Financial Review, 5(6):858-867, 2015.
[Bar90] Baro R. - Government spending in a simple model of endogenous growth. Journal of Political Economics, 98(5): 103 – 125, 1990.
[CJ05] Chong I. G., Jun C. H. - Performance of some variable selection methods when multicollinearity is present. Chemometrics and Intelligent Laboratory Systems 78, pp: 103–112, 2005.
[CBN11] CBN - Central Bank of Nigeria Statistical Bulletin, 2011.
[CHP99] Chatterjee S., Hadi A. S., Price B. - Regression Analysis by Example, Third Edition. Wiley & Sons, 1999.
[CHW99] Cassel C. M., Hackl P., Westlund A. H. - Robustness of partial least squares method for estimating latent variable quality structures. Journal of Applied Statistics 26, 435-446, 1999. [DeJ93] De Jong S. - SIMPLS: An Alternative
Approach to Partial Least Squares Regression. Chemometrics and Intelligent Laboratory Systems, 18, 251-263, 1993.
[DA02] Dar A. A., AmirKhalkhali S. - Government Size, Factor Accumulation and Economic Growth: Evidence from OECD Countries. Journal of Policy Modeling, 24(7/8), 679-692, 2002. [ER93] Easterly W., Rebelo S. - Fiscal Policy
and Economic Growth: An Empirical Investigation. Journal of Monetary Economics, 32, 417-458, 1993.
[E+04] Efron B., Hastie T., Johnstone I., Tibshirani R. - Least angle regression (with discussion). Annals of Statistics 32, 407-499, 2004.
[Gel05] Geladi P. - Notes on the history and nature of partial least squares (PLS) modelling. Journal of Chemometrics 2, 231-246, 2005.
[HK03] Han S. H., Kim J. - A comparison of screening methods: selecting important design variables for modeling product usability. International Journal of Industrial Ergonomics, 32, 189-198, 2003.
between Tax Revenue and Economic Growth in Nigeria: 1986 to 2012. The SIJ Transactions on Industrial, Financial & Business Management (IFBM), 2(2), 2014.
[KB07] Komain J., Brahmasrene T. - The Relationship Between Government Expenditures and Economic Growth in Thailand. Journal of Economics and Economic Education Research. [http://findarticles.com/p/articles/mi_qa 5529/?tag=content;col1] , 2007.
[KB13] Kang Y., Billor N. - Variable Selection in the Chlamydia Pneumoniae Lung Infection Study. Journal of Data Science 11(2013), 371-387, 2013.
[KF00] Knight K., Fu W. - Asymptotics for lasso-type estimators. Annals of Statistics 28, 1356-1378, 2000.
[Lau83] Laudau D. - Government Expenditure and Economic Growth: A Cross Country Study. Southern Economic Journal, 49, 783-792, 1983.
[M+12] Mobede N. J., Regina G. O., Onwumere J. U. J., Imo G. I. - Impact of recurrent and capital expenditure on Nigeria’s economic growth. European Journal of Business and Management, 4(19): 66 – 74, 2012.
[Ogb09] Ogbulu O. M. - Capital market development and economic growth in Nigeria: Application of cointegration and causality tests. Journal of Finance, Banking and Investment, 3(1): 56-79, 2009.
[OO07] Olugbenga A. O., Owoye O. - Public Expenditure and Economic Growth: New Evidence from OECD Countries. [http://iaes.confex.com/iaes/Rome_67/t echprogram/S1888.HTM]
[PSM08] Popkova E. G., Shakhovkaya L. S., Mitrakhovich T. N. - New quality of economic growth concept. International Journal of Economic Policy Studies, 33(3): 1-10. 2008.
[RS08] Ranjan K. D., Sharma C. - Government Expenditure and Economic Growth: Evidence from India. The
ICFAI University Journal of Public Finance, 6(3), 60-69, 2008.
[Tib96] Tibshirani R. - Regression Shrinkage and Selection via the Lasso. Journal of the Royal Statistical Society. Series B (Methodological), Volume 58, Issue 1 (1996), 267-288, 1996.