Available Online at www.ijpret.com 630
INTERNATIONAL JOURNAL OF PURE AND
APPLIED RESEARCH IN ENGINEERING AND
TECHNOLOGY
A PATH FOR HORIZING YOUR INNOVATIVE WORK
A SURVEY ON EDGE DETECTION OF ANGIOGRAM IMAGES USING THE CLASSICAL
IMAGE PROCESSING TECHNIQUES
DR. M. S. ALI1, MONA S. SAWARKAR2 1. Associate Professor, ECE Department, PRMCEAM Badenra, Maharashtra, India.
2. M.E. (IInd Year), ECE Department, PRMCEAM Badenra, Maharashtra, India.
Accepted Date: 05/03/2015; Published Date: 01/05/2015
\
Abstract:Segmentation of blood vessel on angiogram is a challenging task. In medical image processing, blood vessels need to be extracted clearly and properly from a noisy background, drift image intensity, and low contrast pose. Angiography is a procedure widely used for the observation of the blood vessels in medical research, where the angiogram area covered by vessels and/or the vessel length is required. For this purpose we need vessel enhancement and segmentation. Medical images are generally suffered from signal dependent noises i.e. speckle noise and broken edges. Most of the noises signals appear from machine and environment generally not contribute to the tissue differentiation. But, the noise generated due to above mentioned reason causes a grainy appearance on the image, hence image enhancement is required. Segmentation is a process of partitioning a given image into several non-overlapping regions.We attempt to review some of such activities. Histogram equalization is one of the important steps in image enhancement technique for MRI. Many researchers have been proposed with regard to the detection of edges of the blood vessels. Keywords: Angiogram image, Segmentation, Image enhancement, Vessel extraction, Histogram equalization
Corresponding Author: DR. M. S. ALI
Access Online On:
www.ijpret.com
How to Cite This Article:
Available Online at www.ijpret.com 631 INTRODUCTION
A number of diseases can be detected using medical Imaging methods. The Blood vessels of the human body can be visualized using many medical imaging methods such as X-ray, Computed Tomography (CT), and Magnetic Resonance (MR).One of the major problems that physician faces while diagnosis comes from both the low image quality and the complex shape of vessel.Segmentation plays a vital role in the detection of blood vessels in an angiogram image. Thus it is used to extract the vascular and background regions. Based on the partitioning results, surfaces of vasculatures can be extracted, modelled, manipulated, measured and visualized. Hence it is used to detect the various vascular diseases. Edge detection has an important significance in computer vision. The most representative methods of the classical edge detection are Marr-Hildreth edge detection method, optimal operator Cannyand operator Sobel, and Laplacian transformation and so on. Their characteristics are fast, but very sensitive to noise interference. They cannot be applied to images containing high-intensity noises.For the cardiovascular disease, angiographic images are commonly used with the clinical diagnoses of the cardiovascular diseases and are referred to the golden standard of the cardiovascular disease diagnoses. In view of the characteristics of periodic motion of the heart, a clinical examination of the coronary angiography uses directly the angiogram to observe and diagnose the heart disease. Because of the variety of complex situations such as the uneven distributions of contrast agent, the attenuation, and the X-ray exposure, the contrast images often cannot clearly show the local and global blood vessel edge so as to affect the accuracies of diagnoses. In order to improve the diagnosis level, it is very important to study an accurate method of the blood vessel edge detection.
Available Online at www.ijpret.com 632 between two regions. Angiograms can be analyzed using computers to detect the blood vessel boundary as a first step. Boundary map obtained from boundary detection of an image can give useful information. This information is further useful in image analysis and interpretation tasks. Boundaries provide a clear outline or shape of an object. Obtaining the correct boundary in an image is a critical task. Boundary detection needs several steps in computer vision tasks. Image segmentation is classified into two types, namely, edge based approach and region based approach. Edge based approach is used with edge detection operator such as Sobel, Laplacian, and Canny for detecting the object boundary and then extract the boundaries based on the edge information.
The precise edge positioning and the noise suppression are mutually contradictory. Canny edge detection method chooses a compromise between the anti-noise interference and the precise edge positioning. Namely, the first derivative of a Gaussian function is used as the edge differential operator. When the gradient differential method is used to sharpen images, the noises, stripes, etc. are enhanced simultaneously. Sobel edge detection uses 'first order gradients' of intensity gradient to detect edges within an image. First order intensity gradients can be calculated using spatial convolution kemels, which are known as Sobel Operators. Sobel X operator gives gradients in horizontal direction and Sobel Y operator gives gradients in vertical direction. These kemelsare applied to the pixels of an image. Operator Laplacian can enhance the border outline of the blurred images. Like gradient differentiation method, operator Laplacian has also enhanced the image noises. However, when compared with the gradient method, operator Laplacian has the weaker effeteness to enhance the noises than the gradient method. In this paper, the review of various classical image processing techniques is presented for the edge detection of angiogram images.
2. Literature review
S.SathishKumar, R.Amutha[1] proposed a method for the edge detection of angiogram images using the classical image processing techniques. Edges of the vessel in the angiogram image is detected using the proposed algorithm which involves the Pre-processing step, where the noise is removed using the Median filter and Histogram equalization technique, instead of the Canny edge Detector. Median filtering is useful in eliminating the intensity spikes while preserves the edges in a better way. Histogram equalization stretches or compresses an image, which is used to detect the edges of a blood vessel.
Available Online at www.ijpret.com 633 retinopathy patients. Firstly, edges in the image have been detected using Canny edge detector. Edges which represent vessel segments have been removed from the image. Sobel edge detection is then used for the neighbourhoods of the remaining objects. The analysis of size, shape, and energy characteristics of the resultant Objects is used to finally segment the micro aneurysm from other retinal feature.
Anshita Aggarwal, AmitGarg [3] proposed a method based on image de-noising and edge enhancement of noisy multidimensional imaging data sets. For the intent of image de-noising, Adaptive Multiscale Product Thresholding based on 2-Dwavelet transform is used. In this method, contiguous wavelet sub-bands are multiplied to improve edge structure while reducing noise. In multiscale products, boundaries can be successfully distinguished from noise. Adaptive threshold is designed and forced on multiscale products as an alternative of wavelet coefficients or recognize important features. For the edge enhancement, Canny Edge Detection Algorithm is used with scale multiplication technique. The proposed algorithm is implemented using MATLAB. Simulation results for image enhancement were presented both for standard test images and CT scan image.
Senthil kumaran N, Thimmiaraja J [4] presents various histogram equalization methods for Image Enhancement using MRI brain images. The main function of image enhancement is to carry out the hidden part in an image or to enhance the low contrast image. The quality of the image gets better by contrast manipulation. A very well-liked performance for contrast enhancement is Histogram Equalization (HE). The most part of techniques is used, due to simplicity and moderately better performance. Histogram Equalization basic methods like Global Histogram Equalization (GHE), Local histogram equalization (LHE), Brightness preserving Adaptive Histogram Equalization (AHE) and Dynamic Histogram equalization (BPDHE) using different objective quality measures for MRI brain image Enhancement are studied and compared.
Available Online at www.ijpret.com 634 Jose Anand, K. Sivachandar[6] presents a image and edge map based boundary detection of aortas in cardiovascular MR images and is implemented using MATLAB. The performance of the edge vector and edge map boundary detection method for detecting the boundary of aortas in cardiovascular MR images is compared with an Active Contour Model (ACM).
Z. Hameed, C. Wang [7] proposed a method aiming at detecting edge of image with varieties of gradient signal degradation. The method comprises two steps. The first step is to perform adaptive histogram equalization to improve the signal contrast in a discriminative manner. To this end, the histogram of the input image is analyzed and the irregularity of image intensity, if there is any, is identified and removed by using a contrast limited adaptive histogram equalization technique. The following step is a gradient modulation filtering process with the modulation factor determined by the local intensity.
Wenwei Kang,Ke Wang , Wanzhong Chen , Yong Li [9] proposed a new segmentation method based on transition region extraction which aims at the complex background of coronary angiograms, weak contrast between the coronary arteries and the background. The characteristic of coronary angiograms is analyzed and then 6 different Gaussian matched templates are used to enhance the coronary angiograms. Finally, the coronary arteries are obtained with local complexity method based on transition region extraction.
ZulongYu, Kaiqiong Sun[8] presents an approach for the extraction of vessel on angiogram by using morphology feature driven deformable model. The low contrast within angiogram may make the edge detector based method produce false detection and cause the leakages problem of edge based deformable model, whereas the regions of interest in angiogram are not homogeneous, and therefore the popular region based deformable models, which usually take assumption of intensity homogeneity, are not applicable. To address these problems, a vessel segmentation method is proposed based on region based active contour in which the morphology measure of regions acts as stop criterion of curve instead of gray intensity or its gradient and therefore the problem caused by gray intensity in homogeneity is avoided.
3. Proposed Work
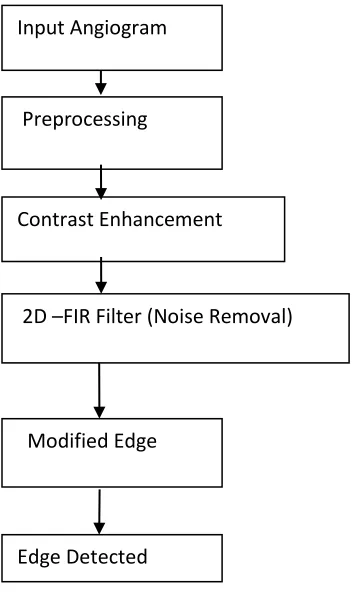
Available Online at www.ijpret.com 635 Figure 1.1 Flow Diagram
In Fig. 1.1 first the input image is preprocessed using median filter to remove noise and then the later steps are carried out on the preprocessed angiogram image.
A. Preprocessing
The first step is to filter out any noise in the original image before trying to locate and detect any edges. Preprocessing involves various steps like filtering, intensity adjustment etc. Median filtering is a nonlinear method used to remove noise from images. It is widely used as it is very effective at removing noise while preserving edges. It is particularly effective at removing ‘salt and pepper’ type noise. First, angiogram image is read and converted into a matrix form where each pixel value is in the range from 0-255. Then median filtering is applied to remove noise
B. Contrast Enhancement
Image enhancement refers to accentuation or sharpening of image features such as edges, boundaries or contrast to make a graphic display more useful for display and analysis. The classical contrast enhancement is Histogram Equalization which has good performance for
Input Angiogram
Image
Preprocessing
Contrast Enhancement
Method
2D –FIR Filter (Noise Removal)
Modified Edge
Detection
Available Online at www.ijpret.com 636 ordinary images, such as human portraits or natural images. Contrast of images is resolute in dynamic range, which is defined as the ratio among the brightest and the darkest pixel intensities. The good contrast image is useful for detail analysis and diagnosis. This contrast is measured with different objective quality metrics. Thus, Contrast enhancement change the image value distribution to cover a wide range.
Histograms are a way of visualizing the predominant intensities of an image. As a definition, image histograms are a count of the number of pixels that are at a certain intensity. When represented as a plot, the x-axis is the intensity value, and the y-axis is the number of pixels with that intensity value. Adaptive Histogram Equalization (AHE) is a terrific contrast enhancement method for both Natural images and Medical images. The method engages applying to each pixel in HE. Histogram equalization is classified into two categories: non adaptive and adaptive.
D. 2-D FIR Filter
A2-D FIR filter is used to compute the result using a two-dimensional correlation. The filter is rotated180 degrees in order to perform the two-dimensional correlation which basically involves the two-dimensional convolution to detect the edges. Here a 2-D filter is used to improve the results of the detection process.
E. Modified Edge Detection
Modified edge detection consists of the following four steps:
1. Noise reduction
Because the Canny edge detector is susceptible to noise present in raw unprocessed image data, it uses a filter based on a Gaussian (bell curve), where the raw image is convolved with a Gaussian filter. The result is a slightly blurred version of the original which is not affected by a single noisy pixel to any significant degree.
2. Finding the intensity gradient of the image
Available Online at www.ijpret.com 637
𝐺 = √𝐺𝑥2+ 𝐺𝑥2
𝛳 = 𝑎 tan 2(𝐺𝑦, 𝐺𝑥)
Where G can be computed using the hypot function and atan2 is the arctangent function with two arguments. The edge direction angle is rounded to one of four angles representing vertical, horizontal and the two diagonals (0, 45, 90 and 135 degrees for example).
3. Non-maximum suppression
Non-maximum suppression is an edge thinning technique. Given estimates of the image gradients, a search is carried out to determine if the gradient magnitude assumes a local maximum in the gradient direction. In some implementations, the algorithm categorizes the continuous gradient directions into a small set of discrete directions, and then moves a 3x3 filter over the output of the previous step (that is, the edge strength and gradient directions). At every pixel, it suppresses the edge strength of the center pixel (by setting its value to 0) if its magnitude is not greater than the magnitude of the two neighbors in the gradient direction. For example,
i. if the rounded gradient angle is zero degrees (i.e. the gradient is in the north-south direction) the point will be considered to be on the edge if its gradient magnitude is greater than the magnitudes at pixels in the north and south directions
ii. if the rounded gradient angle is 90 degrees (i.e. the gradient is in the east-west direction) the point will be considered to be on the edge if its gradient magnitude is greater than the magnitudes at pixels in the east and west directions,
iii. if the rounded gradient angle is 135 degrees (i.e. the gradient is in the north east-south west direction) the point will be considered to be on the edge if its gradient magnitude is greater than the magnitudes at pixels in the north east and south west directions,
iv. if the rounded gradient angle is 45 degrees (i.e. the gradient is in the north west-south east direction) the point will be considered to be on the edge if its gradient magnitude is greater than the magnitudes at pixels in the north west and south east directions.
Available Online at www.ijpret.com 638 the other (using the conventions of last paragraph). The gradient magnitude at the central pixel must be greater than both of these for it to marked as an edge.
4. Tracing edges through the image and hysteresis thresholding
Large intensity gradients are more likely to correspond to edges than small intensity gradients. It is in most cases impossible to specify a threshold at which a given intensity gradient switches from corresponding to an edge into not doing so. Therefore Canny uses thresholding with hysteresis. Thresholding with hysteresis requires two thresholds – high and low. Making the assumption that important edges should be along continuous curves in the image allows us to follow a faint section of a given line and to discard a few noisy pixels that do not constitute a line but have produced large gradients. Therefore we begin by applying a high threshold. This marks out the edges we can be fairly sure are genuine. Starting from these, using the directional information derived earlier, edges can be traced through the image. While tracing an edge, we apply the lower threshold, allowing us to trace faint sections of edges as long as we find a starting point. Once this process is complete we have a binary image where each pixel is marked as either an edge pixel or a nonedge pixel. From complementary output from the edge tracing step, the binary edge map obtained in this way can also be treated as a set of edge curves, which after further processing can be represented as polygons in the image domain.
Thus, finally an edge detected image is obtained.
CONCLUSION
Edges characterize boundaries and are therefore a problem of fundamental importance in image processing. Edges in images are areas with strong intensity contrasts – a jump in intensity from one pixel to the next. Edge detecting an image significantly reduces the amount of data and filters out useless information, while preserving the important structural properties in an image. Thus, edge detection is an important task. Hence, we summarize different edge detection for detecting the blocks and types of disease in the angiogram image in a simpler way, as of the existing methods here. The future work will focus on developing an algorithm methods. Thus a more generalized algorithm will be addressed in the near future.
REFERENCES
Available Online at www.ijpret.com 639 2. Mohammed Hafez, Sherif Abdel Azeem “Using Adaptive Edge Technique for Detecting Microaneurysmsin Fluorescein Angiograms of the Ocular Fundus”, IEEE MELECON 2002, May 7-9, 2002, Cain, EGYPT.
3. Anshita Aggarwal, AmitGarg “Medical Image Enhancement Using Adaptive Multiscale Product Thresholding”, 2014 International Conference on Issues and Challenges in Intelligent Computing Techniques (ICICT)
4. Senthilkumaran N, Thimmiaraja J “Histogram Equalization for Image Enhancement Using MRI brain images” 2014 World Congress on Computing and Communication Technologies.
5. Mei Wang, Chunlin Li, WenhaoCai, Xiaowei Wu“Coronary Angiography Image Edge DetectionBased on Information Measure”, 2010 WASE International Conference on Information Engineering.
6. Jose Anand, K. Sivachandar “An Edge Vector and Edge Map Based BoundaryDetection in Medical Images”,International Journal of Innovative Research in Computer and Communication EngineeringVol. 1, Issue 4, June 2013
7. Z. Hameed, C. Wang “Edge detection using histogram equalization and multi-filtering process”, Circuits and Systems (ISCAS), 2011, pp.1077– 1080.
8. ZulongYu ,Kaiqiong Sun “Vessel segmentation on angiogram using morphology driven deformable model”, Informatics in Control, Automation and Robotics (CAR), 2010 ,(Volume:2 ), pp.333 – 336.