ISSN 2319-7625 (Online) (An International Research Journal), www.chemistry-journal.org
Evaluation of Exchange-Correlation Functionals for
Calculating
1H and
13C NMR Chemical Shifts of a
Series of
Lactones and Lactams in Solution
Nadia FASKA* and Fatima EL BAZ
Faculty of Applied Sciences Ait Melloul, University Ibn Zohr Agadir, MOROCCO.
LCAPE, Department of Chemistry,
Faculty of Sciences, University Ibn Zohr Agadir, MOROCCO. email: [email protected].
(Received on: October 14, 2019)
ABSTRACT
Experimental and theoretical 1H and 13C NMR chemical shifts for a set of lactones and lactams were determined and analyzed. The theoretical NMR chemical shifts were calculated using density functional theory (DFT) and gauge independent atomic orbital (GIAO) approach in fourteen exchange-correlation functionals. The experimental versus computed chemical shift values for proton and carbon were compared and evaluated using linear correlation (R2), mean absolute error (MAE), mean squared error (MSE), and root mean squared error (RMSE) with respect to the relative ability of each functional to predicting 1H and 13C nuclear magnetic resonance spectra. For 13C NMR chemical shifts, statistical evaluation of data indicates that the most accurate prediction of 13C chemical shifts is achieved at B3PW91, wB97XD, and CAM-B3LYP functionals, although B3PW91 proved marginally superior to the others. For 1H shift data, the best results were obtained using the B3LYP, B3PW91, and MPW1PW91 functionals. The calculated results of 1H and 13C NMR chemical shifts for all the nuclei studied in the series of lactones and lactams are in good agreement with the experimental data.
Keywords: Chemical shifts, density functional theory, lactones, lactams, GIAO.
INTRODUCTION
quality with those of more elaborate ab initio methods at a fraction of the computational cost.1, 2 DFT calculation of NMR shielding at very accurate levels of approximation are available at
literature.3-7 The most common method of performing this calculation is the gauge-including
atomic orbital (GIAO) method8,9, but other methods include individual gauge origins for
different localized molecular orbitals (IGLO)10, 11 and individual gauges for atoms in
molecules (IGAIM)12, 13. The GIAO-DFT approach is thought to provide satisfactory chemical
shifts for various nuclei14-16 with larger molecules.
A large number of studies report the experimental NMR spectra and comparison with theoretical predictions. Guzzo et al. evaluated the exactitude of DFT for the calculation of 1H
and 13C chemical shifts in calix[4]arenes. They reported that the B3LYP, B3PW91, and
PBE1PBE for 1H NMR chemical shifts and M06-2X, ωB97X-D, and LC-WPBE for 13C NMR
chemical shifts using the 6-31+G(d,p) method provides highly accurate qualitative and quantitative data.17 Costa et al. found that the ωB97X-D/6-31G(d,p) is an accurate method for
calculating the NMR spectra of aromatic compounds.18, 19 Kart et al. have confirmed the
suitability for 1H NMR prediction with the B3LYP6-311G(d,p) functional within
azocalix[4]arenes in CDCl3 solvent.20 A similar study was carried out by Hill et al. with the
B3LYP/6-31++G(d, p) in drug molecules21 and Lampert et al. who used three levels of theory
(HF, B3LYP and BLYP) and four basis sets from (6-31G(d,p), to 6-311++G(2df,2dp) in phenol and 2-hydroxybenzoyl compounds.22
In this work we report DFT 1H and 13C NMR calculations using the GIAO method
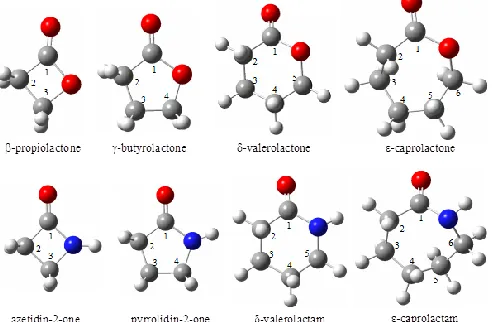
and TMS as reference, for a series of lactones: β-propiolactone, γ-butyrolactone, δ -valerolactone and ε-caprolactone, and lactams: azetidin-2-one, pyrrolidin-2-one, δ -valerolactam, and ε-caprolactam (see Fig. 1) in dichloromethane solution to assess the ability of different exchange-correlation functionals to reproduce experimental 1H and 13C NMR
spectra measured in 𝐶𝐷2𝐶𝑙2 solution. Lactones and lactams are chosen because of their
biological interests. The lactone group is present in a large series of pharmaceutical medication23,24. Lactamic group is the base of many antibiotics.25
MATERIAL AND METHODOLOGY
1. NMR spectra acquisition
The 1H and 13C NMR spectra were obtained at ambient temperature in deuterated
dichloromethane 𝐶𝐷2𝐶𝑙2 in a dedicated 5 mm probe. NMR spectra were acquired with a
Bruker 300 spectrometer at 300.13 MHz for 1H (65 k data points, 30o excitation pulse duration
of 8.7 s, spectral width of 5 kHz, acquisition time of 7.81 s and relaxation delay of 2 s) and at 75.47 MHz for 13C (65 k data points, 45o excitation pulse duration of 6.7 s, spectral width
of 18 kHz, acquisition time of 1.82 s and relaxation delay of 2 s). The chemical shifts were related to Tetramethylsilane TMS as an internal standard (δ = 0.00). The general reproducibility of chemical shift data was estimated to be better than ± 0.01 ppm. All compounds were available commercially and were dried and purified before use. Their purities were checked from their 1H and 13C spectra. The samples were prepared by weight and
volumetrically.
2. Computational Details
All of the DFT computations have been carried out with the Gaussian 09 computational chemistry software26, using 14 exchange-correlation XC functionals in the DFT
benchmarking, including: B3LYP27, 28, B3PW9129, BP8630, BPV8631, CAM-B3LYP32,
LSDA33, LC-wPBE34, M06-2X35, MPW1PW9136, PBEPBE37, 38, HSEH1PBE39, HCTH40,
TPSSTPSS41 and wB97X-D.42 The origins, nomenclature and characteristics of the
exchange-correlation XC functionals studied have been described elsewhere.43 After geometry
optimization using the 6-311G+(2d, p) basis set, the harmonic frequencies were calculated at the same level. The absence of imaginary frequencies verified that all structures were true minima at their respective levels of calculation.
For the 1H and 13C chemical shifts, we employed the Gauge-Independent Atomic
Orbital (GIAO) method.8, 9 In all cases absolute isotropic magnetic shieldings (𝜎) were
transformed into chemical shifts (𝛿/𝑝𝑝𝑚) by reference to the shieldings of a standard compound Tetramethylsilane (TMS) calculated at the same level. (Equation. 1)
𝛿𝑐𝑎𝑙 = 𝜎𝑇𝑀𝑆− 𝜎 (1)
We computed the effects of solvation using Barone and Cossi’s implementation of the polarizable conductor model (CPCM)44 at 6-311+G(2d,p) level, which is based on the
3. Statistical analyses
The quality between the calculated and experimental NMR spectra was analyzed by using a variety of statistical methods. The mean absolute error (MAE / ppm, Eq.3); the mean squared error (MSE / ppm2, Eq. 4); the root mean squared error (RMSE / ppm, Eq.5) and
Chi-squared (𝜒2 / ppm, Eq. 6). Statistical analyses were carried out to determine which method produced the best results. Statistical analyses were performed using Microsoft Excel 2013.
𝑀𝐴𝐸 =∑𝑛𝑖=1|𝛿𝑖𝑐𝑎𝑙−𝛿𝑖𝑒𝑥𝑝|
𝑛 (2)
𝑀𝑆𝐸 =∑ (𝛿𝑖𝑐𝑎𝑙−𝛿𝑖𝑒𝑥𝑝) 2 𝑛
𝑖=1
𝑛 (3)
𝑅𝑀𝑆𝐸 = √𝑀𝑆𝐸 = √𝑛1∑ (𝛿𝑖𝑐𝑎𝑙− 𝛿 𝑖𝑒𝑥𝑝)
2 𝑛
𝑖=1 (4)
𝜒2 = ∑ (𝛿𝑖𝑐𝑎𝑙−𝛿𝑖𝑒𝑥𝑝) 2
𝛿𝑖𝑐𝑎𝑙 𝑛
𝑖=1 (5)
Where n is the total number of chemical shifts under consideration. In addition to the MAE, MSE, RMSE and 𝜒2 analyses, least-squares linear regression analysis was used to compare the calculated versus experimental 13C chemical shifts.
RESULTS AND DISCUSSION
The 1H and 13C NMR chemical shifts were computed using Fourteen different
exchange-correlation functionals described previously using the GIAO method and 6-311+G(2d,p) basis set in dichloromethane solvent. TMS was used as a reference in calculating and measuring the 1H and 13C chemical shifts. We have grouped our experimental and
calculated results by compounds rang: lactones and lactams.
Overall, the calculated 1H and 13C NMR spectra are in excellent quantitative and
qualitative agreement with the experimental spectrum. After calculations of the 1H and 13C
NMR chemical shifts of lactones and lactams, ∆𝛿 was calculated according to Equation 6.
∆𝛿 = 𝛿𝑒𝑥𝑝− 𝛿𝑐𝑎𝑙 (6)
and theoretical values (∆𝛿), the most discrepant result for 13C values was obtained for the
carbon C1 of -Valerolactame and C4 of 𝜀-Caprolactone with a maximum ∆𝛿 = 13.150 ppm
and ∆𝛿 = 12.198 ppm respectively for HCTH exchange–correlation functionals.
For the 1H chemical shifts, the best results were obtained for the hydrogen atoms in 𝛼
position to the carbonyl group, in all compounds, and for the hydrogen of N-H group for lactams, which are acid hydrogens, with a minimum ∆𝛿(𝐶 − 𝐻𝛼) = 0.003 and 0.011 ppm
for 𝛿-Valerolactone and 2-Pyrrolidinone respectively at B3LYP, and ∆𝛿(𝑁 − 𝐻) =
0.015 ppm at MPW1PW91 for 𝛿-Valerolactame.
To quantify the performance of each functionals, the statistical analysis using mean absolute error (MAE), the mean squared error (MSE), root mean squared error (RMSE) and Chi-squared (𝜒2) was performed, and the results are also summarized in Tables 1–4 and figure 2. The MAE, MSE, and RMSE parameters are measures of the fitting error. These are used to estimate which functional gives a more accurate prediction, as smaller values indicate a smaller error. Pearson’s chi-squared 𝜒2 is also mean to express how good a model can fit the
experimental data, taking into account the sum of differences of observed and expected outcome frequencies.
As the data presented in Tables 2 and 4 indicate, for all carbon in selected compounds, the B3PW91 method for lactones and CAM-B3LYP for lactams (with dichloromethane solvation effects included) were able convincingly to predict 13C NMR chemical shifts. The
CAM-B3LYP exchange-correlation functionals give the smallest errors for lactams with 1.438 ppm for the mean absolute error (MAE) and 1.837 ppm for the root mean squared error (RMSE), ahead of B3PW91 and wB97XD (MAE values of 2.033 – 2.109 ppm, RMSE values 2.429 – 2.340 ppm respectively). The B3PW91 method for lactones gives the best results with MAE of 0,085 ppm. These values indicate that the XC functionals used in this work, perform satisfactorily when compared to the values presented in the literature from other studies.17, 21
The HCTH exchange-correlation functionals, enormously overestimate the 13C NMR chemical
shifts with MAEs of 4.714 and 5.050 ppm, RMS errors of 5.409 and 6.102 ppm (for lactones and lactams respectively).
For 1H NMR chemical shifts, the functionals with the best performance were B3LYP,
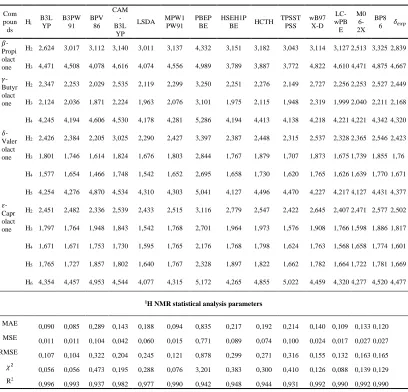
Table 1. The 1H NMR chemical shifts of lactones calculated using 14 exchange-correlation
functionals and 6-311G+(2d,p) basis set in 𝑪𝑫𝟐𝑪𝒍𝟐 solvent and experimental values (in ppm relative to TMS), and statistical parameters defined in equations. 2-5. MAE = mean absolute error; MSE = mean squared error; RMSE = the root mean squared error; 𝝌𝟐 = Chi-squared.
Com poun ds
Hi B3L
YP B3PW 91 BPV 86 CAM -B3L YP
LSDA MPW1 PW91
PBEP BE
HSEH1P BE HCTH
TPSST PSS wB97 X-D LC-wPB E M0 6-2X BP8 6 𝛿𝑒𝑥𝑝
𝛽 -Propi olact one
H2 2,624 3,017 3,112 3,140 3,011 3,137 4,332 3,151 3,182 3,043 3,114 3,127 2,513 3,325 2,839
H3 4,471 4,508 4,078 4,616 4,074 4,556 4,989 3,789 3,887 3,772 4,822 4,610 4,471 4,875 4,667
𝛾 -Butyr olact one
H2 2,347 2,253 2,029 2,535 2,119 2,299 3,250 2,251 2,276 2,149 2,727 2,256 2,253 2,527 2,449
H3 2,124 2,036 1,871 2,224 1,963 2,076 3,101 1,975 2,115 1,948 2,319 1,999 2,040 2,211 2,168
H4 4,245 4,194 4,606 4,530 4,178 4,281 5,286 4,194 4,413 4,138 4,218 4,221 4,221 4,342 4,320
𝛿 -Valer olact one
H2 2,426 2,384 2,205 3,025 2,290 2,427 3,397 2,387 2,448 2,315 2,537 2,328 2,365 2,546 2,423
H3 1,801 1,746 1,614 1,824 1,676 1,803 2,844 1,767 1,879 1,707 1,873 1,675 1,739 1,855 1,76
H4 1,577 1,654 1,466 1,748 1,542 1,652 2,695 1,658 1,730 1,620 1,765 1,626 1,639 1,770 1,671
H5 4,254 4,276 4,870 4,534 4,310 4,303 5,041 4,127 4,496 4,470 4,227 4,217 4,127 4,431 4,377
𝜀 -Capr olact one
H2 2,451 2,482 2,336 2,539 2,433 2,515 3,116 2,779 2,547 2,422 2,645 2,407 2,471 2,577 2,502
H3 1,797 1,764 1,948 1,843 1,542 1,768 2,701 1,964 1,973 1,576 1,908 1,766 1,598 1,886 1,817
H4 1,671 1,671 1,753 1,730 1,595 1,765 2,176 1,768 1,798 1,624 1,763 1,568 1,658 1,774 1,601
H5 1,765 1,727 1,857 1,802 1,640 1,767 2,328 1,897 1,822 1,662 1,782 1,664 1,722 1,781 1,669
H6 4,354 4,457 4,953 4,544 4,077 4,315 5,172 4,265 4,855 5,022 4,459 4,320 4,277 4,520 4,477
1H NMR statistical analysis parameters
MAE 0,090 0,085 0,289 0,143 0,188 0,094 0,835 0,217 0,192 0,214 0,140 0,109 0,133 0,120
MSE 0,011 0,011 0,104 0,042 0,060 0,015 0,771 0,089 0,074 0,100 0,024 0,017 0,027 0,027
RMSE 0,107 0,104 0,322 0,204 0,245 0,121 0,878 0,299 0,271 0,316 0,155 0,132 0,163 0,165
𝜒2
0,056 0,056 0,473 0,195 0,288 0,076 3,201 0,383 0,300 0,410 0,126 0,088 0,139 0,129
R2
Table 2. The 13C NMR chemical shifts of lactones calculated using 14 exchange-correlation
functionals and 6-311G+(2d,p) basis set in 𝑪𝑫𝟐𝑪𝒍𝟐 solvent and experimental values (in ppm relative to TMS), and statistical parameters defined in equations. 2-5. MAE = mean absolute error; MSE = mean squared error; RMSE = the root mean squared error; 𝝌𝟐 = Chi-squared.
Comp
ounds Ci B3L
YP B3P W91 BPV 86 CAM- B3LYP LSDA
MPW1 PW91 PBE PBE HSEH 1PBE HC TH TPSS TPSS wB97 X-D LC-wPBE
M06-2X BP86 𝛿𝑒𝑥𝑝
𝛽 -Propio
l actone
C1 171,267 166,911 165,662 168,917 169,796 166,186 165,570 165,249 162,685 163,568 170,986 164,858 177,813 165,651 167,600
C2 41,117 37,850 40,628 37,858 41,005 36,649 40,253 35,955 40,804 40,484 41,628 41,051 38,576 40,662 38,100
C3 60,088 56,326 59,394 56,817 59,860 54,890 58,996 53,754 59,480 58,418 59,215 59,712 55,106 59,357 57,700
𝛾 -Butyro
l actone
C1 180,058 175,660 174,980 174,694 180,981 174,859 174,981 180,113 172,505 173,379 174,720 173,581 187,097 174,990 177,451
C2 29,642 26,277 28,898 26,402 29,702 25,054 28,782 29,857 30,292 29,404 24,438 29,966 26,206 28,903 26,725
C3 25,590 21,832 25,261 21,582 25,007 20,557 25,152 25,441 27,093 25,992 19,455 24,000 20,435 25,283 21,354
C4 70,267 66,248 70,358 67,493 72,342 64,728 70,255 69,776 70,897 69,590 69,699 68,661 65,933 70,378 67,981
𝛿 -Valero
l actone
C1 171,209 170,806 165,549 171,146 170,934 171,403 165,468 171,269 163,493 164,508 172,217 175,343 178,381 165,543 170,377
C2 33,364 33,321 32,687 31,795 33,707 33,408 32,665 33,140 34,014 32,860 33,281 32,174 29,505 32,712 32,674
C3 24,828 24,554 24,540 20,427 24,183 24,614 24,609 24,387 26,895 25,189 18,095 21,880 18,728 24,575 18,231
C4 26,410 25,927 25,511 22,476 25,649 26,108 25,625 25,911 27,700 26,004 19,756 23,984 20,791 25,549 21,271
C5 72,565 72,326 72,748 68,747 74,069 72,153 72,736 72,026 73,215 71,696 65,824 70,420 68,232 72,777 68,454
𝜀 -Caprol actone
C1 178,167 173,694 172,879 175,900 176,993 178,215 172,957 178,196 170,590 171,376 178,821 181,670 190,319 174,449 174,802
C2 37,363 33,367 36,784 35,903 35,079 37,340 36,683 37,111 37,641 36,654 37,327 36,325 38,887 38,372 33,124
C3 33,040 28,434 32,682 28,603 26,615 32,578 32,252 32,482 34,074 32,290 25,865 23,765 26,323 27,814 27,989
C4 26,901 26,350 26,220 23,580 24,076 26,444 26,390 26,276 28,760 26,890 31,881 26,354 32,602 34,289 22,515
C5 33,083 28,541 32,073 29,150 30,289 32,597 32,858 32,507 34,704 32,798 32,294 30,293 33,169 31,678 28,936
C6 70,083 67,829 71,102 68,349 70,554 70,617 71,079 70,532 71,500 70,005 70,323 69,078 71,678 70,691 68,115
13
C NMR statistical analysis parameters
MAE 3,545 1,805 3,356 2,229 3,328 3,115 3,313 3,383 4,714 3,595 2,726 2,910 4,423 3,323 MSE 17,644 7,052 15,925 5,696 14,156 14,716 15,990 15,796 29,260 18,450 11,147 10,858 38,521 18,121 RMSE 4,201 2,656 3,991 2,387 3,763 3,836 3,999 3,974 5,409 4,295 3,339 3,295 6,207 4,257
𝜒2 9,029 4,203 7,987 2,823 7,201 7,561 7,970 8,241 13,097 8,670 5,050 4,106 8,115 8,967
R2 0,9995 0,9987 0,9994 0,9996 0,9991 0,9975 0,9993 0,9981 0,9992 0,9994 0,9972 0,9976 0,9963 0,9979
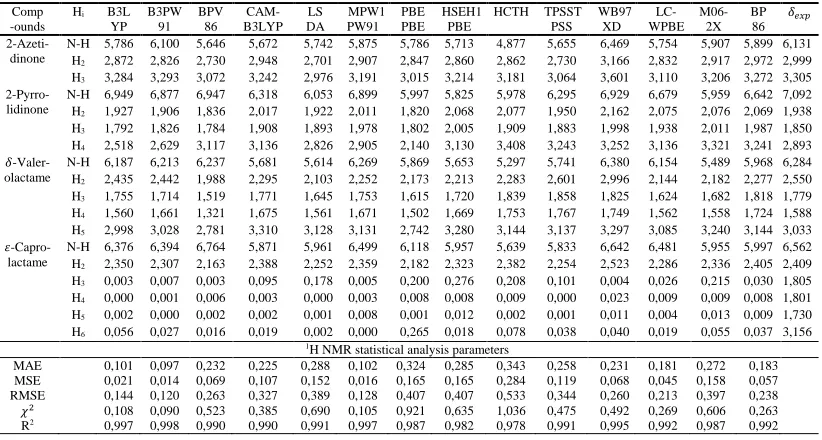
Table 3. The 1H NMR chemical shifts of lactams calculated using 14 exchange-correlation
functionals and 6-311G+(2d,p) basis set in 𝑪𝑫𝟐𝑪𝒍𝟐 solvent and experimental values (in ppm relative to TMS), and statistical parameters defined in equations. 5. MAE = mean absolute error; MSE = mean squared error; RMSE = the root mean squared error; 𝝌𝟐 = Chi-squared.
Comp -ounds
Hi B3L
YP B3PW 91 BPV 86 CAM-B3LYP LS DA MPW1 PW91 PBE PBE HSEH1 PBE
HCTH TPSST PSS WB97 XD LC-WPBE M06-2X BP 86 𝛿𝑒𝑥𝑝 2-Azeti-dinone
N-H 5,786 6,100 5,646 5,672 5,742 5,875 5,786 5,713 4,877 5,655 6,469 5,754 5,907 5,899 6,131 H2 2,872 2,826 2,730 2,948 2,701 2,907 2,847 2,860 2,862 2,730 3,166 2,832 2,917 2,972 2,999
H3 3,284 3,293 3,072 3,242 2,976 3,191 3,015 3,214 3,181 3,064 3,601 3,110 3,206 3,272 3,305
2-Pyrro-lidinone
N-H 6,949 6,877 6,947 6,318 6,053 6,899 5,997 5,825 5,978 6,295 6,929 6,679 5,959 6,642 7,092 H2 1,927 1,906 1,836 2,017 1,922 2,011 1,820 2,068 2,077 1,950 2,162 2,075 2,076 2,069 1,938
H3 1,792 1,826 1,784 1,908 1,893 1,978 1,802 2,005 1,909 1,883 1,998 1,938 2,011 1,987 1,850
H4 2,518 2,629 3,117 3,136 2,826 2,905 2,140 3,130 3,408 3,243 3,252 3,136 3,321 3,241 2,893
𝛿 -Valer-olactame
N-H 6,187 6,213 6,237 5,681 5,614 6,269 5,869 5,653 5,297 5,741 6,380 6,154 5,489 5,968 6,284 H2 2,435 2,442 1,988 2,295 2,103 2,252 2,173 2,213 2,283 2,601 2,996 2,144 2,182 2,277 2,550
H3 1,755 1,714 1,519 1,771 1,645 1,753 1,615 1,720 1,839 1,858 1,825 1,624 1,682 1,818 1,779
H4 1,560 1,661 1,321 1,675 1,561 1,671 1,502 1,669 1,753 1,767 1,749 1,562 1,558 1,724 1,588
H5 2,998 3,028 2,781 3,310 3,128 3,131 2,742 3,280 3,144 3,137 3,297 3,085 3,240 3,144 3,033
𝜀 -Capro-lactame
N-H 6,376 6,394 6,764 5,871 5,961 6,499 6,118 5,957 5,639 5,833 6,642 6,481 5,955 5,997 6,562 H2 2,350 2,307 2,163 2,388 2,252 2,359 2,182 2,323 2,382 2,254 2,523 2,286 2,336 2,405 2,409
H3 0,003 0,007 0,003 0,095 0,178 0,005 0,200 0,276 0,208 0,101 0,004 0,026 0,215 0,030 1,805
H4 0,000 0,001 0,006 0,003 0,000 0,003 0,008 0,008 0,009 0,000 0,023 0,009 0,009 0,008 1,801
H5 0,002 0,000 0,002 0,002 0,001 0,008 0,001 0,012 0,002 0,001 0,011 0,004 0,013 0,009 1,730
H6 0,056 0,027 0,016 0,019 0,002 0,000 0,265 0,018 0,078 0,038 0,040 0,019 0,055 0,037 3,156 1H NMR statistical analysis parameters
MAE 0,101 0,097 0,232 0,225 0,288 0,102 0,324 0,285 0,343 0,258 0,231 0,181 0,272 0,183 MSE 0,021 0,014 0,069 0,107 0,152 0,016 0,165 0,165 0,284 0,119 0,068 0,045 0,158 0,057 RMSE 0,144 0,120 0,263 0,327 0,389 0,128 0,407 0,407 0,533 0,344 0,260 0,213 0,397 0,238
𝜒2 0,108 0,090 0,523 0,385 0,690 0,105 0,921 0,635 1,036 0,475 0,492 0,269 0,606 0,263
Table 4. The 13C NMR chemical shifts of lactams calculated using 14 exchange-correlation
functionals and 6-311G+(2d,p) basis set in 𝑪𝑫𝟐𝑪𝒍𝟐 solvent and experimental values (in ppm relative to TMS), and statistical parameters defined in equations. 2-5. MAE = mean absolute error; MSE = mean squared error; RMSE = the root mean squared error; 𝝌𝟐 = Chi-squared.
Comp- ounds
Ci B3L
YP B3PW
91 BPV
86 CAM-B3L-YP
LSDA MPW1 PW91
PBEP BE
HSEH 1PBE
HCTH TPSS TPSS
wB97 X-D
LC-wPBE
M06-2X
BP86 𝛿𝑒𝑥𝑝
2-Azeti- dinone
C1 174,633 166,922 160,533 173,227 165,697 167,838 160,263 167,585 158,357 159,446 169,350 170,282 176,018 167,094 169,600
C2 42,781 42,194 41,117 42,866 42,073 42,333 40,851 41,794 41,736 41,221 42,122 41,088 39,036 40,686 38,300
C3 38,098 37,834 36,689 37,560 36,002 37,794 36,189 37,201 38,094 37,756 37,491 35,895 32,021 37,245 35,300
2-Pyrrol- idinone
C1 179,466 178,762 173,069 180,560 179,379 179,591 174,807 174,479 170,066 171,132 181,107 178,375 189,126 176,507 179,400
C2 31,384 31,726 30,503 28,290 31,568 31,868 30,365 31,477 31,818 30,667 31,980 31,743 32,996 31,970 30,500
C3 24,352 24,449 23,905 20,213 23,480 24,514 23,815 24,176 25,987 24,706 24,096 22,472 24,168 24,478 21,000
C4 44,205 44,430 44,194 39,969 44,654 44,374 44,008 44,062 45,436 44,469 43,864 42,175 44,423 44,723 42,600
-Valero-
lactam e
C1 179,289 167,659 168,798 173,623 170,976 167,218 173,669 167,223 159,650 161,620 169,144 167,803 181,785 170,165 172,800
C2 34,568 30,413 27,281 30,885 34,905 29,188 33,702 29,226 32,348 31,611 28,252 23,278 30,016 33,846 31,600
C3 25,355 21,050 19,463 20,986 24,791 19,804 24,765 19,843 24,311 23,182 19,570 18,496 20,248 25,025 22,500
C4 26,145 21,675 20,493 22,013 25,229 20,508 24,111 20,568 24,577 23,492 19,429 17,520 19,058 24,308 21,400
C5 45,756 41,771 42,956 41,350 46,433 40,386 45,454 40,426 44,130 43,624 40,121 32,959 40,594 45,852 42,200
ε -Caprol- actame
C1 182,376 178,592 178,664 180,431 179,128 179,438 179,600 173,331 169,964 168,680 179,854 178,972 182,845 176,241 179,600
C2 39,807 39,569 38,253 36,320 40,800 39,589 39,264 39,408 40,155 36,529 39,552 38,516 41,245 40,850 36,900
C3 27,136 26,537 25,442 22,825 26,368 26,626 26,616 26,477 28,983 24,644 26,083 23,963 26,544 25,038 23,400
C4 34,672 32,028 31,267 30,181 35,039 34,105 31,457 34,070 36,202 31,896 31,362 30,809 34,475 33,877 29,900
C5 34,298 33,453 32,147 31,389 35,642 33,677 33,337 34,590 35,197 30,966 32,474 31,235 35,671 34,753 30,700
C6 45,611 42,431 41,357 41,423 46,186 45,410 45,328 45,239 46,748 43,067 43,950 43,893 45,894 44,940 42,600
13C NMR statistical analysis parameters
MAE 3,313 2,033 2,529 1,438 2,805 2,478 2,524 2,984 5,010 3,344 2,109 2,457 3,777 2,782 MSE 13,163 5,902 11,156 3,376 10,083 7,968 10,360 11,081 37,229 25,575 5,474 12,797 20,080 8,351 RMSE 3,628 2,429 3,340 1,837 3,175 2,823 3,219 3,329 6,102 5,057 2,340 3,577 4,481 2,890
𝜒2 5,315 2,421 3,085 1,325 4,773 3,603 3,085 3,740 8,643 3,980 2,877 7,955 5,465 3,687
R2 0,9994 0,9991 0,9983 0,9992 0,9994 0,9984 0,9987 0,9986 0,9991 0,9995 0,9986 0,9968 0,9981 0,9998
In Figure 2, we present the performance of the selected exchange-correlation functionals for the calculation of 13C chemical shifts of selected lactones and lactams based on
Fig 2. Results from the statistical treatment MAE, MSE, RMSE, and 𝝌𝟐 of the theoretical calculations 1H
and 13C NMR chemical shifts in the studied lactones and lactams.
In addition to the MAE, MSE, RMSE and 𝜒2analyses, least-squares linear regression analysis was used to compare the calculated versusexperimental 1H and 13C chemical shifts.
The regression coefficients, R2, in Tables 1-4 indicate that calculated values are strongly
correlated to the experimental shifts: all R2 values are reveals than 0.980 for 1H chemical shifts
and 0.996 for 13C NMR data. The agreement between theory and experiment is quite
impressive; indicating that for this level of calculation, there is no need for any ad hoc scaling of the calculated results.
CONCLUSION
As a result, DFT methods have become the dominant approach for modeling chemical shieldings. In this study, the results of experimental and DFT level of theory with the combination of GIAO NMR method and 6-311G+(2d, p) basis set are reported. We have tested the performances of several exchange–correlation DFT functionals in describing 1H and 13C
chemical shifts for some lactones and lactams and compared them with experimental data. The statistical comparison between deferent functionals reveals that B3PW91, wB97XD, and CAM-B3LYP are more accurate in the calculation of 13C chemical shifts. For 1H shift data,
REFERENCES
1. J. K. Labanowski, J. W. Anzelm, Density Functional Methods in Chemistry; Springer-Verlag: New York, (1991).
2. G. E. Scuseria, J.Chem.Phys, 97, 7528–7530 (1992).
3. M. B. Ferraro, J.Mol. Struc: THEOCHEM, 528, 199–209 (2000). 4. I. Alakorta, J. Elguero, Structural Chemistry, 4, 377-389 (2003).
5. P. Chomoch, L. Stefaniak, E. Melzer, S. Baloniak, G.A. Webb, Magnetic Resonance in Chemistry, 37, 493–497 (1999).
6. G. Berionni, B. Pegot, G. Régis, Magnetic Resonance in Chemistry, 48, 101-110 (2009). 7. J.A. Dabado, N. Benkadour, S. Melchor, D. Portal, J.Mol.Struc: THEOCHEM, 672, 127–
132 (2004).
8. K. Wolinski, J. F. Hilton, P. Pulay, J.Am.Chem.Soc, 112, 8251-60 (1990).
9. J. R. Cheeseman, G. W. Trucks, T. A. Keith, M. J. Frisch, J.Chem.Phys, 104, 5497-509 (1996). 10. M. Schindler, Magn.Reson.Chem, 26, 394–407 (1988).
11. W. Kutzelnigg, U. Fleischer, M. Schindler, NMR Basic Principles and Progress, 165-262 (1990). 12. T. A. Keith, R. F. W. Bader, Chem.Phys.Lett, 194, 1–8 (1992).
13. N. H. Werstiuk, J. Ma, Canadian Journal of Chemistry, 74, 875–884 (1996). 14. M. Barfield, P. Fagerness, J.Am.Chem.Soc, 119, 8699–8711 (1997).
15. B. Osmialowski, E. Kolehmainen, R. Gawinecki, Magn.Reson.Chem, 39, 334–340 (2001). 16. K.Dybiec, A. Gryff-Keller, Magn.Reson.Chem, 47, 63–66 (2009).
17. R. N. Guzzo, M. J. C. Rezende, V. Kartnaller, J. W. de M. Carneiro, S. R. Stoyanov, L. M. da. Costa, 1157, 97–105 (2018).
18. L. M. Da Costa, S. Hayaki, S. R. Stoyanov Phys Chem Chem Phys 14, 3922 (2012). 19. L. M. Da Costa, S. R. Stoyanov, S. Gusarov, X. Tan, M. R. Gray, J. M.Stryker, A.
Kovalenko, Energy & Fuels, 26, 2727–2735 (2012).
20. H. H. Kart, A. Bayrakdar, S. Elcin, H. Deligoz, M. Karabacak, Spectrochim Acta - Part A Mol Biomol Spectrosc 146, 151–162 (2015).
21. D. E. Hill, N. Vasdev, J. P. Holland, Comp.Theo.Chem, 105, 161–172. H (2015). 22. Lampert, W. Mikenda, A. Karpfen, H. Kählig, J.Phys.Chem A, 101, 9610–9617 (1997). 23. F. M. Dean, Naturally Occurring Oxygen Ring Compounds; Butterworth: London., (1963). 24. G. Rousseau, Tetrahedron, 51, 2777–2849 (1995).
25. M. S. Wilke, A. L. Lovering, N. C. Strynadka, Curr.Opin. Microbiol 8, 525–533 (2005). 26. M. J. Frisch, G. W. Trucks, H. B. Schlegel & all, Gaussian, Inc., Wallingford CT, (2009). 27. A.D. Becke, Journal of Chemical Physics, 98, 5648-5652 (1993).
28. K. Burke, J.P. Perdew, Y. Wang, Electron density functional theory: Recent Progress and New Directions, Ed. J. F. Dobson, G. Vignale, and M. P. Das (Plenum, 1998).
29. A.D. Becke, Physical Review A, 38, 3098–3100 (1988). 30. J.P. Perdew, Physical Review, B 33, 8822-8824 (1986).
31. T. Yanai, D. P. Tew, N. C. Handy, Chem.Phys.Lett, 393, 51–57 (2004).
34. Y. Zhao and D. G. Truhlar, Journal of Physical Chemistry, 110, 5121-29 (2006). 35. C. Adamo, V. Barone, J.Chem.Phys, 108, 664–675 (1998).
36. J.P. Perdew, K. Burke, M. Physical Review Letters, 77, 3865-3868 (1996). 37. J.P. Perdew, K. Burke, M. Ernzerhof, Physical Review Letters, 78, 1396 (1997).
38. T. M. Henderson, A. F.Izmaylov, G. Scalmani, G. E. Scuseria, Journal of Chemical Physics, 131, 044108 (2009).
39. A. D. Boese, N. C. Handy, J.Chem.Phys, 114, 5497–5503 (2001).
40. J. Tao, J. P. Perdew, V. N. Staroverov, G. E. Scuseria, Physical Review Letters, 91, 1-4 (2003).
41. M. M. Quintal, A. Karton, M. A. Iron, A. D. Boese, J. M. L. Martin, J. Phys. Chem A, 110, 709–716 (2006).
42. V. Barone, M. Cossi, J. Phys. Chem A, 102, 1995–2001 (1998).
43. E. Cancès, B. Mennucci, J. Tomasi, J.Chem.Phys, 107, 3032–3041 (1997).