HIGHLIGHTED ARTICLE INVESTIGATION
Genetic In
fl
uences on Brain Gene Expression in Rats
Selected for Tameness and Aggression
Henrike O. Heyne,*,†,1Susann Lautenschläger,†Ronald Nelson,‡François Besnier,‡,§Maxime Rotival,** Alexander Cagan,* Rimma Kozhemyakina,††Irina Z. Plyusnina,††,2Lyudmila Trut,††Örjan Carlborg,‡
Enrico Petretto,** Leonid Kruglyak,‡‡,§§,*** Svante Pääbo,* Torsten Schöneberg,†and Frank W. Albert*,‡‡,1 *Department of Evolutionary Genetics, Max Planck Institute for Evolutionary Anthropology, 04103 Leipzig, Germany,†Institute for Biochemistry, University of Leipzig, Medical Faculty, 04103 Leipzig, Germany,‡Swedish University of Agricultural Sciences, Department of Clinical Sciences, Division of Computational Genetics, Box 7078 SE-75007 Uppsala, Sweden,§Section of Population Genetics and Ecology, Institute of Marine Research, Havforskningsinstituttet, Postboks 1870, Nordnes 5817, Bergen, Norway, **MRC Clinical Sciences Centre, Faculty of Medicine, Imperial College London, London W12 0NN, United Kingdom,††Institute of Cytology and Genetics, Siberian Branch of the Russian Academy of Sciences, 630090 Novosibirsk, Russia,‡‡Department of Human Genetics,§§Department of Biological Chemistry, and ***Howard Hughes Medical Institute, Gonda Center, University of California, Los Angeles, California 90095
ABSTRACTInterindividual differences in many behaviors are partly due to genetic differences, but the identification of the genes and variants that influence behavior remains challenging. Here, we studied an F2intercross of two outbred lines of rats selected for tame and aggressive behavior toward humans for .64 generations. By using a mapping approach that is able to identify genetic loci segregating within the lines, we identified four times more loci influencing tameness and aggression than by an approach that assumes fixation of causative alleles, suggesting that many causative loci were not driven tofixation by the selection. We used RNA sequencing in 150 F2animals to identify hundreds of loci that influence brain gene expression. Several of these loci colocalize with tameness loci and may reflect the same genetic variants. Through analyses of correlations between allele effects on behavior and gene expression, differential expression between the tame and aggressive rat selection lines, and correlations between gene expression and tameness in F2animals, we identify the genesGltscr2,Lgi4,Zfp40, andSlc17a7as candidate contributors to the strikingly different behavior of the tame and aggressive animals.
B
EHAVIORAL differences among members of a species are in part due to genetic variation. The identification of the genes and variants that influence behavior remains challenging. In human genome-wide association studies of psychiatric and cognitive traits, the identified loci typically explain only a small fraction of the heritability,i.e., the additive genetic contributionto the trait (Watanabeet al.2007; Hovatta and Barlow 2008; Dearyet al. 2009; Otowaet al. 2009; Calboli et al. 2010; Terracciano et al. 2010; Flint and Munafo 2013; Rietveld
et al.2013; Sokolowska and Hovatta 2013). In experimental crosses in model species, especially between inbred lines, the identified loci (termed quantitative trait loci, QTL), often ex-plain much more of the heritability (Lynch and Walsh 1998). However, in this design the spatial resolution is limited—the QTL are wide and contain many, sometimes hundreds of genes. With the exception of a handful of identified genes with quantitative effects on behavioral traits (Yalcin et al. 2004; Watanabe et al. 2007; McGrath et al.2009; Bendesky et al.
2012; Goodsonet al.2012), gene identification is particularly difficult for behavioral QTL that often have modest effect sizes (Flint 2003; Willis-Owen and Flint 2006; Wrightet al.2006; Hovatta and Barlow 2008).
The causal variants within a QTL can alter the protein se-quence encoded by a gene or affect gene expression. Such Copyright © 2014 by the Genetics Society of America
doi: 10.1534/genetics.114.168948
Manuscript received July 29, 2014; accepted for publication August 22, 2014; published Early Online September 3, 2014.
Supporting information is available online athttp://www.genetics.org/lookup/suppl/ doi:10.1534/genetics.114.168948/-/DC1.
Raw sequencing reads as well as expression data, inferred genotypes, and genotype probabilities are available in the ArrayExpress archive (http://www.ebi.ac.uk/ arrayexpress/) as accession no. ERP006055. We will provide IBD matrices upon request.
regulatory variants can be identified as “expression QTL” (eQTL). An attractive approach for nominating candidate genes underlying QTL is therefore to identify genes within the QTL regions whose expression is influenced by an eQTL in a tissue of relevance to the phenotype (Hubner et al.
2005; Petretto et al.2006b; Mackayet al.2009). This ap-proach has been successfully applied to quantitative traits in different species,e.g., yeast (Perlstein et al.2007), rats (Hubneret al.2005; Heiniget al.2010), mice (Mehrabian
et al.2005; Schadtet al.2005), and humans (Moffattet al.
2007; Musunuruet al.2010). A few eQTL studies have also recently been carried out to identify candidate genes for be-havioral QTL (Hitzemannet al. 2004; De Jonget al.2011; Sabaet al.2011; Kellyet al.2012).
Here, we studied two lines of rats (Rattus norvegicus) that, starting from one wild population, have been selected for in-creased tameness and inin-creased aggression toward humans, respectively. These experimental populations derive from the work of Dmitry K. Belyaev who, along with his famous related work in foxes (Belyaev 1979; Trut 1999), initiated the rat lines to study the evolution and underlying biological mechanisms of tameness as a crucial first step in animal domestication (Diamond 1999; Trut 1999; Wiener and Wilkinson 2011). For.64 generations, the tame rats were selected exclusively based on whether they tolerate or even seek out human con-tact, while the aggressive rats were selected to vigorously de-fend themselves from any attempted handling. This strong selection has resulted in two lines that respond extremely differently to attempts of handling. Whereas the aggressive rats attack and try to escape, the tame rats lack fear or aggres-sion. They tolerate handling and sometimes actively explore the approaching hand. The strong behavioral selection has resulted in a number of differences in morphology, neurotransmitters, and hormone levels (Naumenko et al.1989; Plyusnina and Oskina 1997; Albertet al.2008).
Cross fostering experiments excluded postnatal maternal effects as a major influence on tameness and aggression in these animals, suggesting a substantial genetic contribution to the behavior (Albertet al.2008; Plyusninaet al.2009). To gain insight into the genetic basis of tameness and associated phenotypes, we earlier bred an F2intercross between the tame and aggressive rat lines (Albertet al.2009). Genetic mapping in 700 rats from this population revealed two genome-wide sig-nificant QTL for tameness. Three additional loci were found as part of an epistatic network influencing tameness (Albertet al.
2009). However, these QTL harbor hundreds of genes, and in-dividual genes influencing the behavior remain unknown.
The tame and the aggressive selection lines originate from one wild population. Throughout selection, the populations were kept as outbred as possible by avoiding matings between close relatives. Together with the limited number of gener-ations and the modest population sizes since initiation of the lines, these characteristics make it unlikely that tameness and aggression are mainly caused by new mutations arising after the animals were caught. Instead, most genetic variants that were selected are expected to be due to standing variation
already present in the wild population. We earlier confirmed the existence of considerable DNA sequence variation both between and within each of the two lines (Albertet al.2011). Therefore, it seems plausible that alleles influencing behavior segregate not only between but also within the lines. QTL analyses that assumefixation of causative alleles could miss important sources of genetic variation.
Here, we used mRNA sequencing to quantify gene expres-sion in the brains of 150 rats from the F2intercross population. These data were used to map eQTL influencing differences in expression levels, using a QTL mapping method (flexible in-tercross analysis, FIA) (Rönnegård et al. 2008) that can ac-count for segregating variation within the founders of a cross between two outbred lines. Using FIA, we also found four times as many loci influencing tameness than previously seen (Albert et al.2009). We identify multiple genes within the tameness QTL whose expression in the brain is influenced by the genetic variants from the tame- and aggressive lines. By combining correlations of allele effects on behavior and gene expression, differential brain gene expression analyses be-tween the tame and aggressive rat lines and correlation with tameness in F2animals, we prioritize genes whose altered expression may be influencing tameness.
Materials and Methods
Rat populations
The tame and aggressive rat populations are derived from a long-term selective breeding experiment that was initiated in 1972 in the Institute of Cytology and Genetics in Novosibirsk, Russia (Naumenkoet al.1989). Two rat (R. norvegicus) lines were selected from one wild-caught population for the single criterion of increased tameness and increased aggression when confronted with a human hand. The original population con-sisted of 200 animals. At each generation, the 30% most tame and most aggressive individuals were selected for further breeding. Inbreeding was avoided in both strains by avoid-ing matavoid-ing between close relatives. In 2005, subpopulations from both lines were transferred to Leipzig to study the genetic basis of the tameness (Albertet al.2008, 2009, 2011, 2012). During all care-taking procedures and experiments, animals from different lines and generations were treated identically. The study was approved by the regional government of Saxony (TVV Nr. 29/95).
Selection of F2animals based on extreme tameness/
aggression
measures. Thefirst principal component provides a quantitative measurement for tameness (Albertet al.2009). For the pres-ent study, we used stored organs from the 75 tamest and the 75 most aggressive F2animals.
Tissue collection
Animals were earlier anesthetized by CO2and killed by cervical dislocation (Albertet al.2009). Tissues were collected, snap frozen in liquid nitrogen, and stored at280°. Before freezing, each brain was dissected to separate the brainstem and cer-ebellum from the fore- and midbrain.
For the current study, brains were cut with a scalpel along the midsagittal plane in two hemispheres at220°. Before dis-section, tissues were left to equilibrate to 220°for at least half an hour to obtain the best consistency during cutting. To protect RNA quality, brains were never completely thawed during dissection. Complete right brain hemispheres comprising tel-, di- and mesencephalon were used. Frozen hemispheres were homogenized in 5 ml of TRIzol (Invitrogen, Darmstadt, Germany) in glass tubes using a Schütt homogenizer with 3000 rpm for 13 rounds. A total of 2.5 ml of TRIzol was added afterward to obtain afinal volume of 7.5 ml of TRIzol per brain hemisphere.
cDNA library preparation
RNA was extracted by chloroform extraction and purified with the Qiagen RNEasy MinElute Clean-up kit according to the manufacturer’s instructions. All RNA samples were of high quality as judged by Agilent Bioanalyzer (Agilent Tech-nologies, Böblingen, Germany). RNA integrity numbers (RINs) (Schroederet al.2006) for all samples ranged from 8.5 to 10, where 10 corresponds to maximum RNA quality (
Support-ing Information,Table S1). RNA-seq libraries were generated
according to in-house protocols; for details see Kuhlwilmet al.
(2013). mRNA was extracted from 10 mg of total RNA by capture on poly-T-covered magnetic beads, chemically frag-mented, and used as template for cDNA synthesis using ran-dom hexamer primers. Double-stranded cDNA was blunt ended and Illumina sequencing adapters were ligated to the cDNA. To minimize potential batch effects, balanced numbers from the tame and the aggressive groups of F2animals were pro-cessed together throughout RNA extraction and library gen-eration and distributed evenly across sequencing runs.
Sequencing
Libraries were adjusted to a concentration of 10 nM and in-dividuals distributed into three different pools, each consisting of equal numbers of tame and aggressive individuals. They were then sequenced to a median coverage of 10.8 million reads per animal [standard deviation (SD)60.8 million reads per animal] on Illumina Genome Analyzer 2 machines (Illumina, San Diego) with 76-bp single end reads. We called bases using Ibis (Kircheret al.2009). Adapter sequences were trimmed, adapter dimers excluded, and the readsfiltered for quality. Raw sequenc-ing reads are available in the ArrayExpress archive (http://
www.ebi.ac.uk/arrayexpress/) as accession no. ERP006055.
Read mapping and gene expression quantification
Reads were mapped to the rat genome (assembly and gene annotation RGSC 3.4) with the program TopHat, version 1.4.1 (Trapnellet al.2009). We ran TopHat with the transcriptome index option and provided the program with a transcriptome sequencefile obtained from Ensembl release 69. With this op-tion, TopHatfirst aligns reads to the virtual transcriptome be-fore mapping unmapped reads to the whole genome.
Gene expression was then quantified using the program Cufflinks (Trapnellet al.2010) version 1.3.0, with the follow-ing parameters: We employed the fragment bias correction algorithm, which aims to account for sequence-specific biases introduced by the use of random hexamer primers (Robertset al.
2011). We further provided Cufflinks with the median read length for each library as measured with the Agilent BioAnalyzer before sequencing. Further, we supplied Cufflinks with a reference annotationfile to quantify whole gene and different isoform expression, using the Ensembl release 69 gene annotation. Any alignments not compatible with any reference transcripts were ignored. We thus did not search for novel genes and did not attempt to alter the gene models represented in the Ensembl annotation. Unless otherwise noted, we used fragments per kilobase of transcript per million fragments mapped (FPKM) expression values (Trapnellet al.2010) for further analyses. In FPKM, the RNA-seq data are normalized to the length of each gene and the total number of aligned reads in the library (Trapnellet al.2010). FPKM values were transformed using log2 (FPKM+1). Expression data are available in the ArrayExpress archive (http://www.ebi.ac.uk/arrayexpress/) as accession no. ERP006055. All further analyses were done in the R environ-ment (R Developenviron-ment Core Team 2012).
Gene expression preprocessing
We retained for analyses all genes for which Cufflinks reported expression levels, resulting in quantifications for 24,139 genes. To avoid confounding by potential batch effects (Leek et al.
2010), we corrected the expression data for batches defined by groups of samples processed on the same date (Table S1). This was done byfitting a linear model with gene expression as the response variable and batch as the predictor variable. We used the residuals of the model as batch-corrected gene expression traits. To additionally account for unknown un-wanted sources of variation, we computed surrogate variables of the gene expression matrix by using the R package Surro-gate Variable Analysis (SVA) (Leek and Storey 2007; Leek
for sex or a correction for sex and RNA library processing batch (Table S2). We also used the animals’sex as a covariate during eQTL mapping.
Genetic map construction
Genotypes at 152 microsatellite and 49 single-nucleotide poly-morphism (SNP) markers were used to build a 1728-cM genetic map as in Albert et al. (2009). Genotypes, genetic markers, marker positions, and pedigree data were the same as for the QTL mapping of tameness described previously in Albertet al.
(2009). The probability of each F2allele to originate from either the tame or the aggressive line were recomputed using an updated algorithm where haplotypes and missing marker in-formation were inferred iteratively to reconstruct any missing genotypes. First, haplotypes were inferred from genotype and pedigree data with a custom implementation of the method described in Besnier and Carlborg (2009). In our implemen-tation, haplotype reconstruction steps were alternating with missing genotype inference steps. The two steps were run iteratively for each pedigree generation, in turn, until no new haplotype or missing genotype could be inferred. The proba-bility of each F2allele to originate from either the tame or the aggressive line were then reinferred from phased genotype and pedigree, using the identity by descent (IBD) matrix calculated as in Pong-Wonget al.(2001) and implemented in Besnier and Carlborg (2007). We will provide IBD matrices upon request.
eQTL mapping using Haley Knott regression
We searched for eQTL on autosomes in steps of 1 cM using Haley Knott regression (HKR) (Haley and Knott 1992) as implemented in the R package R/qtl (Broman et al.2003). The outbred cross dataset was prepared for use in R/qtl using the R package qtl.outbred (Nelsonet al.2011). Inferred genotypes and genotype probabilities are available in the ArrayExpress archive (http://www.ebi.ac.uk/arrayexpress/) as accession no. ERP006055. We used logarithm of odds (LOD) scores to quan-tify how strongly genetic variation across the genome infl u-ences the expression of a gene. To determine the significance threshold for QTL, we performed 1000 permutations across all 14,000 genes with sufficiently abundant expression (see below) by randomizing genotypes with respect to phenotypes and performing full genome scans for the permuted datasets. To calculate false discovery rates (FDRs), we divided the number of expected eQTL (as determined from the permuta-tions) by the number of eQTL observed in the real data at a given LOD threshold (Benjamini and Yekutieli 2005). We found that a LOD threshold of 5.28 results in an FDR of 5% and used this value as the significance threshold for further analyses. We report confidence intervals (CIs) for QTL loca-tion as 1.8-LOD drop intervals as recommended for F2 inter-cross designs in Broman and Saunak (2009).
Influence of sequencing depth on eQTL mapping
To evaluate to what extent sequencing depth influences the number of detected eQTL, we randomly selected 5000 genes, downsampled their expression data to different sequencing
depths, and repeated the eQTL mapping in these trimmed datasets. At each depth, we randomly permuted genotypes relative to phenotypes 10 times across the 5000 genes and determined the 99.9% quantile of the resulting distribution of LOD scores. This LOD score was used as the significance threshold for eQTL detection at the given depth. We cal-culated false discovery rates and recorded the number of eQTL that would have been found had we sequenced to this depth of coverage using the same procedure as described above (Figure S1).
False discovery rates as a function of gene expression level
To assess at which expression level genes can be measured accurately enough to give robust eQTL mapping results we calculated false discovery rates in bins of increasing gene expression levels (Figure S2). Genes were grouped accord-ing to their expression level into 24 bins, each containaccord-ing 1000 genes, except for the bin with the lowest expression, which contained 1139 genes. We performed 10 permutations within each of the 24 bins, determined the 99.9% quantile of permuted LOD scores, and used this LOD score as the eQTL detection threshold for the given bin. We found that the FDR stayed consistently,5% among the 14,000 most highly ex-pressed genes (Figure S2). At a 5% FDR, we identified 3.2 eQTL per 100 genes when considering the 14,000 highest expressed genes as opposed to 1.7 eQTL per 100 genes when considering all genes. For all later analyses, we only used the 14,000 most highly expressed genes.
Flexible intercross analysis
Flexible intercross analysis (FIA) (Rönnegårdet al.2008) is a QTL analysis method for analyses of data from intercross populations that does not assume that the founder lines are
fixed for alternative QTL alleles. Here, we used FIA, as im-plemented in R scripts kindly provided by L. Rönnegård, to perform genome scans for tameness and gene expression. For tameness, significance thresholds were determined by 1000 random permutations. For expression data, hundreds of permu-tations for all genes were not computationally feasible even on a computer with hundreds of nodes. Instead, we approximated the score distribution for QTL under the null hypothesis using information from 30 permutations for each of 2000 randomly sampled genes. False discovery rates were estimated as de-scribed above for HKR.
We also conducted a targeted search for local eQTL by considering only the marker located closest to a given gene. This procedure increases statistical power by reducing the multiple testing burden. False discovery rates were estimated as described above, but using only permutations at the local markers.
FIA QTL confidence intervals
the FIA mapping score to the width of the HKR confidence in-terval. Using this function, we interpolated confidence intervals for all FIA QTL. To avoid unrealistically small confidence inter-vals for the most highly significant eQTL, we set the minimum size of the confidence intervals to 10 cM (Figure S3, A–C).
We compared our FIA eQTL confidence intervals to those obtained by bootstrapping (Manichaikulet al.2006). For each of 29 randomly selected eQTL, we computed 200 bootstraps by mapping in a dataset constructed by sampling with replace-ment from the 150 rats. In about half the cases, the bootstrap 95% confidence intervals delineate a narrow peak around the eQTL peak. Most of these bootstrap confidence intervals are completely contained in the respective confidence intervals derived as described above (Figure S4). About a third of the bootstrap confidence intervals were very large, in some cases extending across the whole chromosome (Figure S4). It is known that large confidence intervals can occur when QTL confidence intervals are estimated by bootstraps, especially when genetic markers are sparse, prompting recommenda-tions not to use bootstrapping to estimate QTL confidence intervals (Manichaikul et al.2006). Combined with the fact that the narrow bootstrap confidence intervals agree well
with our HKR-estimated CIs, this suggests that our approach described above provides a reasonable approximation for FIA eQTL confidence intervals.
eQTL were treated as local when the gene’s physical po-sition overlapped their confidence interval. Genetic positions in centimorgans were interpolated to the physical megabase scale and vice versa with the approx.fun function using coor-dinates given in table S2 of Albertet al.(2009) that contains the genetic and physical position of the markers that were used to build the genetic map.
eQTL and tameness QTL were treated as overlapping when their confidence intervals overlapped by at least 1 cM. In the test of whether windows within tameness QTL had more eQTL than the rest of the genome, we used nonoverlapping sliding windows with a width of 18 cM, which is the median confidence interval size of HKR eQTL.
Regional clustering of eQTL
We counted the number of genes with local eQTL in a sliding window analysis. Windows were advanced in 2-cM steps and had a width of 18 cM, which was the median confidence in-terval for eQTL in the HKR analysis. When calculating
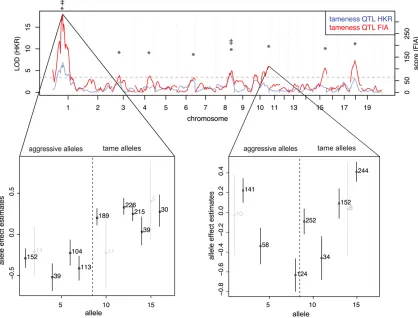
Figure 1 Tameness QTL mapping. Genome-wide statistical support for QTL affecting tameness in analyses assumingfixation of causal alleles within the
correlations between the numbers of genes located in an interval with the number of local eQTL, we used non-overlapping sliding windows of 18 cM to minimize depen-dencies between adjacent data points.
To test whether there are positions with more distant eQTL than expected, we determined the number of distant eQTL that would be expected to map to a given position in the genome if eQTL were positioned at random. We generated 1000 sets of random genomic positions for the distant eQTL, while keeping the number of eQTL per chromosome unchanged
(Figure S5). We used the 99% quantile of the resulting
distri-bution as the threshold to call significant eQTL clusters.
Coexpression networks
Weighted gene coexpression network analysis (WGCNA) (Langfelder and Horvath 2008) was used on the set of 14,000 expressed genes to detect clusters. Biweight correlation was used to identify clusters robust to outliers and all other para-meters were left to default. GO enrichment was performed using DAVID (Huanget al.2008). Transcription factor bind-ing site enrichment was performed usbind-ing PASTAA (Roider
et al. 2009): Sequences of 2 3 500 bp regions around the transcription start site of each gene were extracted from the BN genome and scored for JASPAR and transfac public tran-scription factor matrices. Clusters were then tested for enrich-ment of high binding affinity values.
Correlating allele effects of tameness QTL and expression QTL
If QTL for two different traits that are located at the same genomic position are caused by the same underlying variant, the effects of their alleles on the two traits should be correlated. To test this, we estimated the effect of each allele on a given trait as the mean phenotype of those F2animals that have inherited the given allele. The precision of this allele effect estimate is bounded by the structure of our experimental pedigree. Our F2animals derive from four animals from the tame and the aggressive selection line, respectively, such that there is a maximum of 16 different alleles segregating at each position in the F2population. Due to random segrega-tion and variable offspring number, the founder alleles differ in the number of F2individuals that carry them (Figure 1). The estimated effects of alleles that are inherited by many individ-uals are more precise than those carried by fewer individindivid-uals.
Further, some of the 16 founder alleles might be identical, so that the effective number of alleles will usually be lower than 16. We did not attempt to correct for differences in precision and did not attempt to formally group the founder alleles into functionally equivalent classes.
We performed two scans for allele effect correlations. In both scans, both local and distant eQTL were used. In the
first scan, we tested for correlation between those eQTL that overlap one of the eight FIA tameness QTL. The correlations were determined at the peak positions of the tameness QTL, irrespective of the location of the respective eQTL peaks. In the second scan, we tested all eQTL, irrespective of whether they overlapped a tameness QTL. These correlations were determined at the peaks positions of the eQTL. The two scans thus differ in several respects: the set of eQTL in the analyses, the precise positions tested (these can differ between the two scans even for pairs of tameness and eQTL represented in both scans) and the corrected significance threshold (due to different numbers of tests).
Differential gene expression in brains of animals from the tame and aggressive founder lines
Right brain hemispheres were harvested fromfive adult male rats from the tame and from the aggressive selection lines, re-spectively. mRNA was extracted as described above and fl uo-rescently labeled and hybridized to Affymetrix microarrays (GeneChip Rat Genome 230 2.0) following the manufacturer’s instructions. We mapped array probes to genes using reannotated chip definitionfiles (Daiet al.2005). Array normalization was performed using robust multiarray average (RMA) (Irizarryet al.
2003) and genes called as expressed using the Affymetrix MAS5 algorithm. Both RMA and MAS5 were used as implemented in the R bioconductor ‘affy’ package (Bolstad et al. 2003). Only genes where at least four of thefive animals in a group showed expression according to MAS5 were analyzed. We tested for differential expression between the tame and ag-gressive animals using t-tests. The FDR was determined by calculating all permutations that are possible in two groups of
five samples. For a range ofP-value cutoffs, we calculated the expected number of false positive tests as the median number of tests exceeding a given cutoff across permutations. The FDR was calculated as this expected number of false positive tests divided by the number of positive tests observed in the real data.
Table 1 Locations of FIA tameness QTL
Chromosome QTL start (cM) QTL peak (cM) QTL end (cM) QTL start (Mb) QTL peak (Mb) QTL end (Mb)
1 40.4 52.0 63.6 43.7 69.4 94.1
3 18.8 36.0 53.2 25.1 41.0 66.9
4 60.8 78.0 95.2 107.1 140.0 163.7
6 70.8 88.0 96.0 112.0 131.3 144.0
8 65.7 82.0 98.0 92.6 106.6 126.8
10 2.9 20.0 37.1 7.6 23.3 38.4
10 76.4 92.0 96.0 90.2 103.3 106.0
15 46.1 62.0 72.0 72.5 91.3 104.0
18 9.1 24.0 38.9 14.6 48.2 62.7
Correlation of gene expression levels and tameness in F2animals
We tested for correlation (Spearman rank correlation) be-tween gene expression levels and tameness. The FDR was determined by comparing the observed data to 100 permuted datasets.
Results
RNA sequencing
We selected the 75 tamest and the 75 most aggressive animals of the 700 F2 intercross rats bred for our earlier study (Albertet al.2009) for RNA sequencing. Nonstranded Illumina sequencing libraries were generated from polyA-enriched RNA from right cerebral hemispheres that were frozen as part of our earlier characterization of these animals. The RNA-seq libraries were sequenced to a median coverage of 10.8 million reads per animal (standard deviation, SD = 0.8 million reads). Of these, an average of 9.0 million reads (83% of total reads) mapped to the rat genome (SD = 0.6 million reads). Out of these, an average of 61.7% (SD = 2.1%) mapped unambiguously to known exons. Down-sampling analyses were used to evaluate the power of the study, and although these suggest that more eQTL could be found by increasing se-quencing coverage (Figure S1), the available coverage is ex-pected to be sufficient to discover hundreds of eQTL. Our strategy of selecting F2animals with extreme behaviors did not lead to notably skewed or bimodal gene expression dis-tributions (Figure S6), suggesting that this strategy does not complicate eQTL mapping.
Fixed genetic differences between the tame and aggressive rat populations influence brain gene expression levels
We began our search for eQTL using a method that assumes that the two founder populations are fixed for QTL alleles with different effects on expression (HKR) (Haley and Knott 1992); this method was also used in our earlier mapping study (Albertet al.2009). Because the accuracy of RNA-seq increases with increasing gene expression abundance, we limited our search to genes where eQTL can be detected with high statistical power (seeMaterials and Methods). In total, 443 eQTL were detected at a FDR of 5% using HKR
(Table S3). Thus, genetic differences between the tame and
the aggressive rats result in mRNA expression differences at hundreds of genes.
Genetic variation within the selection lines influences tameness and brain gene expression levels
To explore the contribution of within-line genetic variation on behavior and gene expression, we used FIA (Rönnegårdet al.
2008), a QTL mapping method that is able to detect loci that are notfixed between the tame and aggressive founders.
We first applied FIA to tameness and aggression in all 700 F2animals and found eight QTL affecting tameness and aggression at a 2% permutation-based FDR (Figure 1, Table 1). These QTL include the two previously identified QTL (Albert et al.2009). At the most significant FIA tameness QTL on chromosome 1 (corresponding to the“Tame-1”locus identified in Albertet al.(2009), the alleles carried by the tame and the aggressive individuals used to found the F2 pedigree have clearly different effects on tameness (Figure 1). However, more than one“aggressive”allele appears to exist among the four aggressive founder animals (Albert et al.
2011), and one of the four tame founders appears to be hetero-zygous for one“tame”and one aggressive allele. Nevertheless, the overall allelic differentiation between the tame and the ag-gressive founder individuals explains why this locus was also the strongest QTL identified by HKR. By contrast, the FIA QTL at the end of chromosome 10 that had the third highest signifi -cance did not correspond to a HKR QTL (Figure 1). The allelic effects at this locus are highly heterogeneous, with at least one tame and one aggressive allele segregating in both the tame and the aggressive founder animals. Thus, allowing causative alleles to segregate within the lines quadruples the number of detected tameness QTL, suggesting that the genetic basis of this behavior is considerably more complex than pre-viously appreciated.
Next, we asked how segregating allelic variation affects variation in brain gene expression levels. When using FIA for eQTL mapping, we detected 689 FIA eQTL influencing the expression of 670 genes at an FDR of 5% (Figure 2,Figure S7,
Table S4). Of these, 411 were also detected by HKR.
Con-versely, of the 443 HKR eQTL, all but 32 were detected by FIA. These 32 eQTL had low LOD scores close to the genome-wide significance threshold, lower than the HKR eQTL iden-tified with both HKR and FIA (Figure S8A, Wilcoxon rank
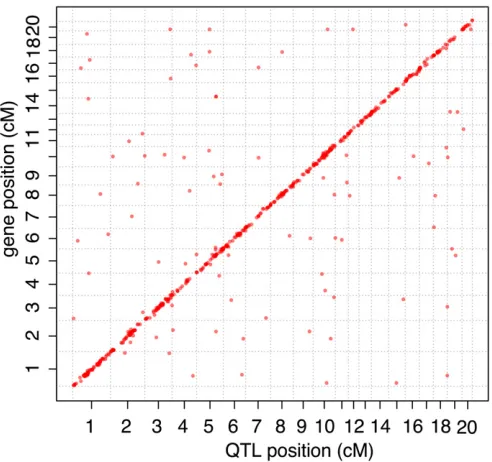
Figure 2 Brain expression QTL mapping. Locations of eQTL affecting
brain gene expression in an F2intercross between two rat lines selected
test: P= 6.9e-14). To be conservative, we excluded the 32 eQTL identified only by HKR from further analyses. While eQTL that were found only by FIA had, on average, lower scores than eQTL found with both HKR and FIA (Wilcoxon rank test P , 2.2e-16), many of them had FIA mapping scores that were highly significant (Figure S8B). Thus, FIA increased the number of detected eQTL by 68%, including some loci with strong effects on gene expression that were missed by HKR because their alleles segregate within the selection lines.
Genomic architecture of mRNA expression
Of the 689 FIA eQTL (Table S4), 561 were local eQTL close to the genes they influenced and 128 were distant eQTL that did not overlap the position of the affected gene. Local eQTL had higher mapping scores than distant loci (Wilcoxon rank test, P = 1.7e-07). This is consistent with previous work showing that while both local and distant eQTL exist, local eQTL typically have stronger effects (Petrettoet al.2006a; Mackayet al.2009; Van Naset al.2010). A targeted search for local eQTL where we tested only the marker situated closest to a given gene revealed local eQTL at 12% of the genes tested, for a total of 1161 local eQTL (Table S5).
Clusters of trans-eQTL can be indicative of networks of coregulated genes under common genetic control by a single locus (Hubneret al.2005; Heiniget al.2010; Langleyet al.
2013). We therefore explored whether the distant eQTL are enriched in certain regions of the genome. One region con-tained more distant eQTL than expected if the eQTL were distributed randomly throughout the genome. This excess was, however, small (seven eQTL per window, six or fewer expected by chance,Figure S4A). Further, the region did not overlap with any tameness QTL (Figure S4B). To directly investigate coexpression networks and their genetic regu-lation, we applied WGCNA (Langfelder and Horvath 2008). The method grouped 12,616 of the 14,000 genes in the anal-yses into 54 coexpression clusters (Table S6; Supplementary Note). For each cluster, we computed the first principal components of the expression levels of the genes in the cluster and asked how they relate to tameness. The expres-sion of five clusters was correlated with tameness across the 150 F2animals (Table S6). Further, mapping the ex-pression of the 54 clusters using FIA revealed QTL for sev-eral of the clusters, but none of these QTL overlapped with a tameness QTL.
Overlap of QTL affecting tameness and gene expression in the brain
Genes whose expression levels in the brain are influenced by local eQTL that overlap tameness QTL are candidates for contributing to the differences in behavior. Of the 689 FIA eQTL, 212 (influencing the expression of 207 genes) over-lapped with a tameness QTL (Figure 3). The genomic region spanned by Tame-1 (the most significant tameness QTL) contained more eQTL than other regions of similar size in the rest of the genome (Wilcoxon rank test,P= 0.007). This observation is a reflection of the fact thatTame-1is located in the most gene-dense region of the linkage map (Figure S9). Overall, the scores of those eQTL that overlapped a tameness QTL were not different from those that did not (Wilcoxon rank test,P-value = 0.4; Figure 3). However, theTame-1region was enriched for highly significant eQTL (Figure 3 and Figure 4). For example, 11 of the 79 eQTL (14%) with a score of at least 1000 were located inTame-1, although this locus contains only 3% of the 14,000 genes in the analyses. Thus, while many eQTL overlapped a tameness QTL, the strongest tameness QTLTame-1stands out in that it spans the region with the highest gene density in the genome (Figure S9) and also contains many strong local eQTL.
Allele effect correlations between tameness QTL and eQTL
An overlap of QTL for tameness and gene expression does not imply that the two QTL are necessarily caused by the same sequence variants. However, where there are multiple alleles at FIA QTL, a correlation between the allele effects of overlapping tameness QTL and eQTL is expected if they are driven by the same genetic variants. If the overlap is with a local eQTL, causative variation at the gene itself may underlie the tameness QTL. If the overlap is with a distant eQTL, the gene regulated intransneed not itself contain sequence var-iants that influence tameness, but its expression may be part of the biological pathways that shape this behavior.
We performed two scans for allele effect correlations. First, we conducted a targeted analysis of the FIA tameness QTL and the 212 FIA eQTL that overlap them. In this scan, the allele effects of 29 genes correlated significantly with the tameness allele effects [Benjamini Hochberg (BH) adjusted
P,0.05, Figure 5A]. Of these 29 correlations, 25 involved
Tame-1, and 3 involved distant eQTL (Table S4).
Figure 3 Genome-wide overlap of QTL
To explore if these allele effect correlations were specific to the significant tameness QTL, we conducted a second scan in which we tested all local eQTL for allele effect correlations with tameness, irrespective of the evidence for a tameness QTL at the respective position. Of 23 significant correlations, 18 (78%) occurred at tameness QTL. Thirteen of these in-volved eQTL that overlappedTame-1, and 2 additional corre-lations involved eQTL for genes situated very close toTame-1
(Figure 5B). Thus, correlations between allele effects on tameness and on gene expression mostly occur at loci with significant effects on the behavior.
Correlations between gene expression levels and tameness
Across the 150 F2animals, we found four genes whose ex-pression levels correlated significantly with tameness (corre-lation strength exceeds that seen in any of 100 permutations,
Figure S6,Table S7). Of these, the expression ofGltscr2and
Zfp40 correlated positively with tameness. Both genes had eQTL at the Tame-1 peak and showed allele effect correla-tions withTame-1 (Figure 6). The other two genes did not have a significant eQTL.
Differential expression between the tame and aggressive selection lines
We searched for differentially expressed genes between the tame and the aggressive rat lines using two datasets: a pub-lished RNA-seq dataset of frontal cortex tissue (Albertet al.
2012) and a microarray-based comparison of cerebral hemi-spheres first reported here. We found 11 genes that were differentially expressed between the tame and aggressive founder animals and also had eQTL overlapping with tameness
QTL (Table S4). Five of these genes (Dhdh, Slc17a7, Lgi4,
Gltscr2, andDll3) also showed significant allele effect correla-tions with a tameness QTL (Figure 6,Table S8).
There was one gene (Gltscr2) that satisfied all the criteria we considered for nominating candidate genes for influencing tameness. In addition, several genes satisfied two or more criteria (Figure 6,Table S8).
Discussion
We have explored the influence of genetic variation on brain gene expression levels in a cross between two outbred lines of rats that had been selected from a common base popula-tion for strong tame and aggressive behavior toward humans. We further examined how this regulatory gene-expression variation relates to genetic influences on tameness and ag-gression and used the expression data to prioritize genes that may play a causal role in these behaviors.
We used two QTL mapping approaches that differ in their assumptions about the genetic homogeneity of the founder lines. The HKR assumesfixation for alternative causal alleles in the divergent founders. Using this method, we identified two tameness QTL (Albert et al. 2009) and hundreds of eQTL. Because the two selection lines are outbred and dis-play considerable within-line genetic variation (Albertet al.
2011), we also used a QTL mapping method that does not require causative alleles to be fixed between the tame and aggressive founders (Rönnegårdet al.2008). Using this method, many additional tameness QTL and eQTL were detected. These results indicate that the genetic architecture of behavior in this cross is complex and influenced by multiple QTL, a ma-jority of which have alleles that still are segregating in the founders. Further, there are profound differences in the brain transcriptome that are under genetic control.
Rodent behavioral QTL studies typically identify multiple QTL with small effect sizes of,10% of the phenotypic vari-ance of the trait (Flint 2003; Willis-Owen and Flint 2006). For example, a QTL study in heterogenous stock mice derived from eight progenitor strains identified 205 loci contributing to anxiety (Goodsonet al.2012). As a QTL needs to exceed a certain effect size to be detectable, the number of tameness QTL we have identified is an underestimate of the number of loci contributing to the phenotypic differences between the lines. Based on work on complex traits in other species, we might expect many more loci with effects too small to be detected in our current sample to influence a complex behav-ioral trait like tameness (e.g., Yang et al.2010; Huntet al.
2013). Further, selection experiments in multiple species (Drosophila (Burkeet al. 2010), maize (Laurieet al. 2004), and chickens (Johanssonet al.2010; Petterssonet al.2013) demonstrated that many loci typically respond to strong se-lection, as expected when trait variation is due to variants at many genes. It thus seems plausible that many genetic var-iants with small effects contribute to differences in several biological pathways that together shape complex behavioral traits such as tameness and defensive aggression. Epistatic
Figure 4 Enrichment of highly significant eQTL at theTame-1locus. The
interactions, where the effect of one locus depends on the genotype of another locus (Phillips 2008) may also play a role, especially given that we have earlier detected epistatic inter-actions between tameness QTL (Albertet al.2009). The large number of genes and pathways described in the literature influencing behavioral traits related to tameness such as anx-iety and aggression makes it plausible that genes in multiple biological pathways could have reacted to the strong selection in these rats (Hovatta and Barlow 2008; Le-Niculescu et al.
2011).
A major goal of our analyses was to compare genetic
in-fluences on brain gene expression to those on tameness and aggression. Genetic influences on brain gene expression are plausible contributors to behavioral phenotypes. We found numerous eQTL that overlapped the eight tameness QTL
(Table S4). In particular, the strongest tameness QTL (Tame-1)
contained multiple highly significant eQTL with allele effects that were correlated with those on tameness. This result in-dicates that Tame-1 might harbor several genes influencing behavior through altered gene expression in the brain. QTL identified in F2 crosses frequently fractionate into loci of more minor effects during fine mapping (Demarest et al.
2001; Mozhui et al.2008) and contain multiple causative variants (Baudet al.2013; Flisteret al.2013). An advanced intercross using large numbers of rats to generate more re-combination events will be necessary to investigate whether variation at more than one gene underlies Tame-1(Darvasi and Soller 1995).
We utilized the ability of FIA to infer the effects of multiple alleles at both tameness QTL and eQTL to prioritize poten-tially causative genes among genes with eQTL that overlap a tameness locus. The rationale is that if multiple haplotypes of a gene at an overlapping QTL/eQTL locus influence both tameness and the expression of a gene, the relative strengths
of their allele effects on tameness and expression should be correlated. In contrast, if the QTL/eQTL locus is due to dif-ferent variants affecting tameness and gene expression in the brain, it is less likely that their effects are correlated. Thus, identification of pairs of eQTL and tameness QTL with segre-gating alleles and correlated genetic effects allows us to select more likely causal genes (Nicaet al.2010). For example, of 43 eQTL that overlapTame-1, only 10 had significant allele effect correlations in both our scans, implying these 23% of the genes as more likely to be causal. This type of prioritiza-tion would not have been possible in a cross between two inbred lines.
In addition to correlation of allele effects on behavior and gene expression, we considered differential brain gene ex-pression between the tame and aggressive rat lines and cor-relation of gene expression traits with tameness across F2 animals to identify the most plausible candidate causal genes. The genes highlighted by these analyses (Figure 6) include
Lgi4,Gltscr2,Zfp40, andSlc17a7, all of which are located in
Tame-1 and had significant eQTL allele effect correlations with this tameness QTL. With the exception ofSlc17a7, none of these genes have to date been implicated in the regulation of a behavioral trait.
Lgi4is involved in glial cell proliferation and axon myelination in the peripheral nervous system (Kegel et al.2013). There is also evidence for a biological role in the central nervous system: polymorphisms inLgi4 have been associated with central epi-lepsy conditions (Guet al. 2004; Ishiiet al. 2010). We found
Lgi4to be differentially expressed between the tame and aggres-sive selection lines. Alleles from the tame line decreased Lgi4
expression both in the contrast between the selected lines and in the F2population.
Gltscr2encodes a regulator of the tumor suppressor genes
p53 (Golomb and Oren 2011) andPTEN (Yimet al.2007)
Figure 5 Correlations between allele effects of
that shows lower expression in several tumors including gliomas (Kim et al.2008). It was also described to have functions in embryogenesis and embryonic stem cell survival (Sasaki et al.
2011). Alleles from the tame line increasedGltscr2expression both when comparing the two selection lines and in the F2 population. In addition,Gltscr2expression was positively cor-related with tameness across the F2animals.
Zfp40(Zincfinger protein 40) is a little-studied gene that it is expressed in murine embryonic nervous system develop-ment (Noceet al.1993). In the F2animals, alleles from the tame line increased Zfp40 expression and the expression of
Zfp40was significantly and positively correlated with tameness.
Slc17a7belongs to a family of vesicular glutamate trans-porter genes and has been previously implicated in the reg-ulation of behavior. Mice that carry a hemizygous knockout such that they express only half the amount ofSlc17a7 com-pared to wild-type mice, are more anxious (Tordera et al.
2007) and more vulnerable to chronic mild stress (Garcia-Garciaet al.2009; Farleyet al.2012). Here, the expression ofSlc17a7in brain hemispheres in rats from the tame selec-tion line was twice that in the aggressive rats. However, the eQTL acted in the opposite direction: alleles from the ag-gressive founder animals increase Slc17a7expression. Further,
Slc17a7expression does not correlate with tameness in the F2 animals, andSlc17a7is located at some distance (13 cM) from the peak ofTame-1. Thus, although it is a promising candidate gene, precisely howSlc17a7may contribute to tameness and aggression remains unclear.
We found several genes that were not themselves located in tameness QTL, but whose expression was influenced by distant eQTL that did overlap tameness QTL. Trans-acting variants in the tameness QTL might lead to differential ex-pression of these genes, which in turn might shape the phys-iological pathways that regulate tame or aggressive behavior.
An example of such a gene isCyp7b1, whose expression is influenced by an eQTL that overlaps a tameness QTL on chromosome six.Cyp7b1encodes a 25-hydroxycholesterol 7-alpha-hydroxylase that is involved in DHEA metabolism (Yauet al.2003). Interestingly, a key enzyme involved in the metabolism of this neurosteroid is located in afixed duplica-tion in 20 tame founder rats in Tame-1(A. Cagan, personal communication). It is interesting that genetic variation in two independent tameness QTL is connected to the DHEA system, making this system an interesting candidate for further studies into the regulation of tameness and aggression.
The geneHtr3aencodes a subunit of the ionotropic serotonin receptor type 3 (5-HT3). It has earlier been shown that there are differences in serotonin level between the tame and aggressive founder lines in different brain regions (Naumenkoet al.1989; Albertet al.2008). Further, serotonin and its metabolite were higher in several brain regions in a line of foxes selected for tameness than in foxes not selected for behavior (Popova
et al.1976, 1991). The 5-HT3 receptor density is also greater in hamsters showing impulsive aggression (Cervantes and Delville 2009) andHtr3a knockout mice exhibit changes in anxiety-like behavior and hypothalamus–pituitary– adrenal (HPA) axis response to stress (Bhatnagaret al.2004). In this study,Htr3ais differentially expressed between the tame and aggressive founders at a 10% FDR and weakly correlated (but not robust to multiple testing) with tameness in the F2. Also, the expression of the geneHtr3ais influenced by two distant eQTL, one of which overlaps with the second strongest FIA tameness QTL on chromosome 18. The allele effect correlations at this tameness QTL were nominally significant (but not robust to multiple testing). Although the evidence forHtr3a
is marginal in each independent analysis, the coherency in the results indicates that it is a useful gene for further studies into the basis of tameness in this population.
Figure 6 Genes that show evidence for
influ-encing tameness and aggression. Shown are the number and names of genes that meet at least one offive criteria for involvement in tame-ness: (i) positional overlap between eQTL and tameness QTL (green oval); significant allele ef-fect correlations with tameness QTL at either (ii) eQTL peaks (blue oval) or (iii) tameness QTL peaks (red circle); (iv) differential expression in RNA-seq frontal cortex or in whole brain micro-array between the tame and aggressive popula-tions (yellow oval); (v) significant correlation with tameness in F2animals [gene names in italics,*
In summary, we identified hundreds of genomic loci that influence gene expression levels in the brains of rats that had been bred for tame and aggressive behavior toward humans. Differences in brain gene expression are an attractive avenue by which genetic differences between and within these two rat lines may contribute to the strong differences in behavior. We also found six loci with effects on tameness that had been missed by earlier work, illustrating that the genetic architecture of behavior is complex in this artificially selected population. The expression of several genes inside the strongest tameness QTL was influenced by local eQTL with very strong effects. These genes are promising candidates for functional follow-up work to study if and how they contribute to tameness and aggression.
Acknowledgments
We are grateful to Martin Kircher, Martin Kuhlwilm, Michael Dannemann, Rigo Schultz, Udo Stenzel, and other past and present members of the Max Planck Institute for Evolution-ary Anthropology for help with bioinformatic analyses. We thank Dominic Wright and one anonymous reviewer for their helpful comments on the manuscript. This work was supported by the Max Planck Society, an Sfb 1052 German research foundation (DFG) and Integrated Research and Treatment Center (IFB) AdiposityDiseases Leipzig German Federal Ministry of Education and Research (BMBF) to T.S., a DFG research fellowship AL 1525/1-1 to F.W.A., a Studienstiftung des deutschen Volkes stipend to H.O.H., and MD1 and MD2 (IFB AdiposityDiseases Leipzig) stipends to H.O.H.
Literature Cited
Albert, F. W., O. Shchepina, C. Winter, H. Römpler, D. Teupseret al., 2008 Phenotypic differences in behavior, physiology and neuro-chemistry between rats selected for tameness and for defensive aggression towards humans. Horm. Behav. 53: 413–421. Albert, F. W., O. Carlborg, I. Plyusnina, F. Besnier, D. Hedwiget al.,
2009 Genetic architecture of tameness in a rat model of animal domestication. Genetics 182: 541–554.
Albert, F. W., E. Hodges, J. D. Jensen, F. Besnier, Z. Xuan et al., 2011 Targeted resequencing of a genomic region influencing tameness and aggression reveals multiple signals of positive selection. Heredity 107: 205–214.
Albert, F. W., M. Somel, M. Carneiro, A. Aximu-Petri, M. Halbwax et al., 2012 A comparison of brain gene expression levels in domesticated and wild animals. PLoS Genet. 8: e1002962. Baud, A., R. Hermsen, V. Guryev, P. Stridh, D. Graham et al.,
2013 Combined sequence-based and genetic mapping analysis of complex traits in outbred rats. Nat. Genet. 45: 767–775. Belyaev, D. K., 1979 The Wilhelmine E. Key 1978 invitational
lecture. Destabilizing selection as a factor in domestication. J. Hered. 70: 301–308.
Bendesky, A., J. Pitts, M. V. Rockman, W. C. Chen, M. W. Tanet al., 2012 Long-range regulatory polymorphisms affecting a GABA receptor constitute a quantitative trait locus (QTL) for social behavior in Caenorhabditis elegans. PLoS Genet. 8: e1003157.
Benjamini, Y., and D. Yekutieli, 2005 Quantitative trait Loci analysis using the false discovery rate. Genetics 171: 783–790.
Besnier, F., and O. Carlborg, 2007 A general and efficient method for estimating continuous IBD functions for use in genome scans for QTL. BMC Bioinformatics 8: 440.
Besnier, F., and O. Carlborg, 2009 A genetic algorithm based method for stringent haplotyping of family data. BMC Genet. 10: 57. Bhatnagar, S., L. M. Sun, J. Raber, S. Maren, D. Julius et al., 2004 Changes in anxiety-related behaviors and hypothalamic-pituitary-adrenal activity in mice lacking the 5-HT-3A receptor. Physiol. Behav. 81: 545–555.
Bolstad, B. M., R. A. Irizarry, M. Astrand, and T. P. Speed, 2003 A comparison of normalization methods for high density oligonucleotide array data based on variance and bias. Bioinformatics 19: 185– 193.
Broman, K. W., and S. Saunak, 2009 A Guide to QTL Mapping with R/qtl, Springer-Verlag, Berlin.
Broman, K. W., H. Wu, S. Sen, and G. A. Churchill, 2003 R/qtl: QTL mapping in experimental crosses. Bioinformatics 19: 889–890. Burke, M. K., J. P. Dunham, P. Shahrestani, K. R. Thornton, M. R. Roseet al., 2010 Genome-wide analysis of a long-term evolu-tion experiment with Drosophila. Nature 467: 587–590. Calboli, F. C., F. Tozzi, N. W. Galwey, A. Antoniades, V. Mooser
et al., 2010 A genome-wide association study of neuroticism in a population-based sample. PLoS ONE 5: e11504.
Cervantes, M. C., and Y. Delville, 2009 Serotonin 5–HT1A and 5– HT3 receptors in an impulsive-aggressive phenotype. Behav. Neurosci. 123: 589–598.
Dai, M., P. Wang, A. D. Boyd, G. Kostov, B. Atheyet al., 2005 Evolving gene/transcript definitions significantly alter the interpretation of GeneChip data. Nucleic Acids Res. 33: e175.
Darvasi, A., and M. Soller, 1995 Advanced intercross lines, an experimental population for fine genetic mapping. Genetics 141: 1199–1207.
de Jong, S., M. J. H. Kas, J. Kiernan, A. G. de Mooij-van Malsen, H. Oppelaar et al., 2011 Hippocampal gene expression analysis highlights Ly6a/Sca-1 as candidate gene for previously mapped novelty induced behaviors in mice. PLoS ONE 6: e20716. Deary, I. J., W. Johnson, and L. M. Houlihan, 2009 Genetic
foun-dations of human intelligence. Hum. Genet. 126: 215–232. Demarest, K., J. Koyner, J. McCaughran, Jr., L. Cipp, and R. Hitzemann,
2001 Further characterization and high-resolution mapping of quantitative trait loci for ethanol-induced locomotor activity. Behav. Genet. 31: 79–91.
Diamond, J., 1999 Guns, Germs, and Steel: The Fates of Human Societies, Chatto & Windus, London.
Farley, S., S. Dumas, S. El Mestikawy, and B. Giros, 2012 Increased expression of the Vesicular Glutamate Transporter-1 (VGLUT1) in the prefrontal cortex correlates with differential vulnerability to chronic stress in various mouse strains: effects offluoxetine and MK-801. Neuropharmacology 62: 503–517.
Flint, J., 2003 Analysis of quantitative trait loci that influence animal behavior. J. Neurobiol. 54: 46–77.
Flint, J., and M. R. Munafo, 2013 Candidate and non-candidate genes in behavior genetics. Curr. Opin. Neurobiol. 23: 57–61. Flister, M. J., S. W. Tsaih, C. C. O’Meara, B. Endres, M. J. Hoffman
et al., 2013 Identifying multiple causative genes at a single GWAS locus. Genome Res. 23: 1996–2002.
Garcia-Garcia, A. L., N. Elizalde, D. Matrov, J. Harro, S. M. Wojciket al., 2009 Increased vulnerability to depressive-like behavior of mice with decreased expression of VGLUT1. Biol. Psychiatry 66: 275–282. Golomb, L., and M. Oren, 2011 DePICTing p53 activation: a new
nucleolar link to cancer. Cancer Cell 20: 283–284.
Gu, W., T. Sander, T. Becker, and O. K. Steinlein, 2004 Genotypic association of exonic LGI4 polymorphisms and childhood ab-sence epilepsy. Neurogenetics 5: 41–44.
Haley, C. S., and S. A. Knott, 1992 A simple regression method for mapping quantitative trait loci in line crosses using flanking markers. Heredity 69: 315–324.
Heinig, M., E. Petretto, C. Wallace, L. Bottolo, M. Rotival et al., 2010 A trans-acting locus regulates an anti-viral expression network and type 1 diabetes risk. Nature 467: 460–464. Hitzemann, R., C. Reed, B. Malmanger, M. Lawler, B. Hitzemann
et al., 2004 On the integration of alcohol-related quantitative trait loci and gene expression analyses. Alcohol. Clin. Exp. Res. 28: 1437–1448.
Hovatta, I., and C. Barlow, 2008 Molecular genetics of anxiety in mice and men. Ann. Med. 40: 92–109.
Huang, D. W., B. T. Sherman, and R. A. Lempicki, 2008 Systematic and integrative analysis of large gene lists using DAVID bioinfor-matics resources. Nat. Protoc. 4: 44–57.
Hubner, N., C. A. Wallace, H. Zimdahl, E. Petretto, H. Schulzet al., 2005 Integrated transcriptional profiling and linkage analysis for identification of genes underlying disease. Nat. Genet. 37: 243–253.
Hunt, K. A., V. Mistry, N. A. Bockett, T. Ahmad, M. Ban et al., 2013 Negligible impact of rare autoimmune-locus coding-region variants on missing heritability. Nature 498: 232–235.
Irizarry, R. A., B. Hobbs, F. Collin, Y. D. Beazer-Barclay, K. J. Antonellis et al., 2003 Exploration, normalization, and summaries of high density oligonucleotide array probe level data. Biostatistics 4: 249–264.
Ishii, A., B. Zhang, S. Kaneko, and S. Hirose, 2010 Positive asso-ciation between benign familial infantile convulsions and LGI4. Brain Dev. 32: 538–543.
Johansson, A. M., M. E. Pettersson, P. B. Siegel, and O. Carlborg, 2010 Genome-wide effects of long-term divergent selection. PLoS Genet. 6: e1001188.
Kegel, L., E. Aunin, D. N. Meijer, and J. R. Bermingham, Jr..,
2013 LGI proteins in the nervous system. ASN Neuro 5:
167–181.
Kelly, S. A., D. L. Nehrenberg, K. Hua, T. Garland, Jr., and D. Pomp, 2012 Functional genomic architecture of predisposition to vol-untary exercise in mice: expression QTL in the brain. Genetics 191: 643–654.
Kim, Y. J., Y. E. Cho, Y. W. Kim, J. Y. Kim, S. Leeet al., 2008 Sup-pression of putative tumour suppressor gene GLTSCR2 expres-sion in human glioblastomas. J. Pathol. 216: 218–224. Kircher, M., U. Stenzel, and J. Kelso, 2009 Improved base calling
for the Illumina Genome Analyzer using machine learning strat-egies. Genome Biol. 10: R83.
Kuhlwilm, M., A. Davierwala, and S. Paabo, 2013 Identification of putative target genes of the transcription factor RUNX2. PLoS ONE 8: e83218.
Langfelder, P., and S. Horvath, 2008 WGCNA: an R package for weighted correlation network analysis. BMC Bioinformatics 9: 559.
Langley, S. R., L. Bottolo, J. Kunes, J. Zicha, V. Zidek et al., 2013 Systems-level approaches reveal conservation of trans-regulated genes in the rat and genetic determinants of blood pressure in humans. Cardiovasc. Res. 97: 653–665.
Laurie, C. C., S. D. Chasalow, J. R. LeDeaux, R. McCarroll, D. Bush et al., 2004 The genetic architecture of response to long-term artificial selection for oil concentration in the maize kernel. Genetics 168: 2141–2155.
Le-Niculescu, H., Y. Balaraman, S. D. Patel, M. Ayalew, J. Gupta et al., 2011 Convergent functional genomics of anxiety disor-ders: translational identification of genes, biomarkers, pathways and mechanisms. Transl. Psychiatry 1: e9.
Leek, J. T., and J. D. Storey, 2007 Capturing heterogeneity in gene expression studies by surrogate variable analysis. PLoS Genet. 3: 1724–1735.
Leek, J. T., R. B. Scharpf, H. C. Bravo, D. Simcha, B. Langmead et al., 2010 Tackling the widespread and critical impact of batch effects in high-throughput data. Nat. Rev. Genet. 11: 733–739.
Leek, J. T., W. E. Johnson, H. S. Parker, A. E. Jaffe, and J. D. Storey, 2012 The sva package for removing batch effects and other unwanted variation in high-throughput experiments. Bioinformatics 28: 882–883.
Lynch, M., and B. Walsh, 1998 Genetics and Analysis of Quantitative Traits, Sinauer Associates, Sunderland, MA.
Mackay, T. F. C., E. A. Stone, and J. F. Ayroles, 2009 The genetics of quantitative traits: challenges and prospects. Nat. Rev. Genet. 10: 565–577.
Manichaikul, A., J. Dupuis, S. Sen, and K. W. Broman, 2006 Poor performance of bootstrap confidence intervals for the location of a quantitative trait locus. Genetics 174: 481–489.
McGrath, P. T., M. V. Rockman, M. Zimmer, H. Jang, E. Z. Macosko et al., 2009 Quantitative mapping of a digenic behavioral trait implicates globin variation in C. elegans sensory behaviors. Neuron 61: 692–699.
Mehrabian, M., H. Allayee, J. Stockton, P. Y. Lum, T. A. Drakeet al., 2005 Integrating genotypic and expression data in a segregat-ing mouse population to identify 5-lipoxygenase as a susceptibility gene for obesity and bone traits. Nat. Genet. 37: 1224–1233. Moffatt, M. F., M. Kabesch, L. Liang, A. L. Dixon, D. Strachanet al.,
2007 Genetic variants regulating ORMDL3 expression contribute to the risk of childhood asthma. Nature 448: 470–473.
Mozhui, K., D. C. Ciobanu, T. Schikorski, X. Wang, L. Lu et al., 2008 Dissection of a QTL hotspot on mouse distal chromosome 1 that modulates neurobehavioral phenotypes and gene expres-sion. PLoS Genet. 4: e1000260.
Musunuru, K., A. Strong, M. Frank-Kamenetsky, N. E. Lee, T. Ahfeldt et al., 2010 From noncoding variant to phenotype via SORT1 at the 1p13 cholesterol locus. Nature 466: 714–719.
Naumenko, E. V., N. K. Popova, E. M. Nikulina, N. N. Dygalo, G. T. Shishkina et al., 1989 Behavior, adrenocortical activity, and brain monoamines in Norway rats selected for reduced aggres-siveness towards man. Pharmacol. Biochem. Behav. 33: 85–91. Nelson, R. M., X. Shen, and O. Carlborg, 2011 qtl.outbred: inter-facing outbred line cross data with the R/qtl mapping software. BMC Res. Notes 4: 154.
Nica, A. C., S. B. Montgomery, A. S. Dimas, B. E. Stranger, C. Beazley et al., 2010 Candidate causal regulatory effects by integration of expression QTLs with complex trait genetic associations. PLoS Genet. 6: e1000895.
Noce, T., Y. Fujiwara, M. Ito, T. Takeuchi, N. Hashimoto et al.,
1993 A novel murine zinc finger gene mapped within the
tw18 deletion region expresses in germ cells and embryonic nervous system. Dev. Biol. 155: 409–422.
Otowa, T., E. Yoshida, N. Sugaya, S. Yasuda, Y. Nishimuraet al., 2009 Genome-wide association study of panic disorder in the Japanese population. J. Hum. Genet. 54: 122–126.
Perlstein, E. O., D. M. Ruderfer, D. C. Roberts, S. L. Schreiber, and L. Kruglyak, 2007 Genetic basis of individual differences in the response to small-molecule drugs in yeast. Nat. Genet. 39: 496–502. Petretto, E., J. Mangion, N. J. Dickens, S. A. Cook, M. K. Kumaran et al., 2006a Heritability and tissue specificity of expression quantitative trait loci. PLoS Genet. 2: e172.
Petretto, E., J. Mangion, M. Pravanec, N. Hubner, and T. J. Aitman, 2006b Integrated gene expression profiling and linkage analysis in the rat. Mamm. Genome 17: 480–489.
Phillips, P. C., 2008 Epistasis: the essential role of gene interac-tions in the structure and evolution of genetic systems. Nat. Rev. Genet. 9: 855–867.
Plyusnina, I., and I. Oskina, 1997 Behavioral and adrenocortical responses to open-field test in rats selected for reduced aggres-siveness toward humans. Physiol. Behav. 61: 381–385. Plyusnina, I. Z., I. N. Oskina, M. A. Tibeikina, and N. K. Popova,
2009 Cross-fostering effects on weight, exploratory activity, acoustic startle reflex and corticosterone stress response in Norway gray rats selected for elimination and for enhancement of aggressiveness towards human. Behav. Genet. 39: 202–212. Pong-Wong, R., A. W. George, J. A. Woolliams, and C. S. Haley,
2001 A simple and rapid method for calculating identity-by-descent matrices using multiple markers. Genet. Sel. Evol. 33: 453–471. Popova, N. K., N. N. Voitenko, and L. N. Trut, 1976 Changes in
the content of serotonin and 5-hydroxyindoleacetic acid in the brain in the selection of silver foxes according to behavior. Neurosci. Behav. Physiol. 7: 72–74.
Popova, N. K., N. N. Voitenko, A. V. Kulikov, and D. F. Avgustino-vich, 1991 Evidence for the involvement of central serotonin in mechanism of domestication of silver foxes. Pharmacol. Biochem. Behav. 40: 751–756.
R Development Core Team, 2012 R: a Language and Environment
for Statistical Computing. R Foundation for Statistical Comput-ing, Vienna.
Rietveld, C. A., S. E. Medland, J. Derringer, J. Yang, T. Eskoet al., 2013 GWAS of 126,559 individuals identifies genetic variants associated with educational attainment. Science 340: 1467–1471. Roberts, A., C. Trapnell, J. Donaghey, J. L. Rinn, and L. Pachter, 2011 Improving RNA-Seq expression estimates by correcting for fragment bias. Genome Biol. 12: R22.
Roider, H. G., T. Manke, S. O’Keeffe, M. Vingron, and S. A. Haas, 2009 PASTAA: identifying transcription factors associated with sets of co-regulated genes. Bioinformatics 25: 435–442. Rönnegård, L., F. Besnier, and O. Carlborg, 2008 An improved
method for quantitative trait loci detection and identification of within-line segregation in F2 intercross designs. Genetics 178: 2315–2326.
Saba, L. M., B. Bennett, P. L. Hoffman, K. Barcomb, T. Ishiiet al., 2011 A systems genetic analysis of alcohol drinking by mice, rats and men: influence of brain GABAergic transmission. Neu-ropharmacology 60: 1269–1280.
Sasaki, M., K. Kawahara, M. Nishio, K. Mimori, R. Kogo et al.,
2011 Regulation of the MDM2–P53 pathway and tumor
growth by PICT1 via nucleolar RPL11. Nat. Med. 17: 944–951. Schadt, E. E., J. Lamb, X. Yang, J. Zhu, S. Edwardset al., 2005 An integrative genomics approach to infer causal associations be-tween gene expression and disease. Nat. Genet. 37: 710–717. Schroeder, A., O. Mueller, S. Stocker, R. Salowsky, M. Leiberet al.,
2006 The RIN: an RNA integrity number for assigning integrity values to RNA measurements. BMC Mol. Biol. 7: 3.
Sokolowska, E., and I. Hovatta, 2013 Anxiety genetics:findings from cross-species genome-wide approaches. Biol Mood Anxiety Disord 3: 9.
Terracciano, A., S. Sanna, M. Uda, B. Deiana, G. Usala et al., 2010 Genome-wide association scan forfive major dimensions of personality. Mol. Psychiatry 15: 647–656.
Tordera, R. M., S. Totterdell, S. M. Wojcik, N. Brose, N. Elizalde et al., 2007 Enhanced anxiety, depressive-like behaviour and impaired recognition memory in mice with reduced expression of the vesicular glutamate transporter 1 (VGLUT1). Eur. J. Neu-rosci. 25: 281–290.
Trapnell, C., L. Pachter, and S. L. Salzberg, 2009 TopHat: discovering splice junctions with RNA-Seq. Bioinformatics 25: 1105–1111. Trapnell, C., B. A. Williams, G. Pertea, A. Mortazavi, G. Kwanet al.,
2010 Transcript assembly and quantification by RNA-Seq re-veals unannotated transcripts and isoform switching during cell differentiation. Nat. Biotechnol. 28: 511–515.
Trut, L. N., 1999 Early Canid domestication: the farm-fox exper-iment. Am. Sci. 87: 160–169.
van Nas, A., L. Ingram-Drake, J. S. Sinsheimer, S. S. Wang, E. E. Schadtet al., 2010 Expression quantitative trait loci: replication, tissue- and sex-specificity in mice. Genetics 185: 1059–1068. Watanabe, A., T. Toyota, Y. Owada, T. Hayashi, Y. Iwayamaet al.,
2007 Fabp7 maps to a quantitative trait locus for a schizophrenia endophenotype. PLoS Biol. 5: e297.
Wiener, P., and S. Wilkinson, 2011 Deciphering the genetic basis of animal domestication. Proc. Biol. Sci. 278: 3161–3170. Willis-Owen, S. A. G., and J. Flint, 2006 The genetic basis of
emotional behaviour in mice. Eur. J. Hum. Genet. 14: 721–728. Wright, D., R. K. Butlin, and O. Carlborg, 2006 Epistatic regula-tion of behavioural and morphological traits in the zebrafish (Danio rerio). Behav. Genet. 36: 914–922.
Yalcin, B., S. A. Willis-Owen, J. Fullerton, A. Meesaq, R. M. Deacon et al., 2004 Genetic dissection of a behavioral quantitative trait locus shows that Rgs2 modulates anxiety in mice. Nat. Genet. 36: 1197–1202.
Yang, J., B. Benyamin, B. P. McEvoy, S. Gordon, A. K. Henderset al., 2010 Common SNPs explain a large proportion of the herita-bility for human height. Nat. Genet. 42: 565–569.
Yau, J. L. W., S. Rasmuson, R. Andrew, M. Graham, J. Nobleet al.,
2003 Dehydroepiandrosterone 7-hydroxylase CYP7B:
predom-inant expression in primate hippocampus and reduced expres-sion in Alzheimer’s disease. Neuroscience 121: 307–314. Yim, J. H., Y. J. Kim, J. H. Ko, Y. E. Cho, S. M. Kimet al., 2007 The
putative tumor suppressor gene GLTSCR2 induces PTEN-modulated cell death. Cell Death Differ. 14: 1872–1879.
GENETICS
Supporting Information
http://www.genetics.org/lookup/suppl/doi:10.1534/genetics.114.168948/-/DC1
Genetic In
fl
uences on Brain Gene Expression in Rats
Selected for Tameness and Aggression
Henrike O. Heyne, Susann Lautenschläger, Ronald Nelson, François Besnier, Maxime Rotival, Alexander Cagan, Rimma Kozhemyakina, Irina Z. Plyusnina, Lyudmila Trut, Örjan Carlborg, Enrico Petretto, Leonid Kruglyak, Svante Pääbo, Torsten Schöneberg, and Frank W. Albert
Figure S1. Expected and observed eQTL as a function of sequencing depth. These down‐sampling analyses were used to
evaluate the power of the study. As a proxy of sequencing depth we used the number of Illumina sequencing runs. Each Illumina
Figure S2. Power to detect eQTL as a function of gene expression level. Genes were grouped into 24 bins of 1,000 genes
sorted by expression level. We performed eQTL mapping and permutations within each abundance bin, and plotted the
resulting FDR as a function of the mean expression level within the given bin. For clarity, the four bins with the lowest
abundance are not shown. The dashed horizontal line indicates the threshold of an FDR of 5%. We used the result shown in
Figure S3. Defining FIA eQTL confidence intervals based on eQTL also detected by HKR. A, LOD scores of HKR eQTL and their
1.8 LOD drop confidence intervals. B, For the same set of eQTL as in A, shown are the FIA scores vs. the HKR 1.8 LOD drop
confidence interval. The fitted function is shown as a red line. C, Interpolated confidence intervals for all FIA eQTL versus FIA
scores. The confidence interval cut‐off at 10 cM is shown as the dashed horizontal line.
D
Figure S4 Comparing inferred FIA eQTL confidence intervals to bootstrap results. Shown are the 95% respective confidence
intervals for 29 randomly chosen FIA eQTL. The FIA score profiles are shown as grey lines. X‐axes show genomic locations in cM.
Y‐axes show FIA significance scores. The peak location of each of 200 bootstraps are shown as transparent green dots. Bootstrap
derived 95% confidence intervals are shown as blue vertical lines and confidence intervals derived via HKR are shown as red