RESEARCH ARTICLE
OPEN ACCESS
Assessment of Efficiency of Part & Geometry
Models for Groupwise Registration
Steve A. Adeshina,
1∗and Timothy F. Cootes
2∗1Department of Electrical & Electronics Engineering,Nile University of Nigeria, Abuja,
E-mail: [email protected]
2Center for Imaging Sciences, The University of Manchester, U.K
Abstract—We evaluate the performance of a system which addresses the problem of building detailed models of shape and appearance of complex structures, given only a training set of representative images and some minimal manual intervention. We focus on objects with repeating structures (such as bones in the hands), which can cause normal deformable registration techniques to fall into local minima and fail. Using a sparse annotation of a single image we can construct a parts+geometry (P+G) model capable of locating a small set of features on every training image. Iterative refinement leads to a model which can locate structures accurately and reliably. The resulting sparse annotations are sufficient to initialise a dense groupwise registration algorithm, which gives a detailed correspondence between all images in the set. We demonstrate the method on a much larger set of radiographs of the hand while comparing results with that of the earlier work, we achieved a sub-millimeter accuracy in a prominent group.
Index Terms—Bone Age assessment, Statistical Appearance Models, Groupwise Registration, Parts + Geometry Models (P+G).
F
1
I
NTRODUCTIONMany forms of model can be constructed if we have accurate correspondences defined across a set of training images. However, obtaining such correspondences can be difficult and time con-suming. In most early work on statistical shape models, for instance [4], the correspondences were created manually. More recently there has been considerable research into automated methods of achieving correspondence, such as from boundaries in 2D or surfaces in 3D (eg [6]), or more generally by directly registering images using non-rigid registration methods or ‘groupwise’ techniques [3].
In our earlier paper we tackled the prob-lem of registering images of objects with con-siderable shape variation and multiple similar sub-parts. The key problem with such data is
Manuscript received November 24, 2017; revised Decemebr 1, 2017.
one of initialisation. A common approach to groupwise registration is to first find an affine transformation which gives an approximate so-lution, then perform non-rigid registration to an evolving mean to obtain more exact results [3]. Unfortunately, with the degree of variabil-ity exhibited in the hands, the affine stage is insufficient.
We use a parts+geometry model [9]. The local geometry can be used to efficiently select between multiple candidates for the parts. Don-ner et al. demonstrated how a sophisticated parts + geometry model can accurately locate points in such images and how such a model can be constructed automatically from a set of images in which only one is manually anno-tated [8]. However, the method was only eval-uated on a small set of 12 hand radiographs.
of images using only one manually annotated image and how this can be used to initialise a groupwise registration algorithm, leading to dense correspondences [1]. We extend our ear-lier work to deal with 536 images (as opposed to 94). The key problem is the huge variation that exist in registering radiographs of children and young adults for automatic determination of skeletal maturity. This makes the original method perform less effectively.
In the following we describe the technique in tackling the inherent variation, demonstrate its use and evaluate it by comparing the results with the initial work [1].
2
R
ELATEDW
ORKModel constructions could be easy if we can es-tablish accurate correspondences across a set of training images. Unfortunately, obtaining such correspondences can be difficult and time con-suming. In most early works on statistical shape models, for instance [4], the correspondences were created manually. More recently there has been considerable research into automated methods of achieving correspondence, such as from boundaries (eg [5]) in 2D or surfaces in 3D (eg [6]), or more generally by directly registering images using non-rigid registration methods [11] or ‘groupwise’ techniques [2], [3], [14], [15].
The natural approach is thus to use a Parts+Geometry model [13], [9], [10]. The lo-cal geometry can be used to efficiently select between multiple candidates for the parts. For instance, Donner et al. [7] demonstrated how a sophisticated parts + geometry model can ac-curately locate points in such images. In further work [8], they showed that such a model can be constructed automatically from a set of images in which only one is manually annotated. How-ever, the method was only evaluated on a small set of 12 hand radiographs. In related work, Langs et al. [12] describe a method of con-structing sparse shape models from unlabeled images, by finding multiple interest points and using an MDL approach to determine optimal correspondences.
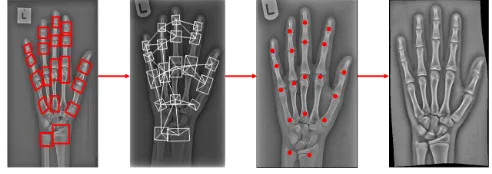
We show how a simple parts + geometry model can be learned from a large set of images using only one manually annotated image. We construct an initial model from the single image and use it to search the rest of the set. The best results are then used to update the model in an iterative scheme. The result is a trained model, together with a sparse set of correspondences across the set. These correspondences can then be used to initialise a group based registration algorithm, leading to dense correspondences. Figure 1 shows the process diagram for the steps described above.
Fig. 1. P+G models and groupwise registration process diagram
3
M
ETHODS3.1 Data Set
We have access to a database of radiographs of the non-dominant hand of normally developing children. The children were enrolled on a bone ageing study at the University of Manchester. Their ages ranged between 5 years and 20 years. In the following work we used a subset of 170 (87 male and 83 female) digitized radio-graphs of normal children.
3.2 Multi-Resolution Patch Models
Given one or more training images in which a particular region has been annotated, we can construct a statistical model of the region. We assume that the region is of fixed shape, but may vary in size and orientation. In the sim-plest case the region is an oriented rectangle or ellipse, centred on a point, p with scale s and orientationθ.
If g(t) are the intensities sampled from
and unit variance, then the quality of fit to a model is evaluated as
fi(g(t)) = n
X
j=1
|gj −g¯ij|/σij (1)
where¯giis the vector of mean intensities for the
region andσij is an estimate of the mean
abso-lute difference from the mean across a training set.1
We can then search new images with such a model, by performing an exhaustive search at a range of positions, orientations and scales to locate local minima offi(g(t)). This result in
multiple responses for each patch [1].
3.3 Geometric Relationships
To disambiguate the multiple responses of a single patch model, we create a model con-taining a set of N patch models, together with a model of the pairwise relationships between them. This is a widely used and effective tech-nique [9].
Given multiple possible candidates for each part position (from the patch detectors), we used a graph algorithms to locate the opti-mal solutions. We used a variant of dynamic programming in which a network is created where each node can be thought of as having at most two parents. Details of this method are discussed in [1].
Each candidate response for part i has a pose with parameters ti = {pi, si, θi}. The
re-lationship between part i and part j can be represented in the cost function,fij(ti,tj). This
can be derived from the joint PDF of the param-eters.
In the following we take advantage of the fact that the orientation and scale of the objects are approximately equivalent in each image, and simply use a cost function based on the relative position of the points:
fij(ti,tj) = ((pj−pi)−dij)TS−ij1((pj−pi)−dij)
(2)
1. We find this form (which assumes the data has an expo-nential distribution) gives more robust results than normalised correlation, which is essentially a sum of squares measure.
where dij is the mean separation of the two
points, andSij is an estimate of the covariance
matrix.
The matching algorithm thus seeks to find the candidates which minimise the following function
F = N
X
i=1
fi(gi) +α
X
(i,j)∈Arcs
fij(pi,pj) (3)
The value of α affects the relative impor-tance of patch and geometry matches. In the following we use α = 0.1, chosen by prelimi-nary experiments on a small subset of the data. Ways of automatically choosing a good value of
αare the focus of current research.
3.4 Building the Model
We initialise a model using a set of parts de-fined by boxes placed on a single image by the user (for instance, the rectangles shown in Figure 2a). This takes about one minute to do, and allows the algorithm to take advantage of user supplied knowledge. We then automati-cally define a set of connecting arcs based on the distances between the centres of the boxes. We use a variant of Prim’s algorithm for the minimum spanning tree, where each node has two parent nodes, rather than one [1].
We then refine the model by applying it to the whole dataset, ranking the results by final fit value (per image), and building statistical models of intensity and pairwise relationship from the best 50% of the matches.
3.5 Dense Correspondence
4
E
XPERIMENTSWe applied the technique described above to a set of 536 radiographs of the hands of children, taken as part of another study2. We divided the dataset into three age-groups. AgeGroup1 -63 images (5 - 7 yrs), AgeGroup2 -284 images (813 yrs) and AgeGroup3 189 images (14 -19 years) In our earlier work [1] we found the optimal number of boxes to be 19 boxes. These 19 boxes were annotated on one image (see Figures 2a). For each choice of boxes on a single image, a model of parts and geometry was constructed and used to locate equivalent points on other images. The models were then rebuilt and refined as described above. Figure 2a shows the initial 19 boxes on one of the images, together with the automatically cho-sen connectivity. Matches with the final model are shown in Figure 2b,c,d,e for the various groups and an example of failure in 2f. The found points in each of the groups were used to initialise a groupwise algorithm as described above. Qualitative results of the registration is shown in Figures 3. The crispness of the images indicate a good alignment.
a) b) c)
d) e) f)
Fig. 2. Example of model(a), search results with 19 parts for set94(b) [1], AgeGroup1(c), AgeGroup2 (d), AgeGroup3 (e) and an example of a failure (f) respectively (see the tip of the fifth finger near the label).
We evaluated the accuracy of the points lo-cation by comparing with manual annotations
2. The authors would like to thank K.Ward, R.Ashby, Z. Mughal and Prof.J.Adams for providing the images.
a) set94 b) 5-7yr
c) 8-13yr d) 14-19yr
Fig. 3. Final mean images after groupwise registration. a) set94 [1], b) AgeGroup1, c)AgeGroup2 and c) AgeGroup3.
based on an evaluation framework formulated in [1]. The mean distance errors for sparse point errors was found to be 0.70 ± 0.08mm,
1.08±0.18mm, 0.91±0.15mm, 0.75±0.09mm
for the set94 (images used in [1] ), AgeGroup1, AgeGroup2, AgeGroup3 respectively. The re-sult of AgeGroup3 14 -19, a very difficult group, is comparable to the original result obtained in [1]. Figure 4a presents the distribution of the errors and compare the various groups. For the dense correspondence accuracy, a median error of 0.94mm, 1.38mm, 1.1mm and 1.01mm for the set94, AgeGroup1, AgeGroup2, AgeGroup3 respectively. These errors are higher than in sparse point placement because the evaluation is based on the entire image region [1]. Figure 4b presents the distribution of the errors and compare the various groups. Note that in both cases errors are highest for AgeGroup1. The few number of images and very large variation may be responsible. Sometimes there is no cor-respondence amongst the bones.
5
D
ISCUSSION ANDC
ONCLUSIONSa)
b)
Fig. 4. Comparison of statistics of points errors for various groups. a) Accuracy of sparse point placement and b) Errors after groupwise registration (mm).
geometry model with an extended dataset. We achieve an accuracy of 0.75mm on the posi-tioning of the chosen parts. This is significantly better than results quoted by Donner et al.[8] (approx. 1.5mm, though on a different, smaller dataset). The found points are sufficient to ini-tialise a more detailed group-wise registration which can give dense point correspondences with approximately 1mm accuracy over the whole hand. We can conclude that these re-sults are comparable with our earlier work [1]. We have commenced more work on the Age-Group1 to achieve higher accuracy.
A
CKNOWLEDGMENTSThe authors would like to thank Prof Judith Adams for providing the Radiograph images..
Steve A. AdeshinaDr Steve A Adeshina is with the Nile Uni-versity of Nigeria, Abuja Nigera.
Timothy F. CootesProf Tim Cootes is with Centre for Imaging Sciences, The University of Manchester, Manchester, UK.
R
EFERENCES[1] S. A. Adeshina and T. F. Cootes. Constructing part-based models for groupwise registration. In Proc. IEEE International Syposium on Biomedical Imaging, 2010. [2] S. Baker, I. Matthews, and J.Schneider. Automatic
con-struction of active appearance models as an image coding problem. IEEE Trans. on Pattern Analysis and Machine Intelligence, 26(10):1380–84, 2004.
[3] T. Cootes, C. Twining, V.Petrovi´c, R.Schestowitz, and C. Taylor. Groupwise construction of appearance mod-els using piece-wise affine deformations. In 16th British Machine Vision Conference, volume 2, pages 879–888, 2005. [4] T. F. Cootes, C. J. Taylor, D. Cooper, and J. Graham. Active
shape models - their training and application. Computer Vision and Image Understanding, 61(1):38–59, Jan. 1995. [5] R. Davies, C.Twining, T. Cootes, and C. Taylor. A
min-imum description length approach to statistical shape modelling. IEEE Trans. on Medical Imaging, 21:525–537, 2002.
[6] R. Davies, C.Twining, T. Cootes, J. Waterton, and C. Taylor. 3D statistical shape models using direct optimisation of description length. In European Conference on Computer Vision, volume 3, pages 3–20. Springer, 2002.
[7] R. Donner, B. Micusik, G. Langs, and H. Bischof. Sparse MRF appearance models for fast anatomical structure localisation. In Proc. British Machine Vision Conference, volume 2, pages 1080–89, 2007.
[8] R. Donner, H. Wildenauer, H. Bischof, and G. Langs. Weakly supervised group-wise model learning based on discrete optimization. InProc. MICCAI, volume 2, pages 860–868, 2009.
[9] P. Felzenszwalb and D.P.Huttenlocher. Pictorial structures for object recognition. International Journal of Computer Vision, 61(1):55–79, 2005.
[10] R. Fergus, P. Perona, and A. Zisserman. A visual category filter for google images. In 8th European Conference on Computer Vision, volume 1, pages 242–256. Springer, 2004. [11] A. Frangi, D. Rueckert, J. Schnabel, and W. Niessen. Au-tomatic construction of multiple-object three-dimensional statistical shape models: Application to cardiac modeling.
IEEE Trans. Medical Imaging, 21:1151–66, 2002.
[12] G.Langs, R.Donner, Peloschek, and H.Bischof. Robust autonomous model learning from 2D and 3D data sets. InProc. MICCAI, volume 1, pages 968–976, 2007.
[13] M.A.Fischler and R.A.Elschlager. The representation and matching of pictorial structures. IEEE Trans. Computer, 22(1):67–92, 1973.
[14] M. Miller. Computational anatomy: shape, growth, and atrophy comparison via diffeomorphisms. NeuroImage, 23:S19–S33, 2004.
[15] S.Joshi, B.Davis, M.Jomier, and G.Gerig. Unbiased dif-feomorphic atlas construction for computational anatomy.
![Fig. 2. Example of model(a), search results with 19 parts forset94(b) [1], AgeGroup1(c), AgeGroup2 (d), AgeGroup3 (e) andan example of a failure (f) respectively (see the tip of the fifthfinger near the label).](https://thumb-us.123doks.com/thumbv2/123dok_us/8800684.1771698/4.612.365.511.45.289/example-results-agegroup-agegroup-agegroup-failure-respectively-fthnger.webp)

