1
OXYGEN REGIME IN AMARA LAKE
Ofelia Axinte1, Iulia Simona Bădescu2
1Ph.D. candidate of Technical University of Iasi, Faculty of Chemical Engineering, Department of Environmental Engineering, 71 Mangeron Boulevard, 700050, Iasi, Romania: [email protected] 2Ph.D. candidate of Technical University of Iasi, Faculty of Chemical Engineering, Department of Environmental Engineering, 71 Mangeron Boulevard, 700050, Iasi, Romania: [email protected]
Abstract
The changes in the trophic status of lentic ecosystems due to enrichment of nutrients influences the ecological succession. This transformation can be a natural process, that takes place over long periods, or one accelerated by human activity. Preventing the damage to the quality of surface water is a priority in the elaboration of basin management plans. Distribution of oxygen depends on the trophic status of the lake and, in turn, influences the trophism in the lake. This paper examines tropism of Amara Lake in the years preceding the reconstruction of the surrounding green areas (2010), imposed by the pronouncement of the area as ” Important Birds Area/ Special Protection Area ", in correlation with the regime of oxygen, one of the most important parameters which describe the tropism of aquatic ecosystems.
Key words: trophic state, dissolved oxygen, biochemical oxygen demand, Amara Lake
Introduction
The condition of the environment should be a ubiquitous topic in current issues. We knowingly ignore problems for which we don’t find solutions and are uncomfortable for any of us. It’s not enough to draw alarm signals, we must educate, and for this we need to know what is happening, to explain, to have arguments. The eutrophication of water phenomenon was, and still is a discussed issue in many situations and publications, without exhausting the subject or fully explaining or describing the phenomenon.
Eutrophication due to nutrient pollution from human activity accelerates the aging process of lakes.
Water bodies are constantly monitored in terms of indicators of eutrophication, so that measures are implemented to halt the phenomenon.
As previously stated this paper examines the tropism of Amara Lake in the years preceding the reconstitution of the surrounding green areas (2010). The buffer zone was imposed by the declaration of the lake in 2003, through CD1 No. 16, and in 2004, trough GD2 215, according to Law 462/2001 - ,,Important Birds Area/ Special Protection Area", with the main purpose of conserving the biological diversity by excluding and preventing exploitation or utilization activities of natural resources contrary to the objective of conservation .
The main legislation document governing the protection of water and therefore reducing the anthropogenic stress, is the Water Framework Directive no. 2000/60/EC.
1 County decision 2 Government's decision
IJCC
S
EC Volum
e 2, Issu
e 2
2 The fundamental objective of the Directive is to achieve good status of all water bodies in the Member States of the European Union and associated countries by 2015 by promoting an integrated way of thinking and a holistic approach to water resources management.
In Romania, as in the European Union, the placement in a trophic category is made according to the following indicators: total phosphorus, total mineral nitrogen, phytoplankton biomass, “A” chlorophyll. Based on these indicators, lake waters fall into five trophic states: ultra-oligotrophic, oligotrophic, mesotrophic, eutrophic and hypertrophic. Together with the other sets of indicators: the thermal and acidification, oxygen, salinity, specific toxic pollutants of natural origin, other relevant chemical indicators, we can establish five ecological status: very good (I), good (II), moderate (III), poor (IV), bad (V). (Article 1, alin.5.din Minister Order No. 161 of 16.02.2006).
Amara Lake
Amara Lake is located in the eastern Romanian Plains and administratively belongs to Ialomita county, located in the south – east of Romania. In the northern part of the lake lies the eponymous town, first documented in the seventeenth century. The geographical coordinates of Amara Lake (middle of the lake) are: 44º36'10" latitude north, 27°20'27" longitude east, the lake is located in an area with a continental steppe climate that has warm summers and cold winters. Altitude of the banks of Amara Lake varies between 23-44 m. Geographical influence is exhibited especially on terrestrial ecosystems, observing a predominance of photophile plants on sunny slopes and sciafile plants on shady slopes and less in lake ecosystems, except those located at the base of mountain formations that provide significant shading between different periods of the day of different areas of the lake, enough to influence the processes of photosynthesis among the photautothrophes of the lake. Amaras shores with large slopes and relatively low height do not influence the duration and degree of exposure to sunlight or wind.
The first chemical analysis of the water were made by P. Poni3 in 1887, and the systematic exploitation of sludge mud for spa tourism started in 1896 by setting up a public bath service.4
Maximum depth 4.1 m (1974). The water level had a period of decline (1956 - 1961) followed by a continuous increase (1961-1972) which led to the flooding of the beaches in 1976. Since 1977 adjustment measures have been made, that led to the drainage of the lake through a canal dug in the Ialomita valley, which led to a 1 m lowering of the level, but led to the decrease of salinity, thus losing 25,000 t of dissolved salts (1.5 million salt water) and a significant amount of biomass. Water mineralization
3Petru Poni (1841- 1925) was a chemist, physicist, educator, mineralogist and Romanian politician, pioneer
of chemical education in Romania. He was a professor at the University of Science and member of the Romanian Academy
4 Sandu Dorina, Monografia localităţii Amara, Ed. StarTipp, Slobozia, 2004
IJCC
S
EC Volum
e 2, Issu
e 2
3 decreased over time (89.4 g / l in 1887 - Petru Poni) and stabilized at around 9 g / l (1977 to present). 5
According to the degree of mineralization, Amara Lake falls into the category of brackish lakes whose salinity varies between 1 and 24g / l.
Amara Lake (Figure 1) is a o natural lake that comes from an abandoned arm of Ialomita river, has an area of 132 hectares (88% clear, free from vegetation) and a water volume of 2,640 million cubic with a catchment area is 45 km2, of which 15 km2 active surface.6
,,Important Birds Area/ Special Protection Area Amara Lake" was founded in 2003 through CD No. 16 and declared nationally in 2004 through GD 2151 in accordance with Law 462/2001 which is primarily aimed at the conservation of biological diversity by excluding and preventing the exploitation activities or natural resources contrary to the objective of conservation. The S.P.A. has a surface of 162 hectares, as state property. The northern boundary follows the contours of the lake, the north-west area is represented by Amara village and Amara complexes of spa treatment and continues to the limit of the northern bay crossed by a path in New Amara, located in northeast Lake. Eastern and south-eastern boundaries are the defensive dam on the lake at about 500 m, the south- limit follows the contours of the lake to the national road DN2C7, located in the southwestern part of the lake and the western limit is the national road DN2C.
The declaration of the lake as protected area has resulted in the establishment of restrictions on human activity represented by: sporting activity and recreation (affects 40% of the site), pasturage (20%), urbanization and human presence (50%), other impacts caused by tourism and recreation (30%). These activities. expressed in percentages units, overlap in time and space.
5Information regarding Amara therapeutical lake- DAB Archive, 1977
6 Reclamation plan of the environment - exploitation perimeter of therapeutic mud, Amara, Ialomiţa County,ANPM, 2007
7 National road
IJCC
S
EC Volum
e 2, Issu
e 2
, 2014
4 Given the importance of Amara Lake, to remedial medicine and spa (being one of only five lakes in Romania where therapeutic mud is formed) and also to the biodiversity conservation (the area was declared S.P.A. for 54 bird species), monitoring the quality of the water through a consistent and constant monitoring program is required. In Ialomita basin monitoring is done by Buzau-Ialomita Basin Administration and the Environment Agency using methods required at European level.
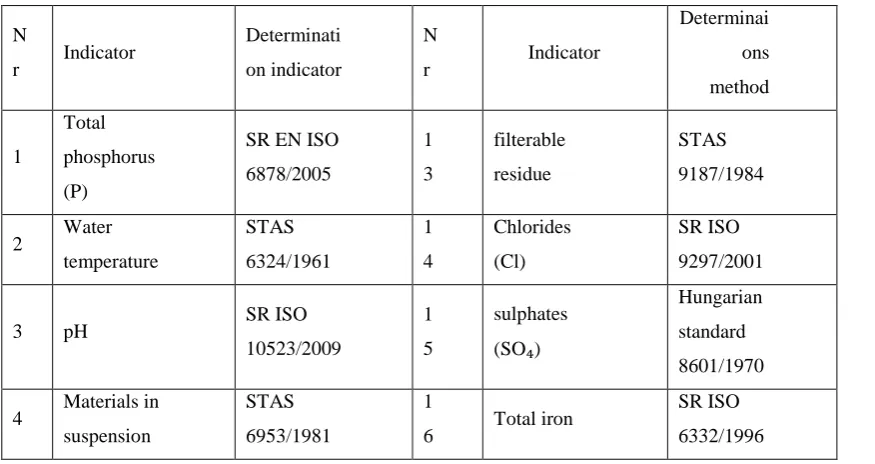
Environmental surveillance of surface water bodies, especially lakes, is done by determining the values of the following indicators: A. indicators of the degree of eutrophication, total phosphorus (mg P/l), phytoplankton density (ex/l), phytoplankton biomass (mg/l), chlorophyll ,,a" (µg/l); B. physical-chemical indicators; B1. physical indicators, temperature and acidification-harvesting depth (m), turbidity (NTU), water temperature (˚C), suspended solids (mg/l); B2. Oxygen regime - dissolved oxygen (mg O/l), BOD₅ (mg O/l), CCO-Mn (mg O/l), CCOCr (mg O/l); B3. Nutrients - ammonium (N-NH₄- mg N/l), nitrogen (N-NO₂- mg N/l), nitrat (N-NO₃- mg N/l), nitrogen Kjeldahl (N- mg N/l), total nitrogen (N- mg N/l), orthophosphate (P- PO₄- mg P/l); B4. Salinity - conductivity (µS/cm), filterable residue (mg/l), chloride (Cl- mg/l), sulphate (SO₄- mg/l), calcium (Ca- mg/l), magnesium (Mg- mg/l), sodium (Na- mg/l), alkalinity (mval/l); B5. Natural toxic pollutants arsenate (µg/l), cadmium (µg/l), chromium hexaval (µg/l), total chromium ( µg/l), copper ( µg/l), total iron (µg/l), total manganese (µg/l), nickel ( µg/l), zinc (µg/l), aluminium (µg/l); B6. other relevant specific pollutants-phenol (phenolic index- µg/l), active anionic detergents (µg/l), AOX (µg/l).
For the sampling, methods of SR.ISO 5667-4/2000 and SR.ISO 5667-12/2001 were used, and for physical – chemical determinations were used methods outlined in
Table 18.
Table 1. Methods for determination of physico-chemical indicators
N
r Indicator
Determinati on indicator
N
r Indicator
Determinai ons method
1
Total phosphorus (P)
SR EN ISO 6878/2005
1 3
filterable residue
STAS 9187/1984
2 Water temperature
STAS 6324/1961
1 4
Chlorides (Cl)
SR ISO 9297/2001
3 pH SR ISO
10523/2009
1 5
sulphates (SO₄)
Hungarian standard 8601/1970
4 Materials in suspension
STAS 6953/1981
1
6 Total iron
SR ISO 6332/1996
8 http://www.rowater.ro, Romanian National Waters Administration
IJCC
S
EC Volum
e 2, Issu
e 2
5 5 dissolved
oxygen SR EN 25813/2000 1 7 total manganese SR ISO 6333/1997
6 BOD₅
SR EN 1899/1-2003 1 8 phenols (phenol index) SR ISO 6439/C91/ 2006
7 CCOCr ISO
15705/2002 1 9 Active anionic detergents SR EN 903/2003 8 ammonium (N-NH₄)
SR ISO 7150-1/2001
2
0 color
SR ISO 7887/1997
9 nitrite (N-NO₂)
SR EN 26777/C91/ 2006 2 1 Transparenc y DISC SECCHI 1 0 nitrates (N-NO₃)
SR ISO 7890-3/2000 2 2 Saturation in oxygen STAS 6536/62 1 1 orthophosph ates (P- PO₄)
SR EN ISO 6878/2005
2
3 alkalinity
SR ISO 9963-1/2002 1 2 Conductivit y SR EN27888/1 997 2 4
the sum of calcium and magnesium
SR ISO 6059/2008
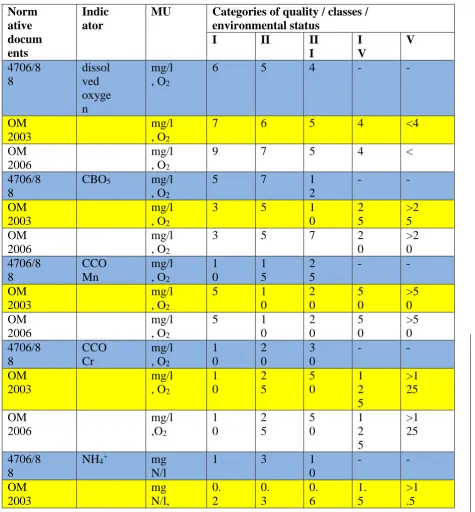
Water quality was regulated in 1990-2010 by three normative laws: the STAS9 4706/88, OM10 2003, OM 2006, which is currently in force.
The STAS 4706/88 established the surface water quality in 3 categories: I, II, III, according to which the usage of the water body would be established (central water supply, industrial power or fisheries, irrigation, hydropower, cooling). The norm on benchmarks for surface water classification as of 27.03.2003 established surface water quality classification in five classes: I, II, III, IV, V.
Normative classification of surface water quality that determines the ecological status of water bodies of 16.02.2006 establishes five ecological status: very I, good-II,moderate-III, weak-IV,bad-V on the basis of the quality of the biological, hydromorphological, chemical and physico-chemical properties. Table 211 summarises
9Water quality was regulated in 1990 - 2010 by three normative laws: the STAS 4706/88, OM. 2003 O.M.
In 2006, which is currently in force. STAS is a standard, state certifyed, acronym it's application is legaly required by general law or trough an exclusive regulatory reference. The acronym is formed from Sta [ndard] + s [tate].
10 Order of the Minister
11 http://www.monitoruloficial.ro/?lang=en
IJCC
S
EC Volum
e 2, Issu
e 2
6 some of the indicators and how they have changed the limits for classification in categories / classes of quality or environmental status. For the amount of dissolved oxygen expressed in mg / l O2, there is an increase from 6 mg / l O2 to 9 mg / l O2 for
classification as very good ecological status. Also for classifying with very good ecological status (I), BOD5 and CCOMn decreases from 5 mg / l O2, and 10 mg / l O2, 3
mg / l O2 and 5 mg / l O2. CCOCr indicator value remains unchanged for the inclusion in
the first state, a very good ecological status, but in return it increases in other environmental statuses, from 30 mg / l to 50 mg O2 / l O2, state III, for example.
Table 2. Indicator values (examples-for oxygen and nutrients) normative documents active in the period 1990-2010
Norm ative docum ents Indic ator
MU Categories of quality / classes / environmental status
I II II
I I V V 4706/8 8 dissol ved oxyge n mg/l , O2
6 5 4 - -
OM 2003
mg/l , O2
7 6 5 4 <4
OM 2006
mg/l , O2
9 7 5 4 <
4706/8 8
CBO5 mg/l
, O2
5 7 1
2
- -
OM 2003
mg/l , O2
3 5 1
0 2 5 >2 5 OM 2006 mg/l , O2
3 5 7 2
0 >2 0 4706/8 8 CCO Mn mg/l , O2
1 0 1 5 2 5 - - OM 2003 mg/l , O2
5 1
0 2 0 5 0 >5 0 OM 2006 mg/l , O2
5 1
0 2 0 5 0 >5 0 4706/8 8 CCO Cr mg/l , O2
1 0 2 0 3 0 - - OM 2003 mg/l , O2
1 0 2 5 5 0 1 2 5 >1 25 OM 2006 mg/l ,O2 1 0 2 5 5 0 1 2 5 >1 25 4706/8 8
NH4+ mg
N/l
1 3 1
0 - - OM 2003 mg N/l, 0. 2 0. 3 0. 6 1. 5 >1
.5 IJCC
S
EC Volum
e 2, Issu
e 2
7 OM 2006 mg N/l, 0. 4 0. 8 1. 2 3. 2 >3 .2 4706/8 8
NO2- mg
N/l, 1 3 * - -
OM 2003 mg N/l, 0. 0 1 0. 0 6 0. 1 2 0. 3 >0 .3 OM 2006 mg N/l, 0. 0 1 0. 0 3 0. 0 6 0. 3 >0 .3 4706/8 8
NO3- mg
N/l,
1 0
3
0 * - -
OM 2003
mg
N/l, 1 3 6
1 5 >1 5 OM 2006 mg
N/l, 1 3 5.
6 1 1. 2 >1 1. 2 4706/8 8 P-total mgP
/l, 0.1 - -
OM 2003 mgP /l, 0. 1 0. 2 0.
4 1 >1
OM 2006 mgP /l, 0. 1 5 0. 4 0. 7 5 1. 2 >1 .2 Oxygen regime
Oxygen regime refers to the amount, type and origin of aquatic oxygen.
In oligotrophic lakes with low biomass, primary production influences in a small rate the amount of oxygen, its concentration decreasing with depth, whereas in eutrophic lakes with high biomass, biocenosis influences the distribution of oxygen. The amount of oxygen decreases sharply with depth due to increasing consumption by bacterial processes and animals respiration.
The oxygen in the water can have many sources: from dissolved atmospheric oxygen (water oxygen concentration is about 5% of the concentration of atmospheric oxygen), produced by photosynthesis or resulting from the reduction of oxides.
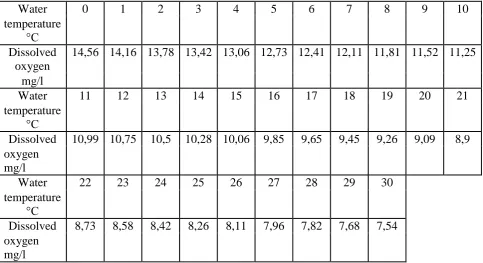
The oxygen is involved in the processes of breathing for the aquatic organisms, and also in the processes of oxidation. The dissolution of atmospheric oxygen into the water is influenced by the composition (salinity), temperature and turbulence of the water, air and environmental conditions (ex: atmospheric pressure). The quantities of dissolved oxygen and the water temperature are inversely related (see Table 3).
IJCC
S
EC Volum
e 2, Issu
e 2
8 The main source of aquatic oxygen is the atmosphere, while oxygen from photosynthesis may represent a higher percentage in lentic (lake) than in lotic (river) ecosystems due to lower water renewal rate. “Photosynthesis can be achieved at a depth where the light intensity is at least 1% of the surface intensity.”12
From the point of view of the influence of the oxygen concentration on the producers and other aquatic organisms (aquabiontes), the lake water can be stacked in a photic zone (euphotic, trophogen) and a aphotic (tropholitic), and from the point of view of the oxygen saturation water can be coated in an oxic layer above a anoxic layer. Deep lakes also have an intermediate (compensatory) zone similar to the metalimnion between the photic and the aphotic layer, or between the oxic and the anoxic layer, layer which is not present in Amara Lake which has a depth of only 4 meters. Photosynthesis of oxigen in shallow lakes depends on the amount and distribution of phytoplankton, the main producer, but also the quantity and distribution of macrophytes and phytobenthos. In eutrophic lakes, during “flowering” phytoplankton form a dense layer on the water surface, preventing light penetrating to deeper layers, which reduces the amount of oxygen, affecting pelagic and benthic organisms. In periods where this “flowering” does not manifest eutrophic lakes, due to the large amount of nutrients, and also have an increasing amount of phytoplankton, which leads to a comfortable trophic for many aquatic creatures. This, “hyperoxia" may be temporary, in daytime, because at night-time
12 Brezeanu Gheorghe, Simion-Gruiţă Alexandra, Limnologie generală, Editura H*G*A, Bucureşti,
2002[177]
Tabel 3. The relationship between dissolved oxygen and the temperature of the water pressure of 1 atm (after Palladin, 1949)
Water 0 1 2 3 4 5 6 7 8 9 10
temperature °C Dissolved
oxygen
14,56 14,16 13,78 13,42 13,06 12,73 12,41 12,11 11,81 11,52 11,25 mg/l
Water 11 12 13 14 15 16 17 18 19 20 21
temperature °C
Dissolved 10,99 10,75 10,5 10,28 10,06 9,85 9,65 9,45 9,26 9,09 8,9 oxygen
mg/l
Water 22 23 24 25 26 27 28 29 30
temperature °C
Dissolved 8,73 8,58 8,42 8,26 8,11 7,96 7,82 7,68 7,54 oxygen
mg/l
IJCC
S
EC Volum
e 2, Issu
e 2
9 the same phytoplankton consumes massive amounts of oxygen in their breathing process.
At this consumption due to phytoplankton, oxygen consumption of bacteria that decompose and mineralize organic matter at the bottom of the lake basin is added, leading to periods of hypoxia, or even anoxia. They may be short-lived, not detected by current monitoring, but very important for lake aquatic fauna, it can lead to extinction of species, replacing them with others and disrupting food chains. The effects of these repeated hypoxia can be identified belatedly or might not determine with certainty the causal relationship between phenomena and the modification trophic networks. Hypoxia can lead to the replacement of aerobic decomposers with anaerobic ones, with effects on the increasing of the amount of organic sulphur and sediments of toxic gases such as hydrogen sulphide, methane, carbon dioxide in the deep area.13 In general, it is considered that in eutrophic lakes there is a shortage of oxygen, although in the epilimnion, for short periods, there may be surplus. These estimations are made according to the values of the oxygen saturation value which, in turn, depends on the temperature and pressure at the time of measurement. (Table 314)
The biochemical oxygen demand (BOD) expresses the loading of water with biodegradable organic nature, representing the amount of oxygen required for aquatic microorganisms decomposing organic matter in water in 5 days (BOD5).
The regime of oxygen in Amara Lake is systematically monitored since 2004, determining dissolved oxygen, BOD5, COD-Mn, CCO-Cr (MgO / l), and since 2005 is
determined and recorded the dissolved oxygen saturation (%).
Analysis of dissolved oxygen in Amara Lake troughout 2004-2010 shows a trend of decreasing values recorded by the monitoring of this parameter, with short periods of growth in 2005 and 2006. From 2007, the downward trend is constant, being in inverse correlation with the global class quality in which the oxygen was placed. (Image 2).
13 Nicoară Mircea, Ureche Dorel, Ecologie acvatică, Editura PIM, 2008, Iaşi
14 Telcean, C. Ilie, Cupşa, Diana, Ghid practic pentru studiul biologiei râurilor, Editura Ecozone, Iaşi,
2005
0 2 4 6 8 10
2004 2005 2006 2007 2008 2009 2010
Image 2. Comparative evolution of oxygen dissolved and classification in grade oxygen regime, Amara, 2004-2010
Global class quality
Dissolved oxygen (mgO/l)
Linear (Global class quality)
IJCC
S
EC Volum
e 2, Issu
e 2
10 In 2006 (taken as the reference year because of the number of determinations -9, in 6 points of sampling), the annual growth of the amount of dissolved oxygen, two points of maximum value are observed, in spring and autumn (March to November), corresponding to periods of mixture of water masses and a decline in the mass corresponding to the summer months (Image 3).
For the same year, comparing the amount of dissolved oxygen in correspondence with the temperature of the water, we can observe a decrease in the oxygenation of water during growth of the thermal regime (Image 4).
0 2 4 6 8 10 12 14
m
gO/l
Image 3. The dynamic of dissolved oxygen (mgO/l) , Amara, 2006
0 10 20 30
Ma
r-06
May
-0
6
Ju
n
-06
Ju
l-06
Au
g-06
Se
p
-06
Oct-06
N
o
v-06
De
c-0
6
2006
Image 4. Dynamics of caloric values and dissolved oxygen regime
,
Amara, 2006Water temperature (°C)
Dissolved oxygen(mg
O/l) IJCC
S
EC Volum
e 2, Issu
e 2
11
Biochemical consumption of oxygen
Regarding the biochemical oxygen demand BOD5, representing the difference of
oxygen consumption by micro-organisms (through biochemical decomposition) of organic substances in water for 5 days (20 ° C), this indicator provides information about the ability of biological epuration of water: <0.2 mg/dm3 – the water can’t be epurated biologically, 0.2 - 0.4 mg/dm3 the water needs a caloric intake to be biologically epurated (treatment plants), 0, 6 mg/dm3, water has the property of easy biological epuration.15
The BOD5 parameter indicates indirect water laden with biodegradable substances.
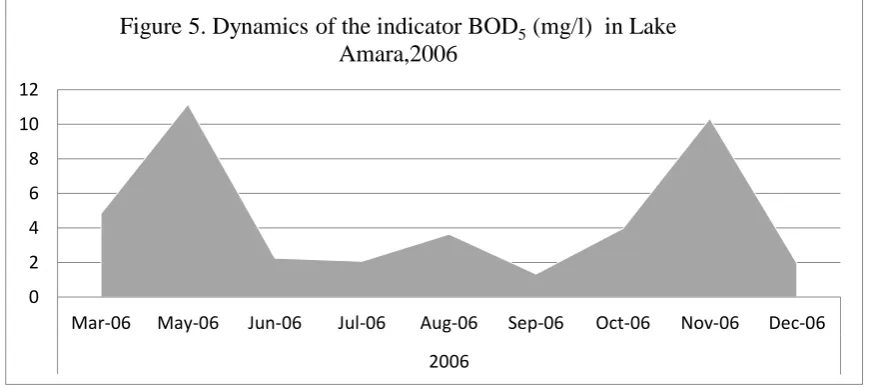
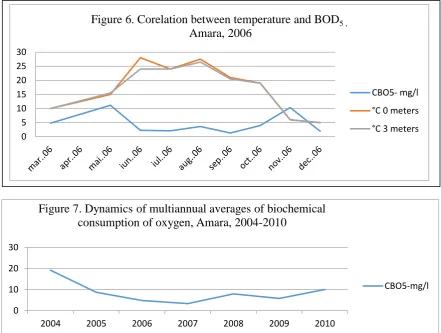
In Amara Lake, the dynamics of this indicator in 2006, reveals two points of maximum value (Figure 5) in May and November (spring and autumn periods corresponding to mixtures of water masses, and a downward trend during hot Summer, thus in an inverse correlation with temperature (Figure 6). Vertically, BOD5 value varies
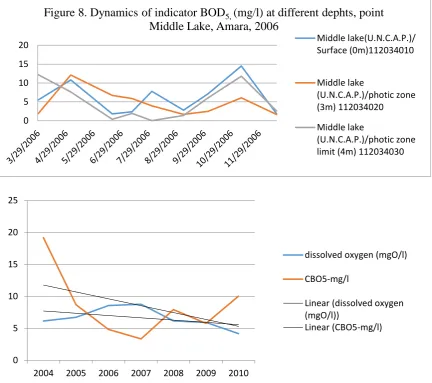
very little (Table 3), the depth being very small (Figure 8 and Table 4). Regarding the dynamic multiannual environments in the years 2004-2010, BOD5 has increased values
in 2004 and 2010 (in 2004 having registered the highest average) and periods of decline in 2005-2009 (Figure 7).
Comparing the average values of BOD5 to the annual average values of dissolved
oxygen in the same period, there are visible trends of decreasing in time of both parameters, and also inverse relationship between them, the intense biochemical consumption of oxygen contributing, among other factors (for example temperature) to the decrease of the amount of oxygen dissolved in water (Figure 9). Considering all the oxygen regime parameters: dissolved oxygen, oxygen saturation, BOD5, Cr, COD-Mn (last 2 parameters determined in 15 campaigns, different from each other, of the 32 campaigns conducted in 2004-2010 ), the inclusion in quality classes demonstrate a tendency towards a continuous degradation of the water in Amara Lake, included predominantly in quality classes IV and V (4 and 5 - in the graphic) - Figure 10.
15 Angelescu Anca, Vişan Sanda, Protecţia mediului ambiant, Editura ASE, Bucureşti, 2006
0 2 4 6 8 10 12
Mar-06 May-06 Jun-06 Jul-06 Aug-06 Sep-06 Oct-06 Nov-06 Dec-06
2006
Figure 5. Dynamics of the indicator BOD5(mg/l) in Lake Amara,2006
IJCC
S
EC Volum
e 2, Issu
e 2
12 Depth distribution for dissolved oxygen Figure 8), Middle of the lake sampling point, (U.N.C.A.P.16) confirms the absence of categorical stratification in the epilimnion and hypolimnion and the lack of metalimnion, a characteristic of eutrophic lakes in temperate areas with shallow depths in the fall, category in which Lake Amara is also included.
16 A beach name
0 10 20 30
2004 2005 2006 2007 2008 2009 2010
Figure 7. Dynamics of multiannual averages of biochemical consumption of oxygen, Amara, 2004-2010
CBO5-mg/l 0
5 10 15 20 25 30
Figure 6. Corelation between temperature and BOD5 , Amara, 2006
CBO5- mg/l
°C 0 meters
°C 3 meters
Table 4. CBO5 indicator values at the point of harvest, Middle lake, at different dephts, Amara, 2006
DATE
Middle
lake(U.N.C.A.P.)/ Surface (0m)112034010 BOD5 mg/l
Middle
lake(U.N.C.A.P.)/Photic area (3m) 112034020
BOD5 mg/l
Middle
lake(U.N.C.A.P.)/Photic area limit(4m) 112034030 BOD5 mg/l
29.03.2006 5,5 1,9 12,2
04.05.2006 10,83 12,11 7,63
19.06.2006 1,81 6,7 0,4
11.07.2006 2,38 5,88 1,94
02.08.2006 7,79 3,96 0,03
06.09.2006 2,81 1,71 1,4
03.10.2006 7,14 2,5 6,04
09.11.2006 14,5 6,07 11,8
18.12.2006 1,87 1,66 2,62
IJCC
S
EC Volum
e 2, Issu
e 2
13 Figure 9. Dynamics of indicator CBO5 and dissolved oxygen (multiannual averages), Amara, 2004-2010
0 5 10 15 20
Figure 8. Dynamics of indicator BOD5, (mg/l) at different dephts, point Middle Lake, Amara, 2006
Middle lake(U.N.C.A.P.)/ Surface (0m)112034010
Middle lake
(U.N.C.A.P.)/photic zone (3m) 112034020
Middle lake
(U.N.C.A.P.)/photic zone limit (4m) 112034030
0 5 10 15 20 25
2004 2005 2006 2007 2008 2009 2010
dissolved oxygen (mgO/l)
CBO5-mg/l
Linear (dissolved oxygen (mgO/l))
Linear (CBO5-mg/l)
4 4 4 4 4 44 4
3 4
11 3
1 33
1
4 4 4 4
3 3 3
4 4 4
5 5 555
m
ar
..04
iul..04 nov..0
4
m
ar
..05
iu
l..05
n
o
v..0
5
m
ar
..06
iu
l..06
n
o
v..0
6
m
ar
..07
iu
l..07
n
o
v..0
7
m
ar
..08
iu
l..08
n
o
v..0
8
m
ar
..09
iu
l..09
n
o
v..0
9
m
ar
..10
iu
l..10
Figure 10. Quality class accoring tooxygen regime,Amara Lake, 2004-2010
Global class Linear (Global class)
IJCC
S
EC Volum
e 2, Issu
e 2
14
Conclusions
Eutrophication of freshwater bodies (but not only – blooms of eutrophication have been observed in the Black Sea marine bays and estuaries) is currently the main issues that preoccupies researchers and policy or economic makers.
The aging process of lakes is accelerated due the trophic state induced by nutrients originating from anthropogenic activity.
Water bodies are constantly monitored in terms of indicators of eutrophication, so that measures be can implemented to halt the phenomenon in time. Considering the entire period studied, 2004-2010, we find that for the past few years, 2007-2010, a departure from the normal model (the pattern) of the dynamics of the two parameters : dissolved oxigen and temperature, which can be sign of the lakes ability of self adjustment.
Variations in oxygen regime suggests a process of self-sustained endoeutrophication (one that is triggered by internal processes) which was triggered by exoeutrophication due to nutrient intake caused mainly by human activity in the lake and
its basin.
Phenomena and processes described for a certain lentic ecosystem do not overlap exactly over ones describing another ecosystem, due to morphological differences, climate and anthropogenic use. The eutrophic status of a lake can be determined only in comparison to his previous state or a reference lake (similar in geographic location, etc.). Research conducted in recent years have yet to lead to the discovery of a model that would apply to all lakes, each having its own peculiarities. Therefore, studying this phenomenon on Amara Lake and the multiple other lakes, would contribute to a comprehensive database, leading to identification of the type of eutrophication, the main causes and methods of slowing down, halting or reversing the process as to achieve a basin management plan to allow sustainable development of the area.
Bibliography
1. Angelescu Anca, Vişan Sanda, Protecţia mediului ambiant, Editura ASE, Bucureşti, 2002(177) -The protection of the sorrounding environment, ASE Publishing, Bucharest, 2002(177)
2. Botnariuc Nicolae, Evolutia sistemelor biologige supraindividuale, Editura Academiei Romane, Bucuresti, 2003- The evolution of superindividual biological systems, Academia Romana Publishing, Bucharest, 2003
3. Brezeanu Gheorghe, Simion-Gruiţă Alexandra, Limnologie generală, Editura H*G*A, Bucureşti, 2006- General Limnology, H*G*A Publishing, Bucharest, 2006
4. Formularul standard NATURA 2000, pentru ariile cu protecţie specială, S.P.A., -Grupul de lucru NATURA 2000, ANM-IL1- Stardard form NATURA 2000, for
special protection areas, S.P.A.,- workgroup NATURA 2000, ANM-IL1
5. Geacu, Sorin,Dictionar geografic al judetului Ialomita, Ed. Enciclopedica, Bucuresti, 1997- Geographic dictionary of Ialomita county, Ed. Enciclopedica, Bucharest, 1997
IJCC
S
EC Volum
e 2, Issu
e 2
15 6. Informare privind lacul terapeutic Amara- Arhiva DAB, 1977- Information
regarding Amara therapeutic lake- DAB Archive, 1977
7. Lake Eutrophication- des. nh. gov/ organization /commissioner/ pip/factsheets/bb / documents/bb-3.pdf
8. Nicoară Mircea, Ureche Dorel, Ecologie acvatică, Editura PIM, 2008, Iaşi-Aquatic Ecology, PIM Publishing, 2008, Iaşi
9. Sandu Dorina, Monografia localităţii Amara, Ed. StarTipp, Slobozia, 2004-
Monography of Amara, StarTipp Publishing, Slobozia, 2004
10.Sinteza anuala privind protectia calitatii apelor pentru Bazinul Hidrografic Ialomita,2006, Administratia Nationala, Apele Romane- Annual summary regarding the protection of water quality of Ialomita River Basin,2006, Romanian National Waters Administration
11.Pisota, Ion, Biogeografie, Ed. Universitara, Bucuresti, 2002- , Biogeography,
Ed. Universitara, Bucharest, 2002
12.Planul de refacere a mediului-perimetrul de exploatare nămol terapeutic, Amara, jud. Ialomiţa,ANPM, 2007- Enviroment rebuilding plan – therapeutic mud exploitation in the Amara, jud. Ialomiţa perimeter,ANPM, 2007
13.Telcean, C. Ilie, Cupşa, Diana, Ghid practic pentru studiul biologiei râurilor, Editura Ecozone, Iaşi, 2005- Telcean, C. Ilie, Cupşa, Diana, Practical guide for studying river biology ,Ecozone Publishing, Iaşi, 2005
14.Thomas, A.,Eugen, The Process of Eutrophication in Central European Lakes, in
Eutrophication: causes, consequences, correctives, Proceedings of a Symposium, National Academy of Sciences, Washinton, D. C., 1969
15.http://www.rowater.ro
16.http://www.monitoruloficial.ro
IJCC
S
EC Volum
e 2, Issu
e 2