ISSN: 2333-6048 (Print), 2333-6056 (Online) Copyright © The Author(s). 2014. All Rights Reserved. Published by American Research Institute for Policy Development DOI: 10.15640/jmpp.v2n3a2 URL: http://dx.doi.org/10.15640/jmpp.v2n3a2
How Leadership Practices Impact Job Satisfaction of Customer Relationship Officers’: An Empirical Study
Kingsley Eze Emu1 & Ogwo J. Umeh2
Abstract
The purpose of the quantitative correlation study was to investigate the relationship between leadership styles/practices and job satisfaction among customer relationship officers in Nigerian banks. A sample size of 85 participants from a target population of 400 customer relationship officers was used for the study. The full-range leadership styles of (transactional, transformational and laissez-faire) were used as the basis of this study. The nine behavioral dimensions of the full-range leadership style were measured using the multifactor leadership questionnaire (MLQ). Employee Job satisfaction was measured using the job-in-general instrument (JIG). Statistically significant results were found among behavior dimensions of idealized influence attribute score, ( n=(85); r= .24; p=.026); intellectual stimulation score (n= (85); r= .30; p=.006); individual consideration score (n= (85); r= .22; p = .044); and contingent reward score (n= (85); r= .23; p= .037) of transformational and transactional leadership styles of the managers are positively correlated with employee job satisfaction. Curiously, idealized influence behavior score (n= (85); r= .13; p =.24); inspirational motivation score (n= (85); r= .14; p=.20) ; and management-by-exception-active score (n= (85); r= .03; p= .77) were negatively correlated with employee job satisfaction. The findings of this study provide useful information to Nigerian bank leaders in determining which leadership styles may be associated with employee job satisfaction and performance. Keywords: Job satisfaction, Relationship Officers’ job satisfaction, leadership styles
1.1. Introduction
Banks are the engine of economic growth worldwide (Meslier-Crouzille, Nys, & Sauviat, 2009).
1
DM, Principal Partner, KAME Benefits Ltd. P. O Box 55547 Falomo Ikoyi Lagos Nigeria. Email: [email protected]
2
Along with other financial institutions, banks finance activities needed to create credit expansion that lead to growth and economic prosperity (Ugolini, 2010). Activities of banks worldwide, especially those in Europe and America, in rendering services to sustain and enhance economic activities have recently been hampered since the global economic meltdown between 2007-2008 (Greenspan, 2008; Rhodes & Stelter, 2010). According to Greenspan (2008) and Wagner (2010), customers’ inability to service matured obligations to the lending banks have negatively affected the lending role of banks, by creating the burden of toxic assets (bad loans and advances) and illiquidity, which have pushed some of the banks worldwide to the brink of bankruptcy (Greenspan, 2008).
In Nigeria, banks appear to have remained profitable, despite the challenges posed by the global economic meltdown, while those in the United States and Europe have been surviving as a result of government bailouts under the stimulus response package, as was evident in the cases of Fannie Mae and Freddie Mac, Citicorp Group, and AIG (Central Bank of Nigeria, 2008; Chossudovsky, 2008). In the recent past, the Central Bank of Nigeria (2009) commissioned a special inquiry to examine the claims of profitability and performance of banks as contained in published reports. Five of the 24 banks—Oceanic, Finbank, Intercontinental Bank, Spring Bank, and Bank PHB—had not complied with the Central Bank’s prudential guidelines by earning on nonperforming loans and advances. The perceived infraction on ethical and corporate governance policies may have been partly responsible for these banks’ prosperity (Central Bank of Nigeria, 2009)
Two banks, IBTC and Stanbic Bank, merged to form Stanbic IBTC Plc in 2008, and the merger further reduced the number of banks operating in Nigeria to 24. Nigerian banks compare favorably with banks in Europe and America in terms of technology and human and financial capital, especially after the banking consolidation in 2005. The capitalization from two to 25 billion Naira, the equivalent of 13,300,000 to 166 million USD, led to the spate of mergers and acquisitions creating 24 banks. The new capital enhanced the abilities of the banks to make major investments in technology, undertake financing of major projects, expand the array of products and services, and invest in human capital development.
The investment climate of the Nigerian economy has been favorable, with the seeming political stability and redemption of Nigeria’s outstanding loans to international financing institutions, which earned Nigeria a BB rating in 2007. The sovereign rating by Standard & Poor’s changed in 2009 from stable to negative because of the dwindling fortunes of oil revenues, reduced bank lending, and massive construction projects embarked upon by state and federal governments (Aminu, 2009). Despite these developments and the impact of the global meltdown, which affected banks in Europe and America, Nigerian banks appeared to be immune. That is, they have remained profitable and prosperous, even in the midst of a global meltdown and a freeze on previously approved lines of credit by multilateral financial institutions.
The profitability of most of the banks improved in 2010, as evident in the first through third quarters of audited and published results (see Appendix A). The rate of growth of Nigerian banks and the extent of involvement of the regulatory authorities in the period preceding the global economic crises appeared to have repositioned the banks for the consequences of the meltdown (Central Bank of Nigeria, 2009; Nigeria Deposit Insurance Corporation, 2009; Nigeria Securities and Exchange Commission, 2009). The rate of expansion in the banking industry meant that a more effective leadership orientation was necessary. Acquisition of skills to deliver product and service initiatives became imperative, as did the sustenance of performance in the overall product and service lines offered by these banks.
1.2. Research Question
To what extent is there a relationship between leadership styles and customer relationship officers’ job satisfaction?
1.3. Hypotheses
H1a: There is a significant correlation between the perception of the marketing
manager’s idealized influence attributed leadership style (IIA) and job satisfaction (JS).
H2a: There is a significant correlation between the perception of the marketing
manager’s idealized influence behavioral leadership style (IIB) and job satisfaction (JS).
H3a: There is a significant correlation between the perception of the marketing
manager’s inspirational motivation leadership style (IM) and job satisfaction (JS).
H4a: There is a significant correlation between the perception of the marketing
manager’s intellectual stimulation leadership style (IS) and job satisfaction (JS).
H5a: There is a significant correlation between the perception of the marketing
manager’s individualized consideration leadership style (IC) and job satisfaction (JS).
H6a: There is a significant correlation between the perception of the marketing
manager’s management by exception–active leadership style (MEA) and job satisfaction (JS).
H7a: There is a significant correlation between the perception of the marketing
H8a: There is a significant correlation between the perception of the marketing
manager’s contingent reward leadership style (CR) and job satisfaction (JS).
H9a: There is a significant correlation between the perception of the marketing
manager’s laissez-faire leadership style and job satisfaction (JS).
2.1. Literature Review/Theoretical Framework
The subject of leadership has generated much interest since the works of Bass (1985) and subsequently the theories of full-range leadership styles (Bass & Avolio, 1990). Avolio and Bass (2002) argued that no other subject had received such attention and contributions in the social sciences from interdisciplinary scholars, compared to the subject of leadership, in the decade preceding the full-range leadership theory. Thousands of pieces of academic and opinion literature exist on the subject matter, especially on leadership, but hardly any works were found on the banking industry in Nigeria.
Research suggests that leaders who exhibit transactional and transformational leadership styles engender performance by keeping to an agreed target and encouraging acquisition of skills relevant to the set goals (Casida & Pinto-Zipp, 2008; Ho et al., 2009). By rewarding through pay, promotion, and facilitating the acquisition of skills, employees’ job satisfaction is guaranteed and directly influences job performance (Deluga, 1988). Given the growth and expansion of product and services in the Nigerian banking industry, the transactional and transformational leadership styles appear to be the dominant leadership styles in use. The outcome of the quantitative study will be instrumental in helping to determine if the leadership styles positively impact customer relationship officers’ job satisfaction in Nigerian banks, especially since no such study currently exist.
According to Boynton and Fisher (2005), low job satisfaction can lead to a high employee turnover rate, which is detrimental to the business. Other studies have found a positive correlation between job satisfaction, commitment, and performance (Yang, 2010). According to Yang, when employees and the leadership of the organization cultivate positive social exchange relations, the outcome of the relationship can be similar to a psychological contract. Employees view the reciprocal relationship as binding and feel motivated to engage in organizational citizen behaviors that translate into performance.
Several theoretical perspectives of work motivation treat job satisfaction as a critical factor able to help predict behavior (Steers, Mowday, & Shapiro, 2004). Of major concern is the need for Nigerian bank leaders to determine leadership styles that best correlate with employee job satisfaction to be able to sustain and improve the performance of banks in Nigeria. The knowledge of the type of leadership style leading to employee job satisfaction and performance may help sustain growth and expansion in the Nigerian banking industry.
Quantitative correlational studies rely on the existence of literature and theories of relevant studies to test hypotheses the researcher sets out to investigate (Creswell, 2003). The review of existing relevant studies and literature helped to establish a theoretical foundation for the study. The theoretical perspectives guiding the study included scientific management theory; the leadership styles of transformational, transactional, and laissez-faire; Locke’s (1968) goal-setting theory; Vroom’s (1964) expectancy theory; Herzberg, Mausner, and Snyder’s (1959) motivator-hygiene factors; and Maslow’s (1970) hierarchy of needs.
The perspectives of the selected theories provided insights into examining the reasons to explain employee job satisfaction and leadership style in the Nigerian banking industry. The study began with a broad overview of existing leadership and job satisfaction theories under which the study falls, followed by a narrowing to relevant literature. The following paragraphs address the chosen theories, explaining the relevance to the study.
The conceptual frameworks for the study included Maslow’s hierarchy of needs (Maslow, 1970), Herzberg’s dual factor theory, and Kouzes and Posner’s domain of leadership practices theory (Kouzes and Posner, 2003). Maslow and Herzberg (Herzberg, 1996) suggest that motivation is a key factor in job satisfaction, with emphasis on social, safety and psychological rewards. Kouzes and Posner identified 5 distinct practices that outstanding leaders rely on to effect employees’ and organizational performance.
3.1. Methodology
The purpose of this quantitative correlation study was to investigate the relationship between leadership styles, and job satisfaction among customer relationship officers in a Nigerian bank. The full-range leadership theories of laissez-faire, transactional, and transformational (independent variables), which consists of nine leadership dimensions, were measured using the Multifactor Leadership Questionnaire (MLQ; Avolio & Bass, 2004). The customer relationship officers’ job satisfaction (dependent variable) was measured using the Job in General survey (JIG; Balzer et al., 2000). Eighty-five respondents participated from the population of 400 full-time customer relationship officers of the participating bank in Nigeria. This appears to be acceptable given that typical online survey response rates are approximately 20% (McMahon et al; 2003).
The nine behavioral dimensions of the three leadership styles (transactional, transformational, and laissez-faire) were tested to ascertain the degree of relationship and the impact on employee job satisfaction. The behavior dimensions constituted the content of the MLQ, which contains closed-ended questions. The MLQ (Avolio & Bass, 2004) was the instrument used to quantify the leadership styles within FRLT of transformational, transactional, and laissez-faire styles. The JIG questionnaire measured job satisfaction of the customer relationship employees. The JIG contains 18 items and reflects individuals’ general feelings toward the jobs, encompassing all aspects of job satisfaction (Balzer et al., 2000). Several studies have alluded to the reliability and validity of the instrument (Balzer et al., 2000; Van Saane et al., 2003).
The target population was comprised of full-time customer relationship officers from one of the three largest banks in Nigeria, as measured in terms of size (balance sheet and branch network), profitability, total staff strength, and strong leadership (Central Bank of Nigeria, 2009). The customer relationship officers include 400 full-time male and female employees, also known as marketing staff in the Nigerian banking industry. A census sampling method was appropriate, and because participation in the study was voluntary, all of the 400 customer relationship officers received invitations to participate. The choice of the customer relationship officers rather than the entire bank employee base was for time and convenience. The customer relationship officers have direct contact with the customers, and the quality of service rendered determined the level of patronage (Yang, 2010).
All 400 members of the target population received invitations to participate. Because participation was voluntary, all members of the population had equal chance to participate in the study. A census sampling method was adopted and the questionnaires administered online through email. Based on existing studies, typical online survey response rates are approximately 20%. According to McMahon et al. (2003), although e-mail survey response rates are lower, compared to fax and postal survey methods, the average response rate of 20% has become popular because of convenience and anonymity.
Eighty-five respondents participated in the study and constituted the sample size. According to Cohen (1988), Pearson correlation coefficients of r = .1, r = .3, and
r = .5 are indicative of weak, moderate, and strong correlations between the variables
For example, if the true population correlation between JS and IIA was 0.30 or greater, this study would have had an 80% chance of detecting this correlation at the 0.05 level of statistical significance.
The data collection process took place through e-mail administered by the head of human resources or the head of human capital development of the participating bank through a link to the survey website of Survey Monkey. All of the customer relationship officers of the participating bank constituted the population, and only customer relationship officers who participated constituted the sample. The survey was available on the website at www.surveymonkey.com. Online surveys allow for quick turnaround of results and guarantee respondents’ anonymity (Cooper & Schindler, 2004).
A cover letter accompanied the MLQ and JIG instruments. Participants received direction to read the instructions and complete the instruments. The participants received information regarding the purpose of the study, how to find the website, when to complete the survey, and the need to return the consent to participate before the participants will be able to complete the MLQ and JIG questionnaires. Several e-mail reminders were sent to prompt respondents to complete the survey. Upon completion by participants, the instruments were transmitted directly to the website of Survey Monkey, where the responses remained until retrieval.
All of the analyses were two-sided with a 5% alpha level. The mean, standard deviation, and range were the summarized statistical results for the continuous scaled variables of the demographic data, and frequency and percent applied for categorical scaled variables. Cronbach’s alpha was used as the measure of the internal consistency reliability of the leadership style and job satisfaction scores (Casey, Oei, Melville, & Bourke, 2008).
4.1. Findings
Demographic Data
Of the 85 participants 27 were female (31.8%) while 58 were male (68.2%). Table 2 provides a breakdown of the participants by gender.
Table 2: Gender: All Participants
Frequency % Valid % Cumulative %
Valid Male 58 68.2 68.2 68.2
Female 27 31.8 31.8 100.0
Total 85 100.0 100.0
The number of study participants with a college degree or its equivalent such as the higher national diploma (HND) as their highest level of education was 43 which represented 50.6% of the sample size. Forty (40) or 47.1% of the study participants had a master’s degree and two (2) or 2.1% of the participants had other degrees. Other degrees included participants who earned doctoral degrees. Table 3 provides a breakdown of the participants by highest level of education.
Table 3: Highest Educational Qualification: All Participants
Frequency % Valid % Cumulative %
Valid BSC/HND 43 50.6 50.6 50.6
MSC/MBA 40 47.1 47.1 97.6
Other 2 2.4 2.4 100.0
Total 85 100.0 100.0
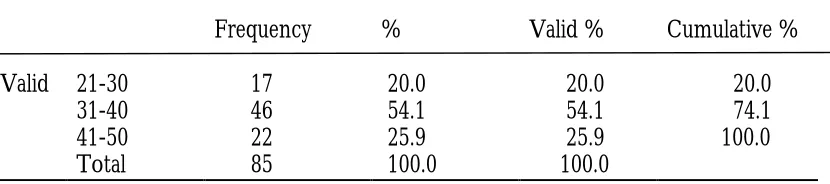
The highest cluster of age was between 31-40 years (54.1%). Ages 41-50
represent 22 or 25.9%, while ages 21-30 accounted for 17 or 20%. Table 4 provides details of the age of participants.
Table 4: Age of Participants: All Participants
Frequency % Valid % Cumulative %
Valid 21-30 17 20.0 20.0 20.0
31-40 46 54.1 54.1 74.1
41-50 22 25.9 25.9 100.0
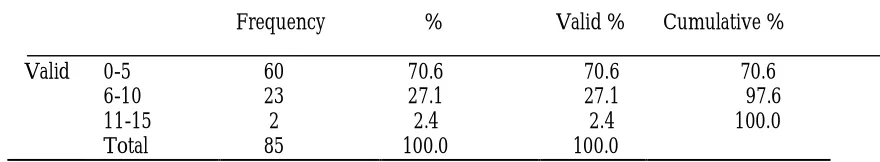
Information on the number of years of experience as a customer relationship officer was elicited from study participants. Data showed that 60 or 70.6% of the participants had between 0 to 5 years of experience. Twenty-three (23) or 27.1% of the participants had 6 to 10 years of experience, and two or 2.4% of the participants had between 11-15 years of experience. The details of years of experience are shown in Table 5.
Table 5: Years of Experience as a Customer Relationship Officer: All Participants
Frequency % Valid % Cumulative % Valid 0-5 60 70.6 70.6 70.6
6-10 23 27.1 27.1 97.6 11-15 2 2.4 2.4 100.0
Total 85 100.0 100.0
4.2. Hypothesis Testing
Hypothesis testing is an integral part of quantitative correlation studies. According to Leedy and Ormrod (2010) some of the special characteristics that guide quantitative studies include hypothesis testing, research questions and the research problem. Unlike the qualitative method, quantitative research method uses hypothesis testing to answer the research question. Sheb and Nguyen (2009) noted that the appropriateness of quantitative correlation research design lies in the application and use of variables to determine relationships, eliminate subjectivity, minimize the waste of time, and facilitate evaluation and options in the decision-making process.
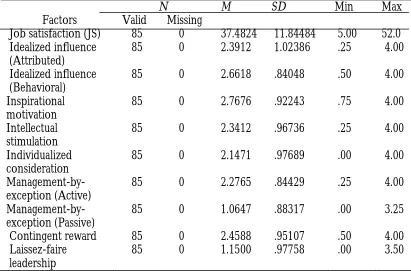
4.3. Descriptive Statistics for the Independent and Dependent Variables
The use of descriptive statistics involves the measures of central tendency and frequencies such as mean, mode, median, range, variance, and standard deviation (Vogt, 2007). Using descriptive statistics helped to summarize the data collected on the independent (leadership styles) and dependent (job satisfaction) variables. Vogt (2007) stated that descriptive statistics help to summarize large data with one number as well as explain the characteristics of a relationship with table and graphical approaches.
Table 6: Descriptive Statistics for the Job Satisfaction and Leadership Style Scores
Factors
N M SD Min Max
Valid Missing
Job satisfaction (JS) 85 0 37.4824 11.84484 5.00 52.0
Idealized influence (Attributed)
85 0 2.3912 1.02386 .25 4.00
Idealized influence (Behavioral)
85 0 2.6618 .84048 .50 4.00
Inspirational motivation
85 0 2.7676 .92243 .75 4.00
Intellectual stimulation
85 0 2.3412 .96736 .25 4.00
Individualized consideration
85 0 2.1471 .97689 .00 4.00
Management-by-exception (Active)
85 0 2.2765 .84429 .25 4.00
Management-by-exception (Passive)
85 0 1.0647 .88317 .00 3.25
Contingent reward 85 0 2.4588 .95107 .50 4.00
Laissez-faire leadership
85 0 1.1500 .97758 .00 3.50
4.4. Internal Consistency Measures for the Independent and Dependent Variables
Table 7: Cronbach’s Alpha Reliability for the Job Satisfaction and Leadership Style Scores
Variable Cronbach's alpha (n = 85) Number of items
Job satisfaction 0.87 18
Idealized influence (attributed) 0.82 4
Idealized influence (behavior) 0.65 4
Inspirational motivation 0.80 4
Intellectual stimulation 0.74 4
Individualized consideration 0.68 4
Management-by-Exception (Active) 0.53 4
Management-by-Exception (Passive) 0.73 4
Contingent reward 0.74 4
Laissez-faire 0.76 4
4.5. Hypothesis Test Results
The investigation involved determining if there is a significant relationship between each of the leadership styles and the job satisfaction of the employees in a Nigerian bank. To facilitate the process, the study tested the behavior dimensions of the full-range leadership styles on job satisfaction in 85 employees of a bank in Nigeria. The objective of the entire study focused on nine research questions and nine alternate hypotheses with corresponding null hypotheses. The research questions helped to guide the study by examining if a relationship exists between the leadership styles of laissez-faire, transactional, and transformational and employee job satisfaction. The quantitative correlation study sought to answer the following nine research questions and test the corresponding alternative and null hypothesis.
Hypothesis 1: Research Question1 was what, if any, relationship is present
between the perceptions of the marketing manager’s idealized influence attributed leadership style (IIA) and job satisfaction (JS)? The corresponding null hypothesis
(H10) predicted that there is no significant correlation between the perception of the
marketing manager’s idealized influence attributed leadership style (IIA) and job
satisfaction (JS). The alternate hypothesis (H1a) was there is a significant correlation
Table 8 shows the relevant Pearson product-moment correlation, which was used to address the hypothesis. Figure 1 is a scatter plot which graphically depicts the relationship between the job satisfaction score (y-axis) and the idealized influence attributed score (x-axis). Figure 1 shows an indication of a positive correlation between the two variables. Table 8 shows a statistically significant, moderately positive correlation between the job satisfaction score and the idealized influence attributed score, n = (85); r = .24; p = .026. Based on the sample evidence and the
analysis, the null hypothesis (H10) was rejected and it was concluded that there is
strong evidence to suggest that customer relationship officers who perceive the marketing manager to have a high level of idealized influence attributed leadership style, tend to be more satisfied with their job.
Table 8: Pearson’s Correlation Statistic for Job Satisfaction Versus Idealized Influence Attributed
Idealized influence (Attributed)
Job satisfaction Pearson correlation .242
p-value .026
N 85
Hypothesis 2: Research Question 2 was what, if any, relationship is present
between the perceptions of the marketing manager’s idealized influence behavioral leadership style (IIB) and job satisfaction (JS)? The corresponding null hypothesis
(H20) predicted that there is no significant correlation between the perception of the
marketing manager’s idealized influence behavioral leadership style (IIB) and job
satisfaction (JS). The alternate hypothesis (H2a) was that there is a significant
correlation between the perception of the marketing manager’s idealized influence behavioral leadership style (IIB) and job satisfaction (JS).
Based on the sample evidence and the analysis, the null hypothesis (H20) was
not rejected and it was concluded that there is no evidence to suggest there is a relationship between job satisfaction and the perceived idealized influence behavioral leadership style of the marketing manager, among customer relationship officers.
Table 9: Pearson’s Correlation Statistic for Job Satisfaction Versus Idealized Influence Behavioral
Idealized influence (Behavioral)
Job Satisfaction Pearson Correlation .128
p-value .243
N 85
Hypothesis 3: Research Question 3 was what, if any, relationship is present
between the perceptions of the marketing manager’s inspirational motivation leadership style (IM) and job satisfaction (JS)? The corresponding null hypothesis (H30) predicted that there is no significant correlation between the perception of the marketing manager’s inspirational motivation leadership style (IM) and job satisfaction
(JS)”.The alternate hypothesis (H3a) was there is a significant correlation between the
perception of the marketing manager’s inspirational motivation leadership style (IM) and job satisfaction (JS).
Table 10 shows the relevant Pearson product-moment correlation, which was used to address the hypothesis. Figure 3 is a scatter plot which graphically depicts the relationship between the job satisfaction score (y-axis) and the inspirational motivation score (x-axis). The figure gives little evidence of a correlation between the two variables. Table 10 shows there was no statistically significant correlation between the job satisfaction score and the inspirational motivation score, n = (85); r = .14; p =
.20. Based on the sample evidence and the analysis, the null hypothesis (H30) was not
Table 10: Pearson’s Correlation Statistic for Job Satisfaction Versus Inspirational Motivation
Inspirational motivation
Job Satisfaction Pearson Correlation .140
p-value .200
N 85
Hypothesis 4: Research Question 4 was what, if any, relationship is present
between the perception of the marketing manager’s intellectual stimulation leadership
style (IS) and job satisfaction (JS)? The corresponding null hypothesis (H40) was there
is no significant correlation between the perception of the marketing manager’s intellectual stimulation leadership style (IS) and job satisfaction (JS). The alternate
hypothesis (H4a) was there is a significant correlation between the perception of the
marketing manager’s intellectual stimulation leadership style (IS) and job satisfaction (JS).
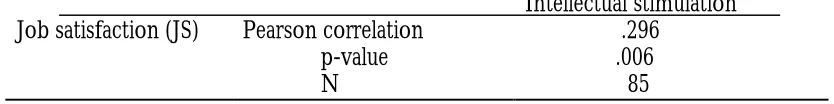
Table 11 shows the relevant Pearson product-moment correlation, which was used to address the hypothesis. Figure 4 is a scatter plot which graphically depicts the relationship between the job satisfaction score (y-axis) and the intellectual stimulation score (x-axis). The figure gives some evidence of a positive correlation between the two variables. Table 11 shows there was a statistically significant, moderately positive correlation between the job satisfaction score and the intellectual stimulation score, n= (85); r= .30; p=.006. Based on the sample evidence and analysis the null
hypothesis (H40) was rejected and it was concluded that there is strong evidence to
suggest that customer relationship officers who perceive the marketing manager to have a high level of intellectual stimulation leadership style, tend to be more satisfied with their job.
Table 11: Pearson’s Correlation Statistic for Job Satisfaction Versus Intellectual Stimulation
Intellectual stimulation
Job satisfaction (JS) Pearson correlation .296
p-value .006
Hypothesis 5: Research Question 5 was what, if any, relationship is present
between the perception of the marketing manager’s individualized consideration leadership style (IC) and job satisfaction (JS)? The corresponding null hypothesis
(H50) predicted that there is no significant correlation between the perception of the
marketing manager’s individualized consideration leadership style (IC) and job
satisfaction (JS). The alternate hypothesis (H5a) was there is a significant correlation
between the perception of the marketing manager’s individualized consideration leadership style (IC) and job satisfaction (JS).
Table 12 shows the relevant Pearson product-moment correlation, which was used to address the hypothesis. Figure 5 is a scatter plot which graphically depicts the relationship between the job satisfaction score (y-axis) and the individualized consideration score (x-axis). The figure gives some evidence of a positive correlation between the two variables. Table 12 shows there was a statistically significant, moderately strong positive correlation between the job satisfaction score and the individualized consideration score, n = (85); r = .22; p = .044. Based on the sample
size evidence and analysis the null hypothesis (H50) was rejected and it was concluded
that there is strong evidence to suggest that customer relationship officers who perceive the marketing manager to have a high level of individualized consideration leadership style, tend to be more satisfied with their job.
Table 12: Pearson’s Correlation Statistic for Job Satisfaction Versus Individualized Consideration
Individualized consideration
Job satisfaction (JS) Pearson correlation .219
p-value .044
N 85
Hypothesis 6: Research Question 6 was what, if any, relationship is present
between the perception of the marketing manager’s management by exception–active leadership style (MEA) and job satisfaction (JS)? The corresponding null hypothesis
(H60) predicted that there is no significant correlation between the perception of the
The alternate hypothesis (H6a) was there is a significant correlation between the perception of the marketing manager’s management by exception–active leadership style (MEA) and job satisfaction (JS). Cohen (1988) stated that Pearson correlation coefficients of r = .1, r = .3, and r = .5 are indicative of weak, moderate, and strong correlations between the variables respectively.
Table 13 shows the relevant Pearson product-moment correlation, which was used to address the hypothesis. Figure 6 is a scatter plot which graphically depicts the relationship between the job satisfaction score (y-axis) and the management by exception - active score (x-axis). The figure gives little evidence of a correlation between the two variables. Table 13 shows there was no statistically significant correlation between the job satisfaction score and the management by exception - active score, n= (85); r= .03; p= .77. Based on the sample evidence and analysis the
null hypothesis (H60) was not rejected and it was concluded that there is no evidence
to suggest there is a relationship between job satisfaction and the perceived management by exception - active leadership style of the marketing manager, among customer relationship officers.
Table 13: Pearson’s Correlation Statistic for Job Satisfaction Versus Management by Exception – Active
Management-by-exception (Active)
Job satisfaction (JS) Pearson correlation .032
p-value .771
N 85
Hypothesis 7: Research Question 7 was what, if any, relationship is present
between the perception of the marketing manager’s management by exception– passive leadership style (MEP) and job satisfaction (JS)? The corresponding null
hypothesis (H70) predicted that no significant correlation exists between the
perception of the marketing manager’s management by exception–passive leadership
style (MEP) and job satisfaction (JS). The alternate (H7a) was there is a significant
Table 14 shows the relevant Pearson product-moment correlation, which was used to address the hypothesis. Figure 7 is a scatter plot which graphically depicts the relationship between the job satisfaction score (y-axis) and the management by exception - passive score (x-axis). The figure gives little evidence of a correlation between the two variables. Table 15 shows there was no statistically significant correlation between the job satisfaction score and the management by exception - passive score, n= (85); r=.15; p=.18. Based on the sample evidence and analysis the
null hypothesis (H70) was not rejected and it was concluded that there is no evidence
to suggest there is a relationship between job manager, among customer relationship officers.
Table 14: Pearson’s Correlation Statistic for Job Satisfaction Versus Management by Exception – Passive
Management-by-exception (Passive) Job satisfaction
(JS)
Pearson correlation -.146
p-value .181
N 85
Hypothesis 8: Research Question 8 was what, if any, relationship is present
between the perception of the marketing manager’s contingent reward leadership style
(CR) and job satisfaction (JS)? The corresponding null hypothesis (H80) predicted
that there is no significant correlation between the perception of the marketing manager’s contingent reward leadership style (CR) and job satisfaction (JS). The
alternate hypothesis (H8a) was there is a significant correlation between the perception
of the marketing manager’s contingent reward leadership style (CR) and job satisfaction (JS). Cohen (1988) stated that Pearson correlation coefficients of r = .1, r = .3, and r = .5 are indicative of weak, moderate, and strong correlations between the variables respectively.
Based on the sample evidence and analysis the null hypothesis (H80) was rejected and it was concluded that there is strong evidence to suggest that customer relationship officers who perceive the marketing manager to have a high level of contingent reward leadership style, tend to be more satisfied with their job.
Table 15: Pearson’s Correlation Statistic for Job Satisfaction Versus Contingent Reward
Contingent reward
Job satisfaction (JS) Pearson correlation 226
p-value .037
N 85
Hypothesis 9: Research Question 9 was what, if any, relationship is present
between the perception of the marketing manager’s laissez-faire leadership style and
job satisfaction (JS)? The corresponding null hypothesis (H90) predicted that there is
no significant correlation between the perception of the marketing manager’s laissez-faire leadership style and job satisfaction (JS). The alternate hypothesis was there is a significant correlation between the perception of the marketing manager’s laissez-faire leadership style and job satisfaction (JS). Cohen (1988) stated that Pearson correlation coefficients of r = .1, r = .3, and r = .5 are indicative of weak, moderate, and strong correlations between the variables respectively.
Table 16 shows the relevant Pearson product-moment correlation, which was used to address the hypothesis. Figure 9 is a scatter plot which graphically depicts the relationship between the job satisfaction score (y-axis) and the laissez-faire score (x-axis). The figure gives little evidence of a correlation between the two variables. Table 16 shows there was no statistically significant correlation between the job satisfaction score and the laissez-faire score, n = (85); n = -.06; p =.56. Based on the sample
evidence and analysis, the null hypothesis (H90) was not rejected and it was concluded
Table 16: Pearson’s Correlation Statistic for Job Satisfaction Versus Laissez-Faire
Laissez-faire leadership Job
satisfaction (JS)
Pearson correlation -.064
p-value .563
N 85
5.1. Limitations
A major limitation of the study involved the survey of customer relationship officers only. The exclusion of operation staff which includes accounts, information technology, corporate services group, and contract staff who are more in number than customer relationship officers may have provided other perspectives that were peculiar to their role within the organization to strengthen the study. The low Cronbach’s alpha could be a threat to the validity of the study. Considering that the Cronbach’s alpha for idealized influence (behavior) and individualized consideration were below .70, the low reliability was not considered to be a major limitation of the study. However, the Cronbach’s alpha for the management-by-exception (active) score was lower and therefore the results for hypothesis 6 would be interpreted more cautiously.
6.1. Conclusion and Discussions
Overall, the study produced a mixed finding on the relationship between each of the leadership styles and the job satisfaction of the employees in a Nigerian bank. The concept of full-range leadership styles of transactional, transformational and laissez-faire is traceable to Burn’s (1978) concepts of the transformational-transactional paradigm, subsequent work by Bass (1985) and the attendant intellectual discussion that culminated into the full-range leadership model (Bass & Riggio, 2006; Judge & Piccolo, 2004). Due to the contributions of transformational and transactional leadership styles over time in promoting the effectiveness, job satisfaction, and performance of followers, Bass and Avolio developed an integrated leadership model called the full range of leadership (FRLM) which has become a reference point in the study of leadership (Duric, 2011). The following section presents interpretations of the results of the study with reference to the study’s research questions.
Research Question1 was what, if any, relationship exist between the perceptions of the marketing manager’s idealized influence attributed leadership style (IIA) and job satisfaction (JS)? Idealized influence attribute is one of the five behavior dimensions of transformational leadership style (Ho et al., 2009). Transformational leadership recognizes the importance of power and influence processes (Deluga, 1990).
In the study, the Pearson’s product-moment correlation coefficient suggests a positive correlation between the idealized influence attribute perception of the manager and customer relationship officer’s job satisfaction. The hypothesis testing supported the alternate hypothesis, which suggests that there is a positive relationship between the manager’s idealized influence attribute leadership style and customer relationship officer’s job satisfaction in the bank. The finding is consistent with the research conducted by Duric (2011) to examine leadership styles (LSF, TS, and TSF) among managers at different organizational levels in Slovenian Police organization and the relationships between leadership styles and outcomes criteria (effectiveness, satisfaction, and extra effort).
The study findings showed that there are more of transformational leadership styles than transactional and laissez-faire leadership styles demonstrated among Slovenian Police managers. Transformational leadership style behavior dimensions were expressed the most especially at higher organizational levels (Duric, 2011). Trust and respect were critical and central to idealized influence attribute leadership style of the managers.
Research Question 2 was what, if any, relationship is present between the perceptions of the marketing manager’s idealized influence behavior leadership style (IIB) and job satisfaction (JS)? Idealized influence behavior of the leader refers to the ability of the leader to walk the talk and demonstrate that the leader’s knowledge is beyond the ability to communicate the values of the organization (Kouzes & Posner, 2003). Several studies have demonstrated that idealized influence behavior leadership style of the manager will further promote trust, attract respect, and strengthen the subordinate believe in the status of the leader as a role model (Sosik & Jung, 2010). Idealized influence behavior is critical to the acquisition of new skills. Casida and Pinto-Zipp (2008) in a study on the leadership-organizational culture relationship in nursing units of acute hospitals noted that the idealized influence behavior of the leader was superior in promoting the acquisition of new skills, mentoring and coaching.
The hypothesis testing supported the null hypothesis, which suggests that there is a negative relationship between the manager’s idealized influence behavior leadership style and customer relationship officer’s job satisfaction in the bank. This perhaps accounted in part for the low job satisfaction and performance of employees in Nigerian banks. Leadership appears not to be hands on beyond giving directives, especially since new products and services have been introduced which are technical in nature and required mentoring and coaching (Casida & Pinto-Zipp, 2008; Central Bank of Nigeria, 2006).
Research Question 3 was what, if any, relationship is present between the perceptions of the marketing manager’s inspirational motivation leadership style (IM) and job satisfaction (JS)? Transformational leaders behave in ways that motivate and inspire those around them by providing meaning and challenge to the followers’ work. Team spirit, enthusiasm and optimism are highly encouraged.
Bass and Riggio (2006) noted that leaders cultivate a conducive working environment by creating clearly communicated expectations that followers want to meet and also demonstrate commitment to goals and the shared vision. Transformational leadership styles through the use of inspiration energize followers to exert extra effort in challenging situations as well as engage in collective action with the attendant team synergy (Sosik & Jung, 2010). There is sufficient evidence from existing studies to show that inspirational motivation dimension of transformational leadership style impacts positively on employee job satisfaction (Deluga, 1990).
Perhaps the level of malfeasance and abuse of privileges among executive management may have demoralized the workers and affected trust, commitment, and performance (Sosik & Jung, 2010).
Research Question 4 was what, if any, relationship is present between the perception of the marketing manager’s intellectual stimulation leadership style (IS) and job satisfaction (JS)? Intellectual stimulation as a behavior dimension of transformational leadership style motivates subordinates effort to innovate, and create by questioning the status quo and exploring their full potentials (Maital & Seshadri, 2008). Followers are encouraged to employ new strategies or approaches in solving old task with sufficient guidance and support from the supervisors and peers (Boyton & Fisher, 2005; Judge & Piccolo, 2004). According to Sosik and Jung (2010) intellectual stimulation leadership style values followers’ rationality and intellect and are rewarded or recognized.
In the study, the Pearson’s product-moment correlation coefficient suggests a positive correlation between the intellectual stimulation perception of the manager and customer relationship officer’s job satisfaction. The hypothesis testing supported the alternate hypothesis, which suggests that there is a relationship between the manager’s intellectual stimulation leadership style and customer relationship officer’s job satisfaction in the bank. The outcome of the study complemented the development in the Nigerian banking industry post recapitalization where new products and services that were technology driven were introduced and which challenged the creative abilities of the employees to innovate (Bass & Riggio, 2006). Given the enormous investment deployed in technology to support the products and services, so much support and attention was given to optimize returns and performance.
In the study, the Pearson’s product-moment correlation coefficient suggests a positive moderate correlation between the individual consideration perception of the manager and customer relationship officer’s job satisfaction. The hypothesis testing supported the alternate hypothesis, which suggests that there is a relationship between the manager’s individual consideration leadership style and customer relationship officer’s job satisfaction in the bank. In practice, the rate of understanding and appreciation of new skills differs with individuals. Given the rate at which new products and services were introduced post recapitalization in 2005 in the Nigerian banking industry the emphasis on individualized consideration was inevitable to support the weak links in the chain.
Research Question 6 was what, if any, relationship is present between the perception of the marketing manager’s management by exception–active leadership style (MBE-A) and job satisfaction (JS)? Management by exception-active (MBE-A) leadership style refers to the extent to which the leader takes corrective action on the activities of the subordinate to ensure compliance. The social learning component derives from the interaction of the employer-employee relationship, which mutually agrees on deliverables and timelines for execution (Avolio, 1999).
The result from Pearson’s product-moment correlation analysis suggests that there was no statistically significant correlation between the job satisfaction score and the management by exception – active leadership style of the manager. The hypothesis testing supported the null hypothesis, which suggests that there is no relationship between the manager’s management by exception-active leadership style and customer relationship officer’s job satisfaction in the bank. Despite the results, studies have shown that management-by-exception-active leadership style is critical in large and mature organizations to ensure performance and control reward and recognition systems. Avolio, Bass, and Jung (1999) noted that, management-by-exception-active leaders are enforcers who follow rules to avoid mistakes.
Some other scholars describe management-by-exception-passive as a chaotic leadership style and worse than absence of leadership because lukewarm intervention breeds discord among team members or work group. Comparatively, Howell and Avolio (1993) noted that the difference between MBE-active and MBE-passive lies in the timing of the leader’s intervention. Active leaders monitor follower behavior, foresee problems, and take remedial actions before the behavior creates serious challenges.
In the study, the Pearson’s product-moment correlation coefficient suggests a negative correlation between the management-by-exception-passive perception of the manager and customer relationship officer’s job satisfaction. The hypothesis testing supported the null hypothesis, which suggests that there is no relationship between the manager’s management-by-exception-passive leadership style and customer relationship officer’s job satisfaction in the bank. Passive leaders’ abdication of supervisory control during the process of execution negatively impacts performance and may only be suitable when supervising or leading a team of experts. Given the level of resources deployed and the predominant age of experience of the employees (70%) within 0-5 years as shown in Table 5, management by-exception-passive was not an option for consideration.
Research Question 8 was what, if any, relationship is present between the perception of the marketing manager’s contingent reward leadership style (CR) and job satisfaction (JS)? Contingent reward (CR), as a medium of exchange between leader and subordinates, presumes an understanding of the job description and requirements for reaching a mutually agreed-upon compensation. Contingent reward is a give-and-take situation. The employee and the leader exercise considerable influence and power in the bargaining process to reach mutual agreement on the conditions of exchange. In a study conducted by Ho et al., (2009) in Malaysia involving 303 insurance salespersons from four major insurance companies in Malaysia to determine which leadership styles correlated positively with employee satisfaction, contingent reward behavior accounted for the highest score on the scale.
The hypothesis testing supported the alternate hypothesis, which suggests that there is a positive relationship between the manager’s contingent reward leadership style and customer relationship officer’s job satisfaction in the bank. According to Ho et al. (2009), transactional leadership style emphasize reciprocal relationship between leaders and followers
Research Question 9 was what, if any, relationship is present between the perception of the marketing manager’s laissez-faire leadership style and job satisfaction (JS)? Laissez-faire leadership style (LFS) is the absence or avoidance of leadership. LSF is characterized by inactivity, passivity and indolence. Bass and Riggio (2006) described laissez-faire leadership style as lukewarm, ineffective, procrastinating and nonchalant.
In the study, the Pearson’s product-moment correlation coefficient suggests a negative correlation between the laissez-faire perception of the manager and customer relationship officer’s job satisfaction. The hypothesis testing supported the null hypothesis, which suggests that there is no relationship between the manager’s laissez-faire leadership style and customer relationship officer’s job satisfaction in the bank. The finding is in consonance with existing studies which associated laissez-faire leadership style with the lowest levels of employee satisfaction and performance (Sosik & Jung, 2010). Although the Nigerian banking industry’s performance is suboptimal, the board and management have deliverables and are accountable to the shareholders. Laissez-faire leadership style cannot be contemplated because of the pressure to deliver as evident in the falsification of income by some of the banks to meet shareholders expectation (Central Bank of Nigeria, 2009).
6.2. Implications for Leadership
The seminal work on the transformational-transactional leadership paradigm by Burn (1978) and Bass (1985) gave impetus to the full-range leadership theory FRLT (Sosik & Jung, 2010).
Several studies have alluded to the attendant positive outcome of effectiveness, job satisfaction, and performance in the application of the full-range leadership styles of transactional and transformational leadership styles (Casida & Pinto-Zipp 2008; Ho et al., 2009). The key behavior dimensions of idealized influence (attribute and behavior), inspirational motivation, intellectual stimulation, individualized consideration, management-by-exception-active, and contingent reward have been found by scholars and practitioners to be effective and drive performance (Sosik & Jung, 2010; Zheng & Ricardo, 2009). Findings of this study showed that idealized influence attribute, intellectual stimulation, individualized consideration, and contingent reward behavior dimensions of transformational and transactional leadership styles have positive correlation with employee job satisfaction and corroborated existing studies in a related industry (Ho et al., 2009). Furthermore, the negative correlation between the behavior dimensions of management-by-exception-passive and laissez-faire on employee job satisfaction recorded in the study is consistent with existing studies by scholars and practitioners alike (Barbuto, 2005).
On the contrary, results from the study showed that idealized influence behavior, inspirational motivation, and management-by-exception-active perception of the managers are not correlated with the employee job satisfaction. Despite the negative outcome of these behavior dimensions existing studies alluded to the positive outcome of effectiveness, and employee job satisfaction and performance elsewhere (Bryman, 1998; Deluga, 1990; Sosik & Jung, 2010). A key implication of the study for leadership is to assess the various leadership behavior dimensions operational in the organization and identify the dominant behaviors, articulate appropriate strategies that will strengthen them to support employee job satisfaction and performance.
Job satisfaction may be enhanced when employees are equitably and fairly rewarded and assessed based on well communicated and clearly spelled out deliverables, with a leadership that encourages creativity in employees (Garcia-Morales, Matias-Reche, & Hurtado-Torres, 2008).
Trust and mutual respect will breed commitment and inspire the employee to go the extra mile (Duric, 2011). Several factors including fraud, insider dealing by managers and executive management may have been responsible for a negative correlation between the inspirational motivation perception of the managers and employee job satisfaction (Central Bank of Nigeria, 2009). These behavior dimensions are critical and should be addressed.
After all, organizational performance is a function of the operating environment, and an amenable leadership style that supports the nature of business of the organization (Boynton & Fisher, 2005; Scott & Davis, 2007). Leaders can draw on the results of the study to develop strategies that will be central to the organizational philosophy to mitigate current leadership challenges, improve on employee job satisfaction and optimize performance. In crafting and developing policies, leaders may use information from the study to retool the system, and create structures to support the policies which will engender employee satisfaction, commitment and improved performance within the organization.
6.3. Recommendations
A major recommendation from the study is that organizations should assess the type of leadership styles in use in the organization and ascertain the dominant behavior dimensions which can impact positively on employee job satisfaction. Previous studies have justified the combination of transactional and transformational leadership style in managing the workforce effectively. According to Casida and Pinto-Zipp, (2008) and Ho et al. (2009) transactional and transformational leadership styles engender performance by keeping to an agreed target and encouraging acquisition of skills relevant to the set goal. The knowledge of the current leadership practices in the organization is critical for the application of the findings from the study.
Without the knowledge of the types and dimensions of leadership styles in existence, application and reinforcement of the findings from the study would be a challenge to implement. Although part of the results from the study showed a positive correlation between the leadership dimensions of idealized influence attribute, intellectual stimulation, individualized consideration, and contingent reward, on balance, the relationship appeared to be between weak and moderate. An important recommendation is for organizations to identify activities and corresponding actions that will strengthen the identified areas (all the behavior dimensions apart from management-by-exception-passive and laissez-faire leadership styles), and promote employee job satisfaction and performance.
Another recommendation is that organizations should encourage effective participation of leadership in the course of the job by employees to demonstrate support and practical knowledge of the job. Employees’ trust and commitment are strengthened as they are convinced of the involvement and total understanding of the job by the leaders. By walking the talk or do what the leaders say they will do, leaders are able to conceive improvements on the processes which will lead to innovation and new ways of doing old things.
Given the size (balance sheet and branch network) and geographical spread of most Nigerian banks, a more flexible organizational structure is recommended to support devolution of power and authority for effectiveness (Scott & Davis, 2007).
Acknowledgement
I owe a debt of gratitude to several individuals. First, I want to give special thanks to my mentor, Dr. Ogwo J. Umeh, for guiding me relentlessly and committedly towards the completion of this study. You are truly exceptional. Many warm thanks go to my dissertation committee members, Dr. Larry Ellis and Dr. Todd Weber, for their insights, ideas, critical assessments, and support to completing my doctoral dissertation.
References
Access Bank Nigeria Plc. (2010). Annual reports and accounts. Retrieved from http://www.accessbankplc.com
Afribank Nigeria Plc. (2010). Annual reports and accounts. Retrieved from http // www .afribank.com
Aminu, A. (2009, March 28). Nigeria: Standard & Poor's downgrades country's credit rating. Retrieved from http://allafrica.com/stories/200903290009.html
Anderson, W.D., & Patterson, M.L. (2008). Effects of social value orientations on fairness judgement. Journal of Social Psychology, 148 (2), 223-245
Avolio, B. J. (1999). Full leadership development: Building the vital forces in organizations. Thousand Oaks, CA: Sage.
Avolio, B. J., & Bass, B. M. (2002). Developing potential across a full range of. leadership: Cases on transactional and transformational leadership. Mahwah, NJ: Erlbaum. Avolio, B. J., & Bass, B. M. (2004). Multifactor Leadership Questionnaire: Manual and
sampler set. Redwood City, CA: Mind Garden.
Avolio, B. J., Bass, B. M., & Jung, D. I. (1999). Re-examining the components of transformational and transactional leadership using the multifactor leadership questionnaire. Journal of Organizational and Occupational Psychology, 72, 441-462. doi:10.1348/096317999166789
Balzer, W. K., Kihm, J. A., Smith, P. C., Irwin, J. L., Bachiochi, P. D., Robie, C., . . . Parra, L. F. (2000). User's manual for the Job Descriptive Index (JDI, 1997 version) and the Job in General scales. Bowling Green, OH: Bowling Green State University.
Bank PHB. (2010). Annual reports and accounts. Retrieved from http: // www. bank ph b.com
Bass, B. M. (1985). Leadership and performance beyond expectations. New York, NY: Free Press.
Bass, B. M., & Avolio, B. J. (1990). Transformational leadership development: Manual for the Multifactor Leadership Questionnaire. Palo Alto, CA: Consulting Psychologists Press.
Bass, B. M., & Avolio, B. J. (1994). Transformational leadership and organizational culture. International Journal of Public Administration, 17(3-4), 541-554.
Bass, B. M., & Riggio, R. E. (2006). Transformational leadership (2nd ed.). Mahwah, NJ: Erlbaum.
Blass, F. R., & Ferris, G. R. (2007). Leader reputation: The role of mentoring, political skill, contextual learning, and adaptation. Human Resource Management, 46(1), 5-19. doi:10.1002/hrm.20142
Boynton, A., & Fisher, B. (2005). Virtuoso teams: Lessons from teams that changed their worlds. Harlow, England: Prentice Hall.
Bryman, A. (1992). Charisma and leadership in organizations. London: Sage. Burns, J. M. (1978). Leadership. New York, NY: Harper and Row.
Casey, L.M., Oei, T.P.S., Melville, K.M., Bouke, E. and NewCombe, P.A. (2008). Mea-suring self-efficacy in gambling: The gambling refusal self-efficacy questionna-ire. Journal of Gambling Studies 24(2), 229-246
Casida, J., & Pinto-Zipp, G. (2008). Leadership-organizational culture relationship in nursing units of acute hospitals. Nursing Economics, 28(1), 7-15. Retrieved from http://www.ncbi.nlm.nih.gov/pubmed/18389837
Central Bank of Nigeria. (2001). Banking Supervision Annual Report, 64-66. Central Bank of Nigeria. (2004). Banking Sector Reforms, 1(03), 1-161. Central Bank of Nigeria. (2005). Statistical Bulletin, 16, 45-56.
Central Bank of Nigeria. (2006). [Press conference by the Governor of the Central Bank of Nigeria]. The outcome of the banking sector recapitalization and the way forward for undercapitalized banks, 1-6.
Central Bank of Nigeria. (2008). Banking Supervision Annual Report, 11-74.
Central Bank of Nigeria. (2009). Special Examination of Banks’ Reports, 39(9), 1-67. Retrieved from http://www.cenbank.org/Out/publications/pressRelease/GOV /2009/pressstatmt%2002-10-2009.pdf
Central Bank of Nigeria. (2010). Banks Annual Report, 39(6), 2-29.
Chossudovsky, M. (2008). Global financial meltdown. Retrieved from http: //www. Glo balresearch.ca
Cohen, J. (1988). Statistical power analysis for the behavioral sciences (2nd ed.) Lawrence
Erlbaum Associates
Cooper, D. R., & Schindler, P. S. (2004). Business research methods (4th ed). New York, NY: McGraw-Hill.
Creswell, J. W. (2003). Research design: Qualitative, quantitative, and mixed methods approaches (2nd ed.). Thousand Oaks, CA: Sage.
Creswell, J. W. (2005). Educational research: Planning, conducting, and evaluating quantitative and qualitative research (2nd ed.). Thousand Oaks, CA: Sage.
Deluga, R. J. (1990). The effects of transformational, transactional, and laissez-faire leadership characteristics on subordinate influencing behavior. Basic and Applied Social Psychology, 11, 191-203. doi:10.1207/s15324834basp1102_6
Densten, I. L. (2003). Senior police leadership: Does rank matter? Policing: An Interna- ational Journal of Police Strategies & Management, 26(3), 400-418.
Diamond Bank Plc. (2010). Annual reports and accounts. Retrieved from http:// www. diamondbank.com
Doane, D., P. and Seward, L. E (2011). Applied statistics in business & economics. (3rded)
McGraw-Hill
Duric, D. (2011). Transformational leadership styles in Slovenian Police. Journal of Criminal Justice and Security, 13(2), 188-207.
Fidelity Bank Plc. (2010). Annual reports and accounts. Retrieved from http://www. Fide litybankplc.com
FinBank Plc. (2010). Annual reports and accounts. Retrieved from http://www. Finbank . com.ng
First Bank Nigeria Plc. (2010). Financial documents. Retrieved from http://www. firstb anknigeria.com
First City Monumental Bank Plc. (2010). Financial statements. Retrieved from http:// w ww.firstcitygroup.com
First Inland Bank. (2007). Personnel policy for executive management, 2-6. Retrieved from http://finbank.com.ng/
Garcia-Morales, V.J., Matias-Reche, F., & Hurtado-Torres, N. (2008). Influence of transformational leadership on organizational innovation and performance depending on the level of organizational learning in the pharmaceutical sector. Journal of Organizational Change Management, 21(2), 188-212
Greenspan, A. (2008). The age of turbulence. New York, NY: Penguin Books.
Guaranty Trust Bank Plc. (2010) Annual reports and accounts. Retrieved from http:// ww w.gtbplc.com
Herzberg, F. (1996). The hygiene-motivation theory. Retrieved from
http:/www.thefreelibrary.com/Frederick+Herzberg+thehygiene-motivationtheory Herzberg, F., Mausner, B., & Snyderman, B. B. (1959). The motivation to work. New York,
NY: Wiley.
Ho, J. S. Y., Fie, D. Y. G., Ching, P. W., & Ooi, K. B. (2009). Relationship between the full-range leadership and insurance salesperson's job satisfaction. International Journal of Business and Management Science, 2(1), 43-61.
Howell, J. M., & Avolio, B. J. (1993). Transformational leadership, transactional
leadership, locus of control, and support for innovation: Key predictors of cons-olidated business-unit performance. Journal of Applied Psychology, 78(6), 8 91-902 Intercontinental Bank Plc. (2010). Financial statements. Retrieved from http://www. in ter
continentalbankplc.com
Judge, T. A., & Piccolo, R. F. (2004). Transformational and transactional leadership: A meta analysis test of their relative validity. Journal of Applied Psychology, 89(5), 755-768. doi:10.1037/0021-9010.89.5.755