ISSN (E): 2305-9249 ISSN (P): 2305-9494
Publisher: Centre of Excellence for Scientific & Research Journalism, COES&RJ LLC. Online Publication Date: 1st October 2019
Online Issue: Volume 8, Number 4, October 2019 https://doi.org/10.25255/jss.2019.8.4.544.557
Improving the Estimation Accuracy Based on Wavelet Transform
Abdallah Abu Abdallah1, Mousa Mohammad Abdullah Saleh2, Sadam Al Wadi3 and Firas Al rawashdeh4
School of Administration and Finance, The University of Jordan, Jordan [email protected]
Department of Financial and Administrative Sciences, Al-Balqa Applied University, Jordan. [email protected]
Department of Risk Management and Insurance. The University of Jordan, Jordan [email protected]
Department of Risk Management and Insurance. The University of Jordan, Jordan [email protected]
Abstract :
This article aims to improving and drawing inferences about population characteristic estimation, some of mathematical methods were used in content of stock market data are collected from Amman stock exchange (ASE) using three methods; point, interval estimation and Wavelet transform (WT) combined with interval estimation. Point estimate can be ambiguous because it may or may not be close to the number actuality estimated. Themethodology is to compare between the point and interval estimations then the estimation has improved by combining WT with the interval estimation in order to reduce the error. The results show that (WT) with interval estimation is the best method, (SPSS) and mat lab 2010a have used in this study.
Keywords:
Confidence interval, point estimations, interval estimations, Wavelet transform, Amman stock exchange
Citation:
Abu Abdallah, Abdullah; Saleh, Mousa Mohammad Abdullah; Al-Wadi, Sadam; Al-Rawashdeh, Feras (2019); Improving the Estimation Accuracy Based on Wavelet Transform; Journal of Social Sciences (COES&RJ-JSS), Vol.8, No.4, pp:544-557; https://doi.org/10.25255/jss.2019.8.4.544.557.
1- Introduction
Inferential statistics concerned with drawing correct inferences about population characteristic (called parameter) based on sample statistics; drawn a sample from a population ; Calculated sample statistics on variable(X); and then attempt to make inference about variable(X) in the population from witch the sample drawn; Introduction to probability & statistical (Mendenhall et. al., 2012).
Financial data sample is used to understand the performance and characteristics of the entire population. For example, all of the familiar stock market averages are samples designed to represent the broader stock market and indicate its performance return. For the domestic publicly-traded stock market, populated with at least 10,000 or more companies, the Dow Jones Industrial Average (DJIA) has just 30 representatives; the S&P 500 has 500. Yet these samples are taken as valid indicators of the broader population. It's important to understand the mechanics of sampling and estimating, particularly as they apply to financial variables, and have the insight to analysis the quality of research derived from sampling efforts. Therefore, the estimation accuracy and processes become a hot topics nowadays. Consequently, in this article will be improved in content of stock market data. Therefore. The novel technique in this article is in improving the estimation accuracy by combining WT with the interval estimation by reducing the bound of error.
With regard to all those literature reviews, this study attempts to employ the proposed method to the daily stock market data from ASE. Three selected estimation models are used in the proposed method comparison to assess its performance. Experimental results show that the proposed method which is interval estimation with WT is superior to existing method in terms of some accuracy estimation error measure. Section 2 introduces the literature reviews of necessary used term. In section 3 the dataset will be presented with its statistical analysis. Whereas methods are used in this paper will be presented in section 4. Section 5 shows the results and discussion. Finally, in section 6 the conclusion will be presented.
2- Literature Review
obtained when both the sample size and the number of curves go to infinity. The effects of the separateexplanations are argued. Compare method with both functional regression methods and other wavelet grounded sparse regression approaches on together simulated data and four real data sets, with the cases of single and multiple predictive curves. The results indicate that sparse wavelet regression methods are enhanced in removing local features and method in this article has good predictive performances in all scenarios.
(Yana, et al, 2006) integrates identification method to consider the uncertainty effect on modal parameters for output-only system. The method is based on the time–frequency characteristics of the WT and the capabilities of the bootstrap distribution in statistical estimation. For the WT based identification method, the important issues related to identification accuracy such as modal separation, end-effect, associated with the parameter selection of wavelet function based on Shannon entropy, are given detailed investigations. (Donald, 2016) discuss the roots of the Allan variance trace back 50 years before to two seminal papers, one by (Allan, 1966) and the other by (Barnes, 1966). Since then, the Allan variance has played an important part in the description of high-performance time and occurrence standards. WT first rose in the initial 1980s in the geophysical literature, and the isolated WT developed projecting in the dawn 1980s in the signal processing literature. (Flandrin, 1992) briefly documented a connection between the Allan variance and WT based upon the Haar WT. (Percival and Guttorp, 1994) well-known that one general estimator of the Allan variance the maximal connection estimator can be interpreted in terms of a version of the DWT now widely referred to as themaximal overlap DWT (MODWT).
As critically review this researchis differentfrom others because theresearchers gathered financial data from website of(ASE) about two stock market samples randomly in order to draw right inferences about population characteristic (mean, variance, stander deviation) throughcomputing point estimation andconfidence intervals usingsuitable formula then computing and comparing the result of one point estimation and confidence interval. Finally the best method will be combined with WT in order to improve the estimation accuracy.
3- Dataset
The researchergatheredhistorical time series data for the year 2016 from ASE about two sample banks (Bank ARBK Jordanian, Bank Jordan Commercial) the data randomly chosen to drawing correct inferences about population characteristic( mean, variance, stander deviation) for more details about the
dataset refer to the following links
behavior of the data, whereas the table will show the statistical analysis of the data used.
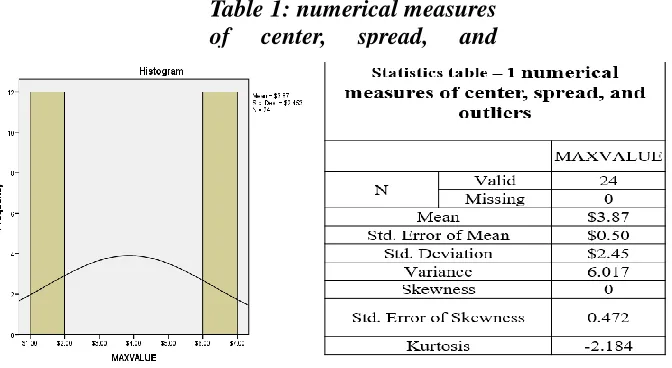
Some notes can be summarize about Fig. 1 and Table 1as:
1- The skewness as the Table 1 the skew approximately (0.00) that mean the data distribution such as a normal distribution.
2- Kurtosis tells how tall and sharp the central highest.
3- Many statistics inferences require that a distribution be normal or nearly normal, a normal distribution has skewness and extra kurtosis of 0, so if your distribution is close to those values then it is probably close to normal as in table- 1. That mean the dataset is normal distribution, and can predicting the max or min rang for value of stocks between 6.2132 to 6.3285$ Table 3 with 95% confidence interval for Mean (Westfall, et. al., 2014).
4- Mathematical Models 4.1. Point Estimation.
The 95% margin of error estimated as ( ) where S: standard deviation and n: sample size.
4.2. IntervalEstimation
One Population Mean can be estimated as for more details refer
to ( Mendenhall, et al. 2012)
Table 1: numerical measures
of
center,
spread,
and
outliers
While in this study the independent sample for two population mean will be
considered using the formula:
Where is :
Table 2. Sample information
sample-1 sample-2 Mean
Variance
Sample size n 1 n 2
z- value z- value
second interval estimate (confidence interval) provided an estimation range where in which true population parameter might fall in statistics, interval estimation is the habit of sample data to compute an interval of likely values of an unidentified population parameter, in difference to point estimation, which is a single number. (JerzyNeyman, 1937) investigates interval estimation as separate from point estimation. In doing so, he known that then-new work repeatingoutcomes in the form of an estimate plus-or-minus a standard deviation directed that interval estimation was really the problem statisticians really had in mind. After the authors have identified the interval estimation then some Scientific problems associated with interval estimation may be summarized as follows:
1. When interval estimates are informed, they should have a commonly believedclarification in the technical community and more broadly. In this regard, credible intervals are held to be most readily assumed by the general public. Interval estimates derived from fuzzy logic have much more request-specific senses.
2. For usuallyhappeningstates there should be sets of standard events that can be used, subject to the examination and soundness of any vitalexpectations. This relates for both confidence intervals and credible intervals.
3. For more new situations there should be leadership on how interval estimates can be formulated. In this regard confidence intervals and credible intervals have a related standing but there are alterations.
4. Credible intervals can readily agreement with previous information, while confidence intervals cannot.
Report No. 155) , Therefore, in the nest subsection the WT equation will be presented.
4.3. Wavelet Transform
Previous studies have used statistics, technical analysis, fundamental analysis, and linear regression to predict market direction [16]. However, price forecasting is generally conducted using technical analysis or fundamental analysis. Technical analysis concentrates on market action, while fundamental analysis concentrates on the forces of supply and demand that drive price movements. The basic assumption of this study is supported by studies of the insurance time series. To study the relations among the insurance time-series variables, this work presents a hybrid method that integrates a wavelet and the ARIMA based forecasting scheme. Fig. 1 shows the main procedures of this approach. Wavelet theory is applied for data preprocessing, since the representation of a wavelet can deal with the non-stationarity involved in the economic and financial time series [26]. The key property of wavelets for economic analysis is decomposition by time scale. Economic and financial systems contain variables that operate on various time scales simultaneously; thus, the relations between variables may differ across time scales. One of the benefits of the wavelet approach is that it is flexible in handling highly irregular data series [24]. This study applies the orthogonal wavelet transform as the main wavelet transform tool. A wavelet not only decomposes the data inters of times and frequency, but also significantly reduces the processing time. Let n denote the time series size, then the wavelet decomposition used in this study can be determined in O (n) time [28]. The following framework will be summarized the research methodology for this article:
Wavelets theory is based on Fourier analysis, which represents any function as the sum of the sine and cosine functions. A wavelet is simply a function of time t that obeys a basic rule, known as the wavelet admissibility condition [17]:
0
( )f
C df f
(1)Where .
( )t r transform and a function of frequency f ,is the Fourie
( )f ߰The wavelet transform (WT) is a mathematical tool that can be applied to numerous applications, such as image analysis and signal processing. It was introduced to solve problems associated with the Fourier transform as they occur. This occurrence can take place when dealing with nonstationary signals, or when dealing with signals that are localized in time, space, or frequency. Depending on the normalization rules, there are two types of wavelets within a given function/family. Father wavelets describe the smooth and low-frequency parts of a signal, and mother wavelets describe the detailed and high-frequency components. In the following equations, (2a) represents the father wavelet and (2b) represents the mother wavelet, with j=1... J in the J-level wavelet decomposition: [14]
/2 /2
,
2
(
2
/ 2 )
,
2
(
2
/ 2 )
j j j
j j j
j k
t
k
j k
t
k
(2)Where J denotes the maximum scale sustainable by the number of data points and the two types of wavelets stated above, namely father wavelets and mother wavelets, and satisfies:
( )t dt 1 and ( )t dt 0
(3)Time series data, i.e., function f(t), is an input represented by wavelet analysis, and can be built up as a sequence of projections onto father and mother wavelets indexed by both {k}, k = {0, 1, 2,. . .} and by{S}=2j, {j=1,2,3,. . .J}. Analyzing real discretely sampled data requires creating a lattice for making calculations. Mathematically, it is convenient to use a dyadic expansion, as shown in equation (3). The expansion coefficients are given by the projections:
, , ( ) , , , ( ) ,
j k j k j k j k
S
f t dt d
f t dt (4)The orthogonal wavelet series approximation to f (t) is defined by:
( )
,
, ( )
,
, ( )
1,
1, ( ) ...
1, 1, ( )
F t
Sj k j k t
dj k j k t
dj
k j
k t
d k
k t
(5)( ) , , ( )
( ) , , ( )
Sj t Sj k j k t
Dj t dj k j k t
(6)The WT is used to calculate therespectively? The smooth coefficients dives the most important features of the data set and the details coefficients are used to detect the main features in the dataset.
When the data pattern is very rough, the wavelet process is repeatedly applied. The aim of preprocessing is to minimize the Root Mean Squared Error (RMSE) between the signal before and after transformation. The noise in the original data can thus be removed. Importantly, the adaptive noise in the training pattern may reduce the risk of over fitting in training phase. Thus, we adopt WT twice for the preprocessing of training data in this study.
5- Results and Discussion
The result of comparing manually and computer software (s.p.s.s) between point estimation and Confidence intervals (C. I) estimation the researcher found that the point estimation give information about the population not correct and mostly give you signal number WhileConfidence intervals representation more exact about population parameter characteristics
Point estimation.
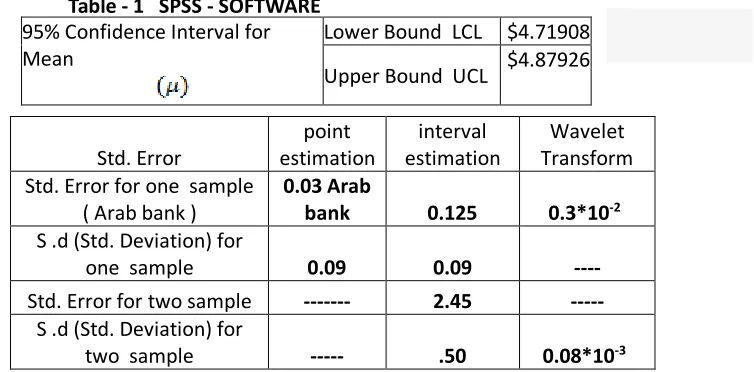
The 95% margin of error estimated as ( ) According with table- 1
the point estimation for Arabbank (max value) is:
1.645 * ( ) = (- .516 , + .516) hence the 95% confidence interval
for is from (-0. 516 to 0.516) $ per share.
The researcher generate formula to extract two values; the lower confidence limit (LCL) and the upper confidence limit (UCL).
Depended on table – 1, and take each sample independently ARBK BANK with (C.I) = .95
6.2708
S = 09070 n = 12 month
If you compare the result one point (- .516 to .516) and confidence interval (6.2132 to 6.3285) you note the result in the and confidence interval is more accuracy from one point and take widely rang and know more about population characteristic, Note: when used law z- table or law t – table the results is similar.
sample independent
According in table – 1 the researcher extract C. I (6.2708 - 1.4717) 1.645 * (
) = (4.71908, 4.87926) Hence, the 95% confidence interval for is from 4. 71908 to 4.87926 $ per share.
Std. Error
point estimation
interval estimation
Wavelet Transform Std. Error for one sample
( Arab bank )
0.03 Arab
bank 0.125 0.3*10-2 S .d (Std. Deviation) for
one sample 0.09 0.09 ----
Std. Error for two sample --- 2.45 --- S .d (Std. Deviation) for
two sample --- .50 0.08*10-3
Conclusion
In this article has discussed the point and interval estimations in more details in content of stock market data by drawing correct inferences about population characteristic based on point estimation and confidence intervals estimation. In doing this, population characteristic (mean, variance, stander deviation) using interval confidence is more accuracy thane point estimation. After the researchers have approve this results then a Novel contribution has approved also by improving the forecasting accuracy through combining the WT with
From Table - 1 SPSS - SOFTWARE
95% Confidence Interval for Mean Lower Bound LCL $6.2132 Upper Bound UCL $6.3285
Table - 1 SPSS - SOFTWARE 95% Confidence Interval for Mean
References
1. Raéf&Bahrini, 2017. Efficiency Analysis of Islamic Banks in the Middle East and North Africa Region A Bootstrap (DEA) Approach
2. Lai & hang, 2017. Standardized Parameters in Misspecified Structural Equation Models: Empirical Performance in Point Estimates, Standard Errors, and Confidence Intervals Structural Equation Modeling, 24 (4), pages 571-584.
3. Filimonov, et al, 2017. Modified profile likelihood inference and interval forecast of the burst of financial bubbles Quantitative Finance, 17 (8), pages 1167-1186.
4. Sangnawakij & Niwitpong, 2017. Confidence intervals for coefficients of variation in two-parameter exponential distributions Communications in Statistics: Simulation and Computation, pages 1-13.
5. Jinnah & Zhao, 2015. Empirical likelihood inference for the bivariate survival function under univariate censoring (2017) Communications in Statistics: Simulation and Computation, 46 (6), pages 4348-4355.
6. Helton, et al, 2017. Birnbaum–Saunders autoregressive conditional duration models applied to high-frequency financial data.
7. Rada & Claudia, 2009. Comparing point and interval estimates in the bivariate t-copula model with application to financial data.
8. Bruzda, 2015. On simple wavelet estimators of random signals and their small-sample properties journal of statistical computation and simulation Volume: 85 Issue: 14 Pages 2771-2792.
9. RuiyanLuo&XinQi, 2015. Sparse wavelet regression with multiple predictive curves, journal of multivariate analysis Volume: 134 Pages: 33-49.
10. William Mendenhall, et al. Introduction to probability & statistical – mendenhall beaver edition 14th.
11. Jerzy Neyman, 1894 – 1981. Technical Report No. 155.
13. Refenes, et al, 1994. Stock performance modeling using neural networks: a comparative study with regression models pages 375–388.
14. Yoo, et al, 1994. A comparison of discriminate analysis versus artificial neural networks, Journal of the Operations Research Society pages 51–60.
15. Abu-Mostafa & Atiya, 1996. Introduction to financial forecasting, Applied Intelligence.
16. Zhang. et al, 2002. Granular neural Web agents for stock prediction, Soft Computing oral pages 406–413.
17. Parasuraman & Elshorbagy, 2005. Wavelet networks: an alternative to classical neural networks, IEEE International Joint Conference on Neural Networks pages 2674–2679.
18. Marmer, 2008. Nonlinearity, no stationarity, and spurious forecasts, Journal of Econometrics pages 1–27.
19. Engle, 2001. GARCH101: the use of ARCH/GARCH models in applied econometrics, The Journal of Economic Perspectives pages 157–168.
20. Chen, 1996. Forecasting enrollments based on fuzzy time-series, Fuzzy Sets Systems pages 11–319.
21. Cohen, et al, 1993. Wavelets on the interval and fast wavelet transform, Applied and Computational Harmonic pages 54–81.
22. Ramsey & Zhang, 1997. The analysis of foreign exchange data using wave form dictionaries, Journal of Empirical Finance pages 341–372.
23. Rawashdi, et al, 2015. Wavelet methods in forecasting for insurance companies listed in Amman stock exchange. European Journal of Economics, finance and administrative sciences 82, 82 pages 54-60.
24. Popoola & Ahmad, 2006. Testing the suitability of wavelet preprocessing for TSK fuzzy models, in: Proceeding of FUZZ-IEEE: International Conference Fuzzy System Network pages 1305–1309.
26. Ramsey, 1999. The contribution of wavelets to the analysis of economic and financial data, Philosophical Transactions of the Royal Society of London Series A-Mathematical Physical and Engineering Sciences pages 2593–2606.
27. Papagiannaki, et al, 2005. Long-term forecasting of internet backbone traffic, IEEE Transactions on Neural Networks pages 1110–1124.
28. Abramovich, et al, 2002. Bayes approach to block wavelet function estimation, Computational Statistics and Data Analysis pages 435–451.
29. Gencay, et al, 2002. An Introduction to Wavelets and Other Filtering Methods in Finance and Economics, Academic Press, New York.
30. Patterson, 1996. Artificial Neural Networks: Theory and Applications, Prentice Hall.
31. Hsieh, et al, 2010. Forecasting Stock Market Using Wavelet Transform and neural networks: An Integrated system based on artificial bee colony algorithm", Applied soft computing.
32. Adavandi, et al, 2010. Integration of genetic fuzzy systems and artificial neural networks for stock price forecasting", Knowledge based system 23 pages, 800-808.
33. Chang, et al, 2008. A TSK type fuzzy rule based system for stock price prediction, Expert Systems with Applications 34 pages 135–144.
34. Cheng, et al, 2007. Fuzzy time-series based on Fibonacci sequence for stock price forecasting, Physical a 380 pages 377–390.
35. Cheng, et al, 2008. Fuzzy time-series based on adaptive expectation model for TAIEX forecasting, Expert Systems with Applications 34 pages 1126– 1132.
36. Lin, et al, 2007. The Application of Genetic Algorithms in Stock Market Data Mining Optimization, Faculty of Information Technology, University of Technology, Sydney, NSW, Australia.
38. Fransworth, et al, 2004. Successful Technical Trading Agents Using Genetic Programming, Sandia National Laboratories.
39. Refenes, et al, 1994. Stock Performance Modeling Using Neural Networks: A Comparative Study with Regression Models", Neural Networks volume. 7, No. 2, pages 375-388.
40. 28. Refenes, et al, 1994. Stock performance modeling using neural networks: a comparative study with regression models", Neural Networks pages 375–388.
41. Adel, et al, 2006.The reaction of stock markets to crashes and events: a comparison study between emerging and mature markets using wavelet transforms", Physical pages 511– 521.