Growing knowledge: an overview of Seed Plant diversity in Brazil
http://rodriguesia.jbrj.gov.brDOI: 10.1590/2175-7860201566411
The Brazil Flora Group
Recommended citation: BFG (2015).
This paper was compiled by Daniela C. Zappi
1, Fabiana L. Ranzato Filardi, Paula Leitman, Vinícius C. Souza,
Bruno M.T. Walter, José R. Pirani, Marli P. Morim, Luciano P. Queiroz, Taciana B. Cavalcanti, Vidal F. Mansano
and Rafaela C. Forzza
1With contributions by: Abreu, Maria C.; Acevedo-Rodríguez, Pedro; Agra, Maria F.; Almeida Jr., Eduardo B.;
Almeida, Gracineide S.S.; Almeida, Rafael F.; Alves, Flávio M.; Alves, Marccus; Alves-Araujo, Anderson; Amaral,
Maria C.E.; Amorim, André M.; Amorim, Bruno; Andrade, Ivanilza M.; Andreata, Regina H.P.; Andrino, Caroline
O.; Anunciação, Elisete A.; Aona, Lidyanne Y.S.; Aranguren, Yani; Aranha Filho, João L.M.; Araújo, Andrea O.;
Araújo, Ariclenes A.M.; Araújo, Diogo; Arbo, María M.; Assis, Leandro; Assis, Marta C.; Assunção, Vivian A.;
Athiê-Souza, Sarah M.; Azevedo, Cecilia O.; Baitello, João B.; Barberena, Felipe F.V.A.; Barbosa, Maria R.V.; Barros,
Fábio; Barros, Lucas A.V.; Barros, Michel J.F.; Baumgratz, José F.A.; Bernacci, Luis C.; Berry, Paul E.; Bigio, Narcísio
C.; Biral, Leonardo; Bittrich, Volker; Borges, Rafael A.X.; Bortoluzzi, Roseli L.C.; Bove, Cláudia P.; Bovini, Massimo
G.; Braga, João M.A.; Braz, Denise M.; Bringel Jr., João B.A.; Bruniera, Carla P.; Buturi, Camila V.; Cabral, Elza;
Cabral, Fernanda N.; Caddah, Mayara K.; Caires, Claudenir S.; Calazans, Luana S.B.; Calió, Maria F.; Camargo,
Rodrigo A.; Campbell, Lisa; Canto-Dorow, Thais S.; Carauta, Jorge P.P.†; Cardiel, José M.; Cardoso, Domingos
B.O.S.; Cardoso, Leandro J.T.; Carneiro, Camila R.; Carneiro, Cláudia E.; Carneiro-Torres, Daniela S.; Carrijo,
Tatiana T.; Caruzo, Maria B.R.; Carvalho, Maria L.S.; Carvalho-Silva, Micheline; Castello, Ana C.D.; Cavalheiro,
Larissa; Cervi, Armando C.†; Chacon, Roberta G.; Chautems, Alain; Chiavegatto, Berenice; Chukr, Nádia S.; Coelho,
Alexa A.O.P.; Coelho, Marcus A.N.; Coelho, Rubens L.G.; Cordeiro, Inês; Cordula, Elizabeth; Cornejo, Xavier;
Côrtes, Ana L.A.; Costa, Andrea F.; Costa, Fabiane N.; Costa, Jorge A.S.; Costa, Leila C.; Costa-e-Silva, Maria
B.; Costa-Lima, James L.; Cota, Maria R.C.; Couto, Ricardo S.; Daly, Douglas C.; De Stefano, Rodrigo D.; De
Toni, Karen; Dematteis, Massimiliano; Dettke, Greta A.; Di Maio, Fernando R.; Dórea, Marcos C.; Duarte, Marília
C.; Dutilh, Julie H.A.; Dutra, Valquíria F.; Echternacht, Lívia; Eggers, Lilian; Esteves, Gerleni; Ezcurra, Cecilia; Falcão
Junior, Marcus J.A.; Feres, Fabíola; Fernandes, José M.; Ferreira, D.M.C.; Ferreira, Fabrício M.; Ferreira, Gabriel E.;
Ferreira, Priscila P.A.; Ferreira, Silvana C.; Ferrucci, Maria S.; Fiaschi, Pedro; Filgueiras, Tarciso S.; Firens, Marcela;
Flores, Andreia S.; Forero, Enrique; Forster, Wellington; Fortuna-Perez, Ana P.; Fortunato, Reneé H.; Fraga, Cláudio
N.; França, Flávio; Francener, Augusto; Freitas, Joelcio; Freitas, Maria F.; Fritsch, Peter W.; Furtado, Samyra G.;
Gaglioti, André L.; Garcia, Flávia C.P.; Germano Filho, Pedro; Giacomin, Leandro; Gil, André S.B.; Giulietti, Ana
M.; Godoy, Silvana A.P. ; Goldenberg, Renato; Gomes da Costa, Géssica A.; Gomes, Mário; Gomes-Klein, Vera
L.; Gonçalves, Eduardo Gomes; Graham, Shirley; Groppo, Milton; Guedes. Juliana S.; Guimarães, Leonardo R.S.;
Guimarães, Paulo J.F.; Guimarães, Elsie F.; Gutierrez, Raul; Harley, Raymond; Hassemer, Gustavo; Hattori, Eric
K.O.; Hefler, Sonia M.; Heiden, Gustavo; Henderson, Andrew; Hensold, Nancy; Hiepko, Paul; Holanda, Ana S.S.;
Iganci, João R.V.; Imig, Daniela C.; Indriunas, Alexandre; Jacques, Eliane L.; Jardim, Jomar G.; Kamer, Hiltje M.;
Kameyama, Cíntia; Kinoshita, Luiza S.; Kirizawa, Mizué; Klitgaard, Bente B.; Koch, Ingrid; Koschnitzke, Cristiana;
Krauss, Nathália P.; Kriebel, Ricardo; Kuntz, Juliana; Larocca, João; Leal, Eduardo S.; Lewis, Gwilym P.; Lima, Carla
T.; Lima, Haroldo C.; Lima, Itamar B.; Lima, Laíce F.G.; Lima, Laura C.P.; Lima, Leticia R.; Lima, Luís F.P.; Lima,
Rita B.; Lírio, Elton J.; Liro, Renata M.; Lleras, Eduardo†; Lobão, Adriana; Loeuille, Benoit; Lohmann, Lúcia G.;
Loiola, Maria I.B.; Lombardi, Julio A.; Longhi-Wagner, Hilda M.; Lopes, Rosana C.; Lorencini, Tiago S.; Louzada,
Rafael B.; Lovo, Juliana; Lozano, Eduardo D.; Lucas, Eve; Ludtke, Raquel; Luz, Christian L.; Maas, Paul; Machado,
Anderson F.P.; Macias, Leila; Maciel, Jefferson R.; Magenta, Mara A.G.; Mamede, Maria C.H.; Manoel, Evelin A.;
Marchioretto, Maria S.; Marques, Juliana S.; Marquete, Nilda; Marquete, Ronaldo; Martinelli, Gustavo; Martins da
Silva, Regina C.V.; Martins, Ângela B.; Martins, Erika R.; Martins, Márcio L.L.; Martins, Milena V.; Martins, Renata
C.; Matias, Ligia Q.; Maya-L., Carlos A.; Mayo, Simon; Mazine, Fiorella; Medeiros, Debora; Medeiros, Erika S.;
Medeiros, Herison; Medeiros, João D.; Meireles, José E.; Mello-Silva, Renato; Melo, Aline; Melo, André L.; Melo,
Efigênia; Melo, José I.M.; Menezes, Cristine G.; Menini Neto, Luiz; Mentz, Lilian A.; Mezzonato, A.C.; Michelangeli,
Fabián A.; Milward-de-Azevedo, Michaele A.; Miotto, Silvia T.S.; Miranda, Vitor F.O.; Mondin, Cláudio A.; Monge,
Marcelo; Monteiro, Daniele; Monteiro, Raquel F.; Moraes, Marta D.; Moraes, Pedro L.R.; Mori, Scott A.; Mota, Aline
C.; Mota, Nara F.O.; Moura, Tania M.; Mulgura, Maria; Nakajima, Jimi N.; Nardy, Camila; Nascimento Júnior, José
E.; Noblick, Larry; Nunes, Teonildes S.; O’Leary, Nataly; Oliveira, Arline S.; Oliveira, Caetano T.; Oliveira, Juliana
A.; Oliveira, Luciana S.D.; Oliveira, Maria L.A.A.; Oliveira, Regina C.; Oliveira, Renata S.; Oliveira, Reyjane P.;
Paixão-Souza, Bruno; Parra, Lara R.; Pasini, Eduardo; Pastore, José F.B.; Pastore, Mayara; Paula-Souza, Juliana;
Pederneiras, Leandro C.; Peixoto, Ariane L.; Pelissari, Gisela; Pellegrini, Marco O.O.; Pennington, Toby; Perdiz,
Ricardo O.; Pereira, Anna C.M.; Pereira, Maria S.; Pereira, Rodrigo A.S.; Pessoa, Clenia; Pessoa, Edlley M.; Pessoa,
Maria C.R.; Pinto, Luiz J.S.; Pinto, Rafael B.; Pontes, Tiago A.; Prance, Ghillean T.; Proença, Carolyn; Profice,
Sheila R.; Pscheidt, Allan C.; Queiroz, George A.; Queiroz, Rubens T.; Quinet, Alexandre; Rainer, Heimo; Ramos,
Eliana; Rando, Juliana G.; Rapini, Alessandro; Reginato, Marcelo; Reis, Ilka P.; Reis, Priscila A.; Ribeiro, André R.O.;
Ribeiro, José E.L.S.; Riina, Ricarda; Ritter, Mara R.; Rivadavia, Fernando; Rocha, Antônio E.S.; Rocha, Maria J.R.;
Rodrigues, Izabella M.C.; Rodrigues, Karina F.; Rodrigues, Rodrigo S.; Rodrigues, Rodrigo S.; Rodrigues, Vinícius
T.; Rodrigues, William; Romaniuc Neto, Sérgio; Romão, Gerson O.; Romero, Rosana; Roque, Nádia; Rosa, Patrícia;
Rossi, Lúcia; Sá, Cyl F.C.; Saavedra, Mariana M.; Saka, Mariana; Sakuragui, Cássia M.; Salas, Roberto M.; Sales,
Margareth F.; Salimena, Fatima R.G.; Sampaio, Daniela; Sancho, Gisela; Sano, Paulo T.; Santos, Alessandra; Santos,
Élide P.; Santos, Juliana S.; Santos, Marianna R.; Santos-Gonçalves, Ana P.; Santos-Silva, Fernanda; São-Mateus,
Wallace; Saraiva, Deisy P.; Saridakis, Dennis P.; Sartori, Ângela L.B.; Scalon, Viviane R.; Schneider, Ângelo; Sebastiani,
Renata; Secco, Ricardo S.; Senna, Luisa; Senna-Valle, Luci; Shirasuna, Regina T.; Silva Filho, Pedro J.S.; Silva,
Anádria S.; Silva, Christian; Silva, Genilson A.R.; Silva, Gisele O.; Silva, Márcia C.R.; Silva, Marcos J.; Silva, Marcos
J.; Silva, Otávio L.M.; Silva, Rafaela A.P.; Silva, Saura R.; Silva, Tania R.S.; Silva-Gonçalves, Kelly C.; Silva-Luz,
Cíntia L.; Simão-Bianchini, Rosângela; Simões, André O.; Simpson, Beryl; Siniscalchi, Carolina M.; Siqueira Filho,
José A.; Siqueira, Carlos E.; Siqueira, Josafá C.; Smith, Nathan P.; Snak, Cristiane; Soares Neto, Raimundo L.;
Soares, Kelen P.; Soares, Marcos V.B.; Soares, Maria L.; Soares, Polyana N.; Sobral, Marcos; Sodré, Rodolfo C.;
Somner, Genise V.; Sothers, Cynthia A.; Sousa, Danilo J.L.; Souza, Elnatan B.; Souza, Élvia R.; Souza, Marcelo;
Souza, Maria L.D.R.; Souza-Buturi, Fátima O.; Spina, Andréa P.; Stapf, María N.S.; Stefano, Marina V.; Stehmann,
João R.; Steinmann, Victor; Takeuchi, Cátia; Taylor, Charlotte M.; Taylor, Nigel P.; Teles, Aristônio M.; Temponi,
Lívia G.; Terra-Araujo, Mário H.; Thode, Veronica; Thomas, W.Wayt; Tissot-Squalli, Mara L.; Torke, Benjamin
M.; Torres, Roseli B.; Tozzi, Ana M.G.A.; Trad, Rafaela J.; Trevisan, Rafael; Trovó, Marcelo; Valls, José F.M.; Vaz,
Introduction
The Global Strategy for Plant Conservation (GSPC), adopted by the Conference of the Parties of the Convention’s signatory countries on Biological Diversity (CBD), held at The Hague, Holland, in 2002, set 16 targets to be achieved globally by 2010. The first target, vital to the completion of all others, was the development of a functional, widely
Angela M.S.F.; Versieux, Leonardo; Viana, Pedro L.; Vianna Filho, Marcelo D.M.; Vieira, Ana O.S.; Vieira, Diego
D.; Vignoli-Silva, Márcia; Vilar, Thaisa; Vinhos, Franklin; Wallnöfer, Bruno; Wanderley, Maria G.L.; Wasshausen,
Dieter; Watanabe, Maurício T.C.; Weigend, Maximilian; Welker, Cassiano A.D.; Woodgyer, Elizabeth; Xifreda, Cecilia
C.; Yamamoto, Kikyo; Zanin, Ana; Zenni, Rafael D.; Zickel, Carmem S.
Abstract
An updated inventory of Brazilian seed plants is presented and offers important insights into the country’s
biodiversity. This work started in 2010, with the publication of the Plants and Fungi Catalogue, and has been
updated since by more than 430 specialists working online. Brazil is home to 32,086 native Angiosperms and
23 native Gymnosperms, showing an increase of 3% in its species richness in relation to 2010. The Amazon
Rainforest is the richest Brazilian biome for Gymnosperms, while the Atlantic Rainforest is the richest one for
Angiosperms. There was a considerable increment in the number of species and endemism rates for biomes, except
for the Amazon that showed a decrease of 2.5% of recorded endemics. However, well over half of Brazillian seed
plant species (57.4%) is endemic to this territory. The proportion of life-forms varies among different biomes:
trees are more expressive in the Amazon and Atlantic Rainforest biomes while herbs predominate in the Pampa,
and lianas are more expressive in the Amazon, Atlantic Rainforest, and Pantanal. This compilation serves not only
to quantify Brazilian biodiversity, but also to highlight areas where there information is lacking and to provide a
framework for the challenge faced in conserving Brazil’s unique and diverse flora.
Key words: Angiosperms, biomes, endemism, Gymnosperms, life-forms.
Resumo
Um levantamento atualizado das plantas com sementes e análises relevantes acerca desta biodiversidade são apresentados.
Este trabalho se iniciou em 2010 com a publicação do Catálogo de Plantas e Fungos e, desde então vem sendo atualizado
por mais de 430 especialistas trabalhando online. O Brasil abriga atualmente 32.086 espécies nativas de Angiospermas
e 23 espécies nativas de Gimnospermas e estes novos dados mostram um aumento de 3% da riqueza em relação a 2010.
A Amazônia é o Domínio Fitogeográfico com o maior número de espécies de Gimnospermas, enquanto que a Floresta
Atlântica possui a maior riqueza de Angiospermas. Houve um crescimento considerável no número de espécies e nas
taxas de endemismo para a maioria dos Domínios (Caatinga, Cerrado, Floresta Atlântica, Pampa e Pantanal), com
exceção da Amazônia que apresentou uma diminuição de 2,5% de endemicidade. Entretanto, a maior parte das plantas
com sementes que ocorrem no Brasil (57,4%) é endêmica deste território. A proporção de formas de vida varia de acordo
com os diferentes Domínios: árvores são mais expressivas na Amazônia e Floresta Atlântica do que nos outros biomas,
ervas são dominantes no Pampa e as lianas apresentam riqueza expressiva na Amazônia, Floresta Atlântica e Pantanal.
Este trabalho não só quantifica a biodiversidade brasileira, mas também indica as lacunas de conhecimento e o desafio a
ser enfrentado para a conservação desta flora.
Palavras-chave: Angiospermas, Domínios, endemismo, formas de vida, Gimnospermas.
1 Authors for correspondence: [email protected], [email protected]
For the complete list of authors, institutions and taxonomic groups see supplementary material <http://dx.doi.org/10.6084/m9.figshare.1531952> DOI: 10.1590/2175-7860201566411.
accessible list of all known plant species, as a first step towards a complete World Flora. In 2008, the Botanical Garden of Rio de Janeiro was designated by the Ministry of Environment to coordinate the preparation of the Species List of the Brazilian Flora. The Botanical Garden of Rio de Janeiro invited botanists from several Brazilian institutions to constitute the project’s Steering Committee.
Target 1 of the GSPC was reached by Brazil in 2010 with the launch of the first on-line version of the List of Flora of Brazil and the publication of Plants and Fungi Catalogue.
Awareness of the threats faced by the world’s biodiversity has risen considerably since the 1980s (Myers et al. 2000; Mittermeier et al. 2004). Brazil is at the center of this discussion, as it includes two of the 34 recognized global hotspots, housing a larger number of plant species than any other country in the world (Mittermeier et al. 2004; Forzza et al. 2012). With an economy strongly driven by large scale agriculture, mining of its natural resources, and growing urban population, large tracts of the country’s natural reserves are being depleted, even before our knowledge can ascertain what is being lost.
The Flora brasiliensis (Martius et al. 1833; Urban 1906) treatment listed 19,958 species of fungi, algae, mosses and vascular plants, including 18,857 seed plants. After that, botanical knowledge expanded inordinately as new species were described and names were synonymized through floristic and monographic accounts. There have been both conservative and generous estimates for the size of the seed plant component of the Brazilian Flora (Forzza et al. 2012), and, while the 2010 list, dealing only with described plant diversity, did not reach the more conservative published estimate (35,664 species) and is very far from the exaggerated (45,015 species) ones, it still surpassed the number of plants known thus far in any other country in the world. The Brazilian Catalogue of Plants and Fungi reported 31,188 species of seed plants, distributed in 2,818 genera and 227 families of Angiosperms (Forzza et al. 2010) and 23 species in six genera and five families of Gymnosperms (Souza 2010).
Five years have elapsed from the first release of the Brazilian on-line list and the addition of new facilities have enabled botanists to contribute further information regarding species habit, substrate and vegetation types, as well as continuing to refine the existing list and adding new records and taxa. Here we provide a snapshot of the changes to the Brazilian List during this period, and also analyse new data that have come to light at the end of this process, providing a fresh insight into seed plant species numbers, endemism and distribution patterns, as well as proportions of life-forms and richness throughout the main habitats of this megadiverse country.
Methods
The methodology followed the principles established for all plant and fungi groups catalogued by Forzza et al. (2010). The minimum
Species2000 fields were adopted and increased with others (geopolitical divisions, biomes etc.) that were interesting to feature for the Brazilian context, and the design and development of an information system that allowed instant management, collaborative updating of the data and generation of the 2010 Catalogue (Forzza
et al. 2010). The work took place in two phases. The first one included analysis, harmonization and importation of diverse state and regional lists and taxonomic treatments already available (see Forzza et al. 2010 for a complete list), while the second phase was the revision and updating of the information relative to each taxon made directly on-line by 334 specialists.
From 2011 the contributors continued with the task of including new records and modifying existent ones as more scientific data became available. Yearly releases of the system comprised new fields and dictionaries to include data regarding life-forms, substrate and vegetation type for each taxon that needed to be completed, and a new functionality to include images meant that the researchers could, from that point onwards, choose images from herbarium records and make available their own images of living plants. At the end of 2014 the Angiosperm and Gymnosperm coordinators complemented data in families where data were still missing. During the three first months of 2015 a data evaluation process generated a series of reports indicating inconsistencies aimed to help the 437 contributors to further clean the data. The corrections were added in March 2015. For more information about the final dataset see supplementary material <http://dx.doi.org/10.6084/m9.figshare.1538647> - DOI: 10.1590/2175-7860201566411.
From the start of the project, the importance to distinguish between native and exotic species was highlighted, and the contributing specialists had to complete an ‘Origin’ field with the following options: native, naturalized and cultivated. Moro
et al. (2012) clearly states different categories for exotic species and analyses the discrepancies of treatment these species receive from different taxonomists in Forzza et al. (2010). It was never the intention comprehensively list all species
cultivated in Brazil. Moreover, for the purpose of the statistics presented in this paper, all analyses apart from the initial overview section were based only on the numbers of native plants. However, data from Forzza
et al. (2010) may take into account some non-native species, influencing the comparisons performed within this article.
The term endemic, meaning that a taxon is
unique to a defined geographic location, has been
used at different levels (endemic to Brazil, endemic to one of Brazil’s Biomes, a state or a vegetation type). The words endemic and restricted, or with restricted distribution, were used to analyse taxa in relation to where they occur, for instance, Parodia buiningii
(Buxb.) N.P.Taylor (Cactaceae) is restricted to the state of Rio Grande do Sul and to the Pampa in Brazil, but it also occurs in Argentina, therefore it is not endemic of Brazil.
As one of the objectives of this work was to examine the effect of the continued input by specialists into the on-line Brazilian List system (Lista de Espécies da Flora do Brasil 2015), comparative gross percentage calculations highlighting growth and decrease in species number were calculated. These were based on the species number difference between 2015 and 2010 divided by the totals found in 2010. These are presented alongside the total percentages in the results tables.
The term Biome used in the project and in the results and discussion of this paper are equivalent to the six Phytogeographic Domains, or Domínios Fitogeográficos defined by IBGE (2004).
Results Overall
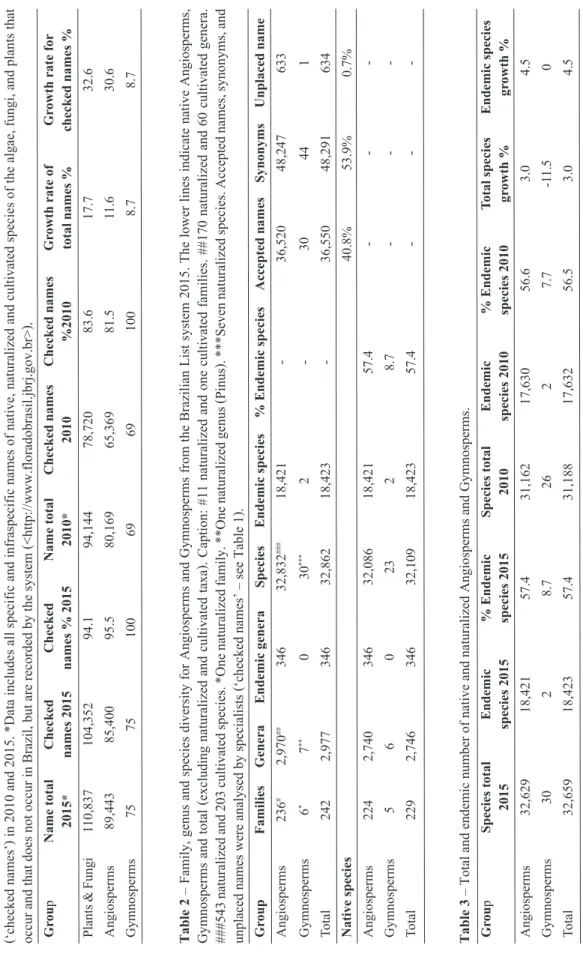
More than 110,000 names were included in the system by 2015, while the original database in 2010 had 94,144 names (Tab. 1). All 69 names of Gymnosperms, as well as the further six names added by 2015, were checked (Tab. 1). The positive balance of new Angiosperm names included in the system in five years was 9,274 (11.6% of the initial total). The number of checked names, 85,400, grew in balance by 20,033, or 30.6% of the initial total of 65,369 in 2010, thus today the Brazilian list has over 95.5% of its Angiosperm names checked by specialists (Tab. 1). Wherever possible, the checked names either marked as accepted names or as synonyms linked to an accepted name (Tab. 2). The present number of unplaced names of Angiosperms is 633, and a single name for Gymnosperms (Tab. 2).
At present, seed plant diversity totals 32,109 accepted native species (23 of which are Gymnosperms)
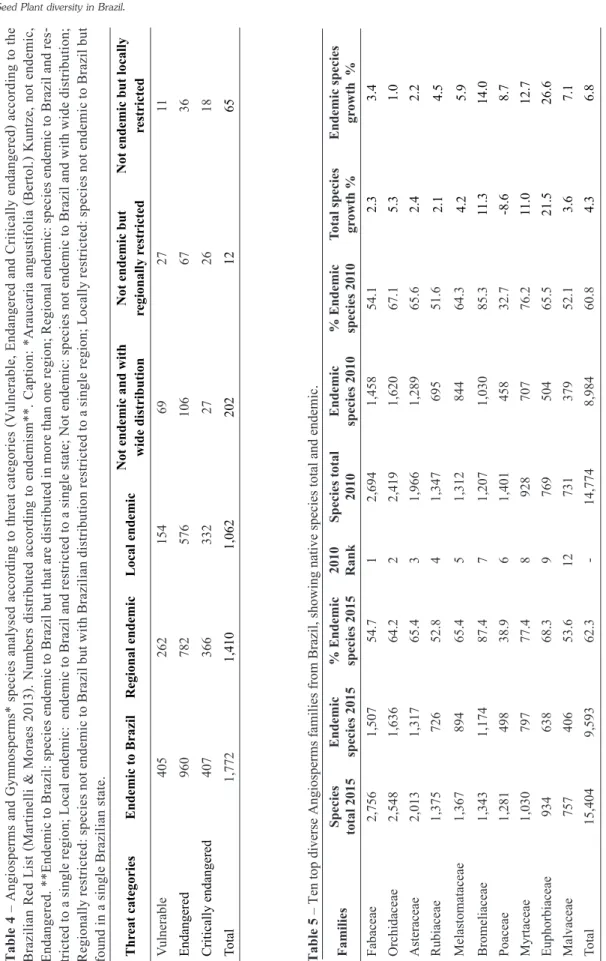
belonging to 2,746 genera and 229 families (Tab. 2). With the addition of 921 native species between 2010 and 2015, the species number figure grew 3% in the last five years (Tab. 3). Overall endemism figures have grown proportionally more than the number of accepted native species, from 17,632 in 2010 (56.5%) to 18,423 (57.4%) in 2015, with the addition of 791 endemic species, a gross increase of 4.5% (Tab. 3). The Brazilian Red List (Martinelli & Moraes 2013) includes 1,974 species (1,772 endemic and 202 not endemic to Brazil) that were currently listed under one of these threat categories: critically endangered - CR, endangered - EN, and vulnerable - VU (Tab. 4).
Top 10 families
The top 10 families Fabaceae, Orchidaceae, Asteraceae, Rubiaceae, Melastomataceae, Bromeliaceae, Poaceae, Myrtaceae, Euphorbiaceae and Malvaceae contribute 15,404 to the total number of Angiosperm species (47.2%). The total species contribution of these families appears to be more significant in terms of endemism, contributing 9,593 endemic species, or 62.3% of the endemism at the country level (Tab. 5). The increase found for the total species number (4.3%) is lower than the endemism difference of 6.8% found for the top 10 families.
Nine of the ten largest families coincide with those found in the Catalogue (Forzza et al. 2010), the exception being Apocynaceae (down 5 species from 2010 - now with 754 species, of which 403 are endemic), that was surpassed by Malvaceae in 2015 (Tab. 5). Apart from Poaceae, where there was a decrease of 120 species, the general increase found was between 2.1% (Rubiaceae) and 21.5% (Euphorbiaceae) for the largest families. The remaining 214 families that occur in Brazil have between one and 756 species.
In terms of endemism, the gross increase was between 1% (Orchidaceae) and 26.6% (Euphorbiaceae), but in general endemism grew between 2.2% (Asteraceae) and 8.7% (Poaceae), with Myrtaceae (12.7%) and Bromeliaceae (14%) reaching slightly higher values.
Top 30 genera
The 30 largest genera of Brazilian Angiosperms add up to 6,380 species, representing 19.5% of the total diversity of the group. The contribution of these genera appears to be proportionally more significant in terms of endemism, contributing with 4,485 endemic species, or 24.3% of total endemism (Tab. 6).
The order in which the top 30 largest genera appeared in Forzza et al. (2010) has changed
Table
1 – Total number
of
name
s fr
om the
Br
azilian Lis
t sys
tem, name tota
ls f
or A
ngios
per
ms
and G
ymnos
per
ms
and pr
opor
tion betw
een the names
analys
ed by s
pecialis
ts
(‘checked names’) in
2010
and 2015. *Data includes
all
specific
and infraspecific names
of native,
naturalized
and cultivated
species of the algae,
fungi,
and plants
that
occur and that does not occur in Brazil, but are recorded by the system (<http://www.floradobrasil.jbrj.gov.br>).
Group Name total 2015* Checked names 2015 Checked names % 2015 Name total 2010* Checked names 2010 Checked names %2010 Gr owth rate of total names % Gr
owth rate for
checked names %
Plants & Fungi
110,837 104,352 94.1 94,144 78,720 83.6 17.7 32.6 Angiosperms 89,443 85,400 95.5 80,169 65,369 81.5 11.6 30.6 Gymnosperms 75 75 100 69 69 100 8.7 8.7
Table
2 – Family
, genus and species diversity
for Angiosperms and Gymnosperms from the Brazilian
List
system
2015. The lower lines
indicate
native
Angiosperms,
Gymnosperms and total
(excluding
naturalized
and cultivated
taxa). Caption:
#11 naturalized
and one cultivated
families.
##170 naturalized
and 60 cultivated
genera.
###543 naturalize
d and 203 cultivated
species. *One naturalized
family.
**One naturalized
genus (Pinus). ***Seven
naturalized
species. Accepted names, synonyms,
and
unplaced names were analysed by specialists (‘checked names’ – see Table 1).
GroupFamilies Genera Endemic genera Species Endemic species % Endemic species Accepted names Synonyms Unplaced name Angiosperms 236 # 2,970 ## 346 32,832 ### 18,421 -36,520 48,247 633 Gymnosperms 6 * 7 ** 0 30 *** 2 -30 44 1 Total 242 2,977 346 32,862 18,423 -36,550 48,291 634 Native species 40.8% 53.9% 0.7% Angiosperms 224 2,740 346 32,086 18,421 57.4 -Gymnosperms 5 6 0 23 2 8.7 -Total 229 2,746 346 32,109 18,423 57.4
-Table 3
– Total and endemic number of native and naturalized Angiosperms and Gymnosperms.
Gr ou p Species total 2015 Endemic species 2015 % Endemic species 2015 Species total 2010 Endemic species 2010 % Endemic species 2010 Total species gr owth % Endemic species gr owth % Angiosperms 32,629 18,421 57.4 31,162 17,630 56.6 3.0 4.5 Gymnosperms 30 2 8.7 26 2 7.7 -1 1.5 0 Total 32,659 18,423 57.4 31,188 17,632 56.5 3.0 4.5
Table 4
– Angiosperms and Gymnosperms* species analysed according to threat categories (V
ulnerable, Endangered and Critically endangered) according to the
Brazilian Red List (Martinelli & Moraes 2013). Numbers distributed according to endemism**. Caption: *A
raucaria angustifolia (Bertol.) Kuntze, not endemic,
Endangered. **Endemic to Brazil: species endemic to Brazil but that are distributed in more than one region; Regional endemic:
species endemic to Brazil and res
-tricted to a single region; Local endemic: endemic to Brazil and res-tricted to a single state; N
ot endemic: species not endemic to Brazil and with w
ide distribution;
Regionally restricted: species not endemic to Brazil but with Brazilian distribution restricted to a single region; Locally res
tricted: species not endemic to Brazil but
found in a single Brazilian state.
Threat categories
Endemic to Brazil
Regional endemic
Local endemic
Not endemic and with wide distribution
Not endemic but
regionally r
estricted
Not endemic but locally
restricted V ulnerable 405 262 154 69 27 11 Endangered 960 782 576 106 67 36 Critically endangered 407 366 332 27 26 18 Total 1,772 1,410 1,062 202 12 65
Table 5
– Ten top diverse Angiosperms families from Brazil, showing native species total and endemic.
Families Species total 2015 Endemic species 2015 % Endemic species 2015 2010 Rank Species total 2010 Endemic species 2010 % Endemic species 2010 Total species gr owth % Endemic species gr owth % Fabaceae 2,756 1,507 54.7 1 2,694 1,458 54.1 2.3 3.4 Orchidaceae 2,548 1,636 64.2 2 2,419 1,620 67.1 5.3 1.0 Asteraceae 2,013 1,317 65.4 3 1,966 1,289 65.6 2.4 2.2 Rubiaceae 1,375 726 52.8 4 1,347 695 51.6 2.1 4.5 Melastomataceae 1,367 894 65.4 5 1,312 844 64.3 4.2 5.9 Bromeliaceae 1,343 1,174 87.4 7 1,207 1,030 85.3 11.3 14.0 Poaceae 1,281 498 38.9 6 1,401 458 32.7 -8.6 8.7 Myrtaceae 1,030 797 77.4 8 928 707 76.2 11.0 12.7 Euphorbiaceae 934 638 68.3 9 769 504 65.5 21.5 26.6 Malvaceae 757 406 53.6 12 731 379 52.1 3.6 7.1 Total 15,404 9,593 62.3 -14,774 8,984 60.8 4.3 6.8
noticeably, with Eugenia overtaking Paepalanthus
and Mimosa, and Paepalanthus falling to the third position, Croton climbing from 16th to 4th position,
Psychotria falling from 6th to 10th position, Leandra
from 10th to 14th, Vriesea moving from 15th to 11th and
Baccharis from 24th to 17th position. Dyckia, Pavonia
and Anthurium reached the top 30 largest genera, while Inga, Justicia and, more dramatically, Hyptis, were overtaken.
While Croton was the genus with the largest increase in number of species, from 186 to 316 species (Tab. 6), other three amongst the most speciose genera have increased by around 20% or more: Baccharis
(from 149 to 178 species), Dyckia (from 115 to 141 species) and Myrcia (from 215 to 260 species). The genera that were adjusted downwards are
Paepalanthus (from 357 to 338 species), Psychotria
(264 to 252) and Leandra (213 to 206).
The proportion of endemic species within these genera followed, in general, the increases or decreases in species number. However, Croton
had a more dramatic endemism increase (86.7%) compared to species richness growth of 69.9% and, in Rhynchospora, endemism increased by 45.5% for a species growth of 8.1%. In relative terms, the percentage of endemic species of Rhynchospora
moved from 24.3% of the species to 32.6%.
Amongst the exceptions to this trend,
Philodendron species increased 7.7% from 156 to 168 species, while the endemism figure was adjusted from 127 to only 79 species, falling 37.8%, from 81.4% to 47% endemic (Tab. 6). Despite the fact that the species numbers increased for Baccharis, the proportion of endemism has slightly decreased (-2.91%). The genus Piper, with a slight increase in the number of species, had a gross endemic species decrease of 6.3%. While the ten most diverse families presented a slight increase in the level of endemism when compared to the list produced in 2010 (Tab. 5), the 30 largest genera practically maintained their proportional contribution in percentages: 70.2% in 2010 and 70.3% in 2015 (Tab. 6).
Biomes
Seed plant occurrence in the Brazilian biomes is illustrated in Figure 3. While for the Gymnosperms (Tab. 7) the Amazon Rainforest is the Brazilian biome with the highest number of species, for Angiosperms (Tab. 8, Fig. 1) the highest species number is found in the Atlantic Rainforest, with 15,001 native species of which 7,432 (49.5%), are endemic to this biome, followed by the Cerrado,
12,097 total species with 4,252 (35.1%) endemic; Amazon Rainforest (11,896 total species, with 1,900 (16%) endemic); Caatinga (4,657 total species, with 913 (19.7%) endemic); Pampa (1,685 total species, with 102 (6.1%) endemic); and Pantanal (1,277 total species, with 54 (4.2%) endemic species).
The increment of species between 2010 and 2015 was proportionally higher for the two biomes with least species (Fig. 1, Tab. 8), totalling 44.3% (392 species) for the Pantanal and 25.3% (340 species) for the Pampa. The Caatinga had an increase of 7.8% (337 species), which was a similar increase to the Atlantic Rainforest (7.4% or 1,029 species). The Cerrado gained an additional 712 species (6.3% increase), and the Amazon Rainforest, with 547 species added since 2010, had the smallest increase (4.8%).
The figures for endemism per biome followed the growth trend for the Pantanal (8 more endemic species, or 17.4% increase), Pampa (26 more endemic species, 34.2% increase), and Caatinga (169 more endemic species, 22.7% increase). Meanwhile the Atlantic Rainforest and the Cerrado had moderate growth of endemism numbers, with respectively 418 and 102, an equivalent of a 6% and 2.5% increase. The Amazon Rainforest’s recorded endemism decreased, with 48 less endemic species than it had in 2010, a decrease of 2.5%. In relative terms, from 2015, the endemism in the Amazon region represents 16.1% of the total species (Tab. 8).
Each biome was analysed according to its top ten Angiosperm families (Tab. 9) and, of the overall top ten families (see item
Figure 1 – Angiosperm species number per biome,
with total numbers of species in 2010 and 2015, and
endemic species in 2015.
Table 6
– Comparison between the 30 most diverse Angiosperm genera.
Genera Families Species total 2015 Endemic species 2015 Endemic species % 2015 2010 Rank Species total 2010 Endemic species 2010 Endemic species % 2010 Total species gr owth % Endemic species gr owth % Eugenia Myrtaceae 387 302 78.0 2 356 274 77.1 8.7 10.2 Mimosa Fabaceae 358 265 74.0 3 323 244 75.5 10.8 8.6 Paepalanthus Eriocaulaceae 338 323 96.6 1 357 339 95.1 -5.3 -4.7 Cr oton Euphorbiaceae 316 252 79.8 16 186 135 72.6 69.9 86.7 Piper Piperaceae 288 179 62.2 4 282 191 67.5 2.1 -6.3 Miconia Melastomataceae 282 125 44.3 5 276 121 43.8 2.2 3.3 Solanum Solanaceae 270 133 49.3 7 258 127 49.2 4.7 4.7 Myr cia Myrtaceae 260 207 79.7 9 215 168 78.1 20.9 23.2 Chamaecrista Fabaceae 256 207 80.9 8 253 202 79.8 1.2 2.5 Psychotria Rubiaceae 251 142 56.6 6 264 137 51.9 -4.9 3.6 Vriesea Bromeliaceae 219 208 95.0 15 194 186 95.8 12.9 11.8 Begonia Begoniaceae 212 186 87.7 11 208 184 88.4 1.9 1.1 Paspalum Poaceae 209 75 35.9 13 202 72 35.6 3.5 4.2 Leandra Melastomataceae 206 166 80.6 10 213 167 78.4 -3.3 -0.6 Mikania Asteraceae 203 142 69.9 14 198 140 70.7 2.5 1.4 Aechmea Bromeliaceae 184 159 86.4 17 172 141 82.1 7.0 12.8 Baccharis Asteraceae 178 11 5 64.6 24 149 95 64.1 19.5 21.1 Xyris Xyridaceae 174 133 76.4 18 167 127 76.1 4.2 4.7 Ocotea Lauraceae 172 11 2 65.1 21 155 95 61.3 11.0 17.9 Philodendr on Araceae 168 79 47.0 20 156 127 81.4 7.7 -37.8 Tibouchina Melastomataceae 166 145 87.3 23 150 131 87.3 10.7 10.7 Peper omia Piperaceae 164 103 62.8 19 159 11 0 69.2 3.1 -6.4 Habenaria Orchidaceae 153 95 62.1 22 153 96 63.1 0.0 -1.0 Rhynchospora Cyperaceae 147 48 32.6 25 136 33 24.3 8.1 45.5 Passiflora Passifloraceae 141 83 58.9 28 129 83 64.3 9.3 0.0 Dyckia Bromeliaceae 141 128 90.8 -11 5 99 86.1 22.6 29.3 Dioscor ea Dioscoreaceae 136 103 75.7 27 130 94 72.3 4.6 9.6
Genera Families Species total 2015 Endemic species 2015 Endemic species % 2015 2010 Rank Species total 2010 Endemic species 2010 Endemic species % 2010 Total species gr owth % Endemic species gr owth % Pavonia Malvaceae 136 87 64.1 -123 76 61.8 10.6 14.5 Epidendrum Orchidaceae 134 80 59.7 26 133 81 61.0 0.8 -1.2 Anthurium Araceae 131 103 78.6 -120 91 75.8 9.2 13.2 Total -6,380 4,485 70.3 -5,932 4,166 70.2 7.6 7.7
Table 7
– Gymnosperm species number per biome.
Biomes Species total 2015 Species total 2010 Amazon Rainforest 16 16 Cerrado 6 6 Atlantic Rainforest 3 4 Caatinga 2 2 Pampa 2 1 Pantanal 0 0
Table 8
– Angiosperm species numbers per biome.
Biome Species total 2015 Endemic species 2015 Endemic species % 2015 Species total 2010 Endemic species 2010 Endemic species % 2010
Total species growth % Endemic species gr owth % Atlantic Rainforest 15,001 7,432 49.5 13,972 7,014 50.2 7.4 6.0 Cerrado 12,097 4,252 35.1 11,384 4,150 36.5 6.3 2.5 Amazon Rainforest 11,896 1,900 16.1 11,349 1,948 17.2 4.8 -2.5 Caatinga 4,657 913 19.7 4,320 744 17.2 7.8 22.7 Pampa 1,685 102 6.1 1,345 76 5.7 25.3 34.2 Pantanal 1,277 54 4.2 885 46 5.2 44.3 17.4
Table 9
– Ten top Angiosperms families per biome.
Atlantic Rainfor est Cerrado Amazon Rainfor est Caatinga Pampa Pantanal Orchidaceae (1,574) Asteraceae (1,216) Fabaceae (1,1 19) Fabaceae (605) Asteraceae (299) Poaceae (162) Fabaceae (964) Fabaceae (1,207) Orchidaceae (882) Poaceae (282) Poaceae (266) Fabaceae (153) Bromeliaceae (921) Orchidaceae (727) Rubiaceae (728) Asteraceae (284) Cyperaceae (141) Malvaceae (70) Asteraceae (885) Poaceae (648) Melastomataceae (495) Euphorbiaceae (232) Fabaceae (127) Asteraceae (67) Poaceae (734) Melastomataceae (484) Poaceae (440) Rubiaceae (168) Iridaceae (44) Cyperaceae (58) Myrtaceae (710) Eriocaulaceae (461) Apocynaceae (299) Cyperaceae (163) Solanaceae (44) Bignoniaceae(45) Melastomataceae (582) Rubiaceae (406) Cyperaceae (288) Malvaceae (156) Rubiaceae (42) Sapindaceae (41) Rubiaceae (564) Euphorbiaceae (386) Annonaceae (287) Apocynaceae (131) Convolvulaceae (36) Euphorbiaceae (35) Apocynaceae (367) Malvaceae (334) Euphorbiaceae (282) Melastomataceae (129) Cactaceae (35) Rubiaceae (34) Euphorbiaceae (327) Apocynaceae (293) Araceae (270) Orchidaceae (127) Amaryllidaceae (34) Malpighiaceae (25)
Table 10
– Angiosperm species numbers per Region with number of endemics.
Region Species total 2015 Endemic species 2015 Endemic species % 2015 Species total 2010 North 12,414 1,684 13.6 12,127 Northeast 10,661 2,416 22.7 10,220 Central-W estern 9,322 1,179 12.6 8,516 Southeast 16,127 5,690 35.3 15,550 South 7,566 1,004 13.3 7,333
Table 11
– Gymnosperm species number per Region.
Region Species total 2015 Species total 2010 North 17 16 Northeast 2 2 Central-W estern 7 7 Southeast 4 6 South 5 7
above), only Fabaceae, Poaceae and Rubiaceae appear among the top ten throughout all six biomes. Asteraceae and Euphorbiaceae appear in five biomes, while Apocynaceae, Cyperaceae, Melastomataceae and Orchidaceae appear in four. Malvaceae appears in three biomes. Thirteen plant families appear among the 10 top families under a single biome: Amaryllidaceae, Annonaceae, Araceae, Bignoniaceae, Bromeliaceae, Cactaceae, Convolvulaceae, Eriocaulaceae, Iridaceae, Malpighiaceae, Myrtaceae, Sapindaceae and Solanaceae.
Fabaceae is the most species rich family in the Amazon Rainforest and in the Caatinga, while it occupies the second position in the Atlantic Rainforest, Cerrado and Pantanal, and the fourth in the Pampa (Tab. 9). Poaceae, also included among the overall ten most diverse families, is the first in the Pantanal, and the second in the Caatinga and in the Pampa. Rubiaceae occupies the fourth position in the overall ten top families, but does not reach the five first positions in four biomes, however it is the third richest family in the Amazon Rainforest and the fifth in the Caatinga. Asteraceae, amongst the top ten families in five biomes apart from the Amazon, is the most important family in both Cerrado and Pampa. Euphorbiaceae occupies a noticeable position in the Caatinga, while it has a lower rank in the Atlantic Rainforest, Amazon Rainforest and Pantanal. Amongst the families present in four biomes, Orchidaceae figures as the most important family in the Atlantic Rainforest, while it appears in second place in the Amazon Rainforest, in third in the Cerrado and in tenth place in the Caatinga. Cyperaceae is the third most important one in the Pampa, while Malvaceae is the third most important one in the Pantanal. Among the families that appear in a single biome, Bromeliaceae is the most noticeable one as the third most important family in the Atlantic Rainforest. Pampa and Pantanal have families among their top 10 that are not in the list of the most diverse ones in other biomes (Tab. 9), with five exclusive for the Pampa (Iridaceae, Solanaceae, Convolvulaceae, Cactaceae and Amaryllidaceae) and three in the Pantanal (Bignoniaceae, Sapindaceae and Malpighiaceae).
Brazilian Geopolitical divisions - Regions and States
Regarding geopolitical subdivisions there was an increase in the number of Angiosperm
species recorded for the Southeastern region that continues to be the most diverse (16,127 vs. 15,550 species in 2010), being the one with highest number of endemic species (5,690), representing 35.3% of endemism (Tab. 10). On the other hand, the South has the smallest number of species (7,566 vs. 7,333 in 2010) and the lowest endemism as well (1,004 species, 13.3% endemism). In relation to Gymnosperms (Tab. 11), the North is the most diverse (17 species) and the Northeast the least diverse (two species). For Southeast and South regions there was a decrease of two species in 2015 in relation to 2010 (Tab. 11). Amazonas is the state with the highest number of species for Gymnosperms (12 species), followed for other two states that have part or all their territory included in the Amazonian biome (Tab. 12): Acre (8 species), Rondônia (7), Mato Grosso (6) and Pará (6). Six states (Amapá, Maranhão, Paraíba, Piauí, Rio Grande do Norte, and Tocantins) have no Gymnosperm records so far (Tab. 12).
The seven Brazilian states with the largest number of Angiosperm species remained in the same order found in 2010 (Tab. 13), with increased number of species varying from 8% to nearly 17%, as follows: Bahia (1,284 species - 16.7%), Minas Gerais (849 species - 8.2%), Amazonas (733 species - 9.7%), São Paulo (604 species - 8.7%), Rio de Janeiro (586 species - 8.7%), Pará (652 species - 11.6%) and Paraná (629 species - 12%). Below the seven states with the largest number of species, different addition rate of new records has caused inversions in states position in relation to what was found in 2010. Mato Grosso overtook Goiás, Espírito Santo surpassed Santa Catarina, Rio Grande do Sul overtook Acre, Rondônia passed Pernambuco, Roraima passed Maranhão and Tocantins overtook Piauí. The same trend of dramatic species number increase found within the biomes with the least species was true of the states with least number of species, such as Sergipe, that more than doubled its species count from 770 to 1,608 (103.8% increase), while Rio Grande do Norte (72.8%), Tocantins (70.3%) and Alagoas (63.3%) increased their numbers by more than 50%.
In terms of Brazilian states (Tab. 13), there is a trend of sharp drop in endemism for Rio de Janeiro (less 105 endemic species, or -8.9% than in 2010), Acre (less 50 species, or -46.3%), São Paulo (25 less species, -7.6%), Goiás (24 less species, -4.6%), Mato Grosso (15 less species,
Table 12 – Gymnosperm species number per Brazilian
State and Federal District.
States and Federal District Species number 2015 Species number 2010 Amazonas 12 12 Acre 8 8 Rondônia 7 4 Mato Grosso 6 5 Pará 6 4 Paraná 4 6 Minas Gerais 4 4 Goiás 4 5
Rio Grande do Sul 4 7
São Paulo 3 6 Santa Catarina 3 6 Rio de Janeiro 3 5 Roraima 3 0 Bahia 2 2 Distrito Federal 2 3 Espírito Santo 2 3 Alagoas 1 1 Ceará 1 0
Mato Grosso do Sul 1 1
Pernambuco 1 1 Sergipe 1 1 Amapá 0 1 Maranhão 0 0 Paraíba 0 0 Piauí 0 0
Rio Grande do Norte 0 0
Tocantins 0 0
-5.7%), Maranhão (10 less species, -20.8%), Amazonas (9 less species, -1.3%), Pará (8 less species, -2.8%), Pernambuco (7 less species, -9.2%), Rondônia (6 less species, -12.8%) and others states with 5 or less species. There was an increase in the number of endemic species registered for Espírito Santo, with 92 more endemic species, showing an increase of 19.5%, Rio Grande do Sul (41 species, 23.2%), Mato Grosso do Sul (14 species, 23.7%) and Roraima (5 species, 17.2%).
Life-forms
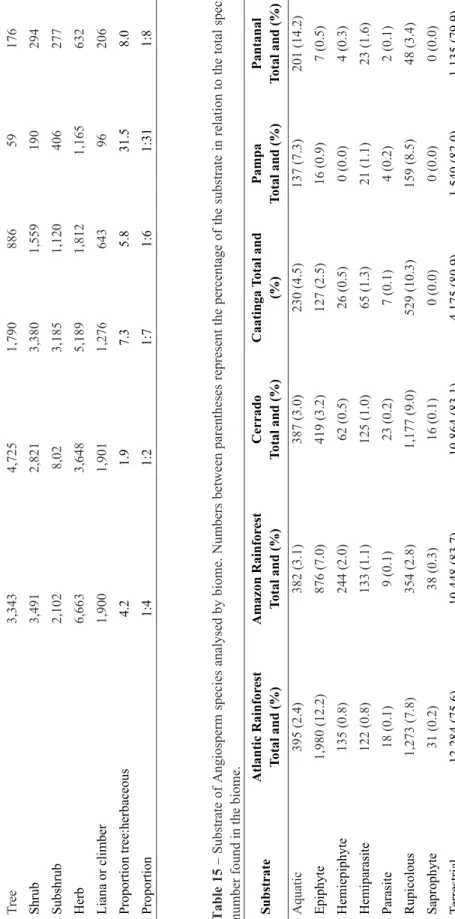
The proportion of life-forms varies within the different biomes, with trees appearing in larger proportion in the Amazon and Atlantic Rainforests, while herbs predominate in the Pampa (Tab. 14, Fig. 2). Other biomes, such as the Pantanal, Cerrado, Caatinga and, partly, the Atlantic Rainforest also have strong presence of herbs, but this is less extreme than what was found for the Pampa. Lianas are more expressive in the Amazon and Atlantic Rainforests, followed by the Pantanal. When comparing the profiles of the different biomes (Fig. 2), the Atlantic Rainforest and the Cerrado appear to be most comparable, also resembling what was found for the Caatinga, with a balanced presence of shrubs and trees, and 30% or more of herbs, with moderate numbers of lianas.
The proportion found between tree and shrub versus herbaceous species, including lianas, varies amongst the biomes (Tab. 14). The lowest proportion was recorded for the Amazon Rainforest, where for each tree species there are two shrubs or herbs, i.e. a ration of 1:2; while the Atlantic Rainforest presents 1:4 proportion. For the Caatinga, it was found to be 1:6, the Cerrado has 1:7 and the Pantanal, 1:8. The grassland dominated Pampa has a proportion of 1:31, i.e. one tree species for over 30 species of shrub, subshrub, herb or liana.
Substrate
The majority of plant species throughout Brazilian biomes are terrestrial (Fig. 4), ranging from 83.7% in the Amazon Rainforest through to 75.6 in the Atlantic Rainforest (Tab. 15).
Figure 2 – Angiosperm life-form species number per
biome. The exact values are found in table 14.
The Pantanal has the largest proportion of plants inhabiting aquatic substrates (14.2%), followed by Pampa (7.3%), Caatinga (4.5%), Amazon Rainforest (3.1%), Cerrado (3.0) and Atlantic Rainforest (2.4%). Caatinga (10.3%), Cerrado (9%) and Pampa (8.5%) have a high representativity of rupicolous plant species (Tab. 15). The Atlantic Rainforest is the biome with the highest number of epiphytic species, with 12.2%, followed by the Amazon Rainforest (7%). If taking into account epiphytes plus hemiepiphytes, the number is even higher for the Atlantic Rainforest (13%), followed
Table 13 – Angiosperm species number per Brazilian State and Federal District.
States and Federal District Species number 2015 Endemic species 2015 Endemic species % 2015 Species number 2010 Endemic species 2010 Endemic species % 2010 Total species growth % Endemic species growth % Minas Gerais 11,239 2,245 20.0 10,039 2,158 20.8 8.2 4.0 Bahia 8,970 1,694 18.9 7,686 1,621 21.1 16.7 4.5 Amazonas 8,261 683 8.3 7,528 692 9.2 9.7 -1.3 São Paulo 7,525 329 4.4 6,921 354 5.1 8.7 -7.1 Rio de Janeiro 7,354 1,076 14.6 6,768 1,181 17.4 8.7 -8.9 Pará 6,278 282 4.5 5,626 290 5.2 11.6 -2.8 Paraná 5,891 192 3.3 5,262 188 3.6 12.0 2.1 Mato Grosso 5,729 247 4.3 4,585 262 5.7 25.0 -5.7 Goiás 5,625 496 8.8 4,818 520 10.8 16.7 -4.6 Espírito Santo 5,304 564 10.6 3,971 472 11.9 33.6 19.5 Santa Catarina 4,753 182 3.8 4,112 183 4.5 15.6 -0.5
Rio Grande do Sul 4,238 218 5.1 3,673 177 4.8 15.4 23.2
Acre 4,028 58 1.4 3,740 108 2.9 7.7 -46.3
Mato Grosso do Sul 3,657 73 2.0 2,816 59 2.1 29.9 23.7
Rondônia 3,290 41 1.2 2,544 47 1.8 29.3 -12.8 Distrito Federal 3,223 33 1.0 2,672 36 1.3 20.6 -8.3 Pernambuco 3,133 69 2.2 2,421 76 3.1 29.4 -9.2 Roraima 3,075 34 1.1 2,239 29 1.3 37.3 17.2 Maranhão 2,855 38 1,3 2,414 48 2.0 18.3 -20.8 Amapá 2,655 34 1.3 2,198 37 1.7 20.8 -8.1 Ceará 2,427 47 1.9 1,888 49 2.6 28.5 -4.1 Tocantins 2,306 45 2.0 1,354 48 3.5 70.3 -6.3 Piauí 1,992 30 1.5 1,416 33 2.3 40.7 -9.1 Paraíba 1,837 10 0.5 1,272 9 0.7 44.4 11.1 Alagoas 1,800 11 0.6 1,102 10 0.9 63.3 10.0 Sergipe 1,569 3 0.2 770 2 0.3 103.8 50.0
Rio Grande do Norte 1,222 4 0.3 707 3 0.4 72.8 33.3
by the Amazon Rainforest (9%), Cerrado (3.7%), Caatinga (3%), Pampa (0.9%), and Pantanal (0.8%). Parasitic plants, despite the fact that the Amazon Rainforest (133 species), Cerrado (125) and Atlantic Rainforest (122) present the highest values of hemiparasites (Tab. 15), the largest proportional representation is found in the Pantanal (1.6%), followed by the Caatinga (1.3%). Saprophytes are present in the Amazon Rainforest (0.3%), Atlantic Rainforest (0.2%) and Cerrado (0.1%), but were not recorded so far for Caatinga, Pampa and Pantanal (Tab. 15).
Vegetation types
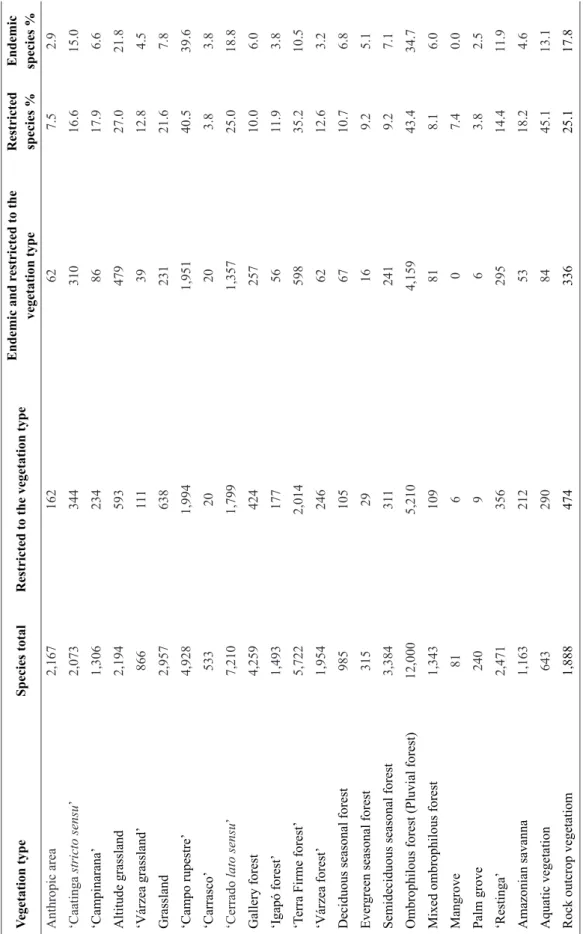
Within the 24 vegetation types recognized by the Brazilian List (Lista do Brasil 2015), including Anthropized areas (Tab. 16), the highest Angiosperm number of species is found in Ombrophilous forest (12,000 species). Analysing only the species total, this is followed by ‘Cerrado lato sensu’ (7,210 species), ‘Terra firme forest’ (5,722) and ‘Campo rupestre’ (4,928), Gallery Forest (4,259 species) and Semideciduous Seasonal Forest (3,384 species). Grassland reaches almost 3,000 species while
Figure 3 – Map of Brazilian biomes showing the
total number of seed plant species (top number), the
number of endemic species (middle number), and the
percentage endemism for each biome. *Podocarpus
barretoi Laubenf. & Silba is the only endemic species
of Gymnosperm.
Figure 4 – Substrate types in the Angiosperms.
‘Restinga’, Altitude Grassland and ‘Caatinga
stricto sensu’, as well as the Anthropized areas, have around 2,000 species records each. All other vegetation types were scored for less than 1,900 species, and the smallest number of species was found in the Mangrove (81 species) (Tab. 16).
Species restricted to a single vegetation type show a slightly different pattern from that found for total species richness (Tab. 16), with Ombrophilous forest (5,210), ‘Terra firme forest’ (2,014), ‘Campo rupestre’ (1,994), ‘Cerrado lato sensu’ (1,799) and Grassland (638) topping the list. Lower richness of endemic species was found in comparison to restricted species, also with differences in relation to their distribution in different vegetation types. The largest number of endemic species per vegetation type was, again, recorded for Ombrophilous forest (4,159), followed by ‘Campo rupestre’ (1,951), ‘Cerrado lato sensu’ (1,357), ‘Terra firme forest’ (598) and Altitude grassland (479). Mangrove had no endemic species, while Palm grove had only six endemic out of 240 species (Tab. 16).
When analysing the relative endemism, the ‘Campo rupestre’ has the highest percentage of endemism (1,951 endemic out of 4,928 species, 39.6%), followed by the Ombrophilous Forest (34.7%), Altitude grassland (21.8%) and ‘Cerrado lato sensu’ (18.8%). Aquatic vegetation has shown the highest percentage of restricted species (45.1%) but much lower endemism, as was also reported for the ‘Terra firme forest’ (35.2%). Vegetation types where the number of restricted species is similar to the number of endemics were ‘Carrasco’, ‘Campo rupestre’, ‘Caatinga stricto sensu’, Palm grove, Mixed ombrophilous forest, ‘Restinga’ and Semideciduous seasonal forest.
While the Angiosperms are present in all vegetation types (Tab. 16), the Gymnosperms occur only in seven of those (Tab. 17), predominantly in the ‘Terra firme forest’ (eight species), Gallery Forest (six) and Amazon savanna (four). The latter, together with the ‘Terra firme forest’ present the highest number of species restricted to these vegetation types, with four each (Tab. 17).
Table 14
– Life-form
of
Angiosperm species
analysed by biome.
The proportion tree:herbaceous was
calculated
by dividing
the tree species from
the sum of
all other
life-forms (shrubs, subshrubs, herbs, lianas). Proportion indicates the real value of trees divided by herbaceous.
Life formsAtlantic Rainfor est Amazon Rainfor est Cerrado Caatinga Pampa Pantanal Tree 3,343 4,725 1,790 886 59 176 Shrub 3,491 2,821 3,380 1,559 190 294 Subshrub 2,102 8,02 3,185 1,120 406 277 Herb 6,663 3,648 5,189 1,812 1,165 632 Liana or climber 1,900 1,901 1,276 643 96 206 Proportion tree:herbaceous 4.2 1.9 7.3 5.8 31.5 8.0 Proportion 1:4 1:2 1:7 1:6 1:31 1:8
Table
15
– Substrate of Angiosperm
species analysed
by
biome.
Numbers between parentheses represent the
percentage
of the
substrate
in
relation
to
the
total
species
number found in the biome.
SubstrateAtlantic Rainfor est Total and (%) Amazon Rainfor est Total and (%) Cerrado Total and (%) Caatinga T otal and (%) Pampa Total and (%) Pantanal Total and (%) Aquatic 395 (2.4) 382 (3.1) 387 (3.0) 230 (4.5) 137 (7.3) 201 (14.2) Epiphyte 1,980 (12.2) 876 (7.0) 419 (3.2) 127 (2.5) 16 (0.9) 7 (0.5) Hemiepiphyte 135 (0.8) 244 (2.0) 62 (0.5) 26 (0.5) 0 (0.0) 4 (0.3) Hemiparasite 122 (0.8) 133 (1.1) 125 (1.0) 65 (1.3) 21 (1.1) 23 (1.6) Parasite 18 (0.1) 9 (0.1) 23 (0.2) 7 (0.1) 4 (0.2) 2 (0.1) Rupicolous 1,273 (7.8) 354 (2.8) 1,177 (9.0) 529 (10.3) 159 (8.5) 48 (3.4) Saprophyte 31 (0.2) 38 (0.3) 16 (0.1) 0 (0.0) 0 (0.0) 0 (0.0) Terrestrial 12,284 (75.6) 10,448 (83.7) 10,864 (83.1) 4,175 (80.9) 1,540 (82.0) 1,135 (79.9)
Table 16
– Angiosperm species number scored for each vegetation type.
Vegetation type
Species total
Restricted to the vegetation type
Endemic and r estricted to the vegetation type Restricted species % Endemic species % Anthropic area 2,167 162 62 7.5 2.9 ‘Caatinga stricto sensu ’ 2,073 344 310 16.6 15.0 ‘Campinarana’ 1,306 234 86 17.9 6.6 Altitude grassland 2,194 593 479 27.0 21.8 ‘Várzea grassland’ 866 111 39 12.8 4.5 Grassland 2,957 638 231 21.6 7.8 ‘Campo rupestre’ 4,928 1,994 1,951 40.5 39.6 ‘Carrasco’ 533 20 20 3.8 3.8 ‘Cerrado lato sensu ’ 7,210 1,799 1,357 25.0 18.8 Gallery forest 4,259 424 257 10.0 6.0 ‘Igapó forest’ 1,493 177 56 11.9 3.8 ‘T
erra Firme forest’
5,722 2,014 598 35.2 10.5 ‘Várzea forest’ 1,954 246 62 12.6 3.2
Deciduous seasonal forest
985 105 67 10.7 6.8 Ever
green seasonal forest
315
29
16
9.2
5.1
Semideciduous seasonal forest
3,384
311
241
9.2
7.1
Ombrophilous forest (Pluvial forest)
12,000
5,210
4,159
43.4
34.7
Mixed ombrophilous forest
1,343 109 81 8.1 6.0 Mangrove 81 6 0 7.4 0.0 Palm grove 240 9 6 3.8 2.5 ‘Restinga’ 2,471 356 295 14.4 11.9 Amazonian savanna 1,163 212 53 18.2 4.6 Aquatic vegetation 643 290 84 45.1 13.1
Rock outcrop vegetatiom
1,888
474
336
25.1
Figure 5 – Above: Distribution map provided to the contributors by the on-line system, showing herbarium records
distributed throughout Brazil and neighbouring countries. Below: Table provided to the contributors by the on-line
system, relating the crosses to the herbarium data and enabling them to see provenance and determiner of each specimen.
Discussion Overall
The continued refinement of the Brazilian List over five years involved intensive review of the data already entered, with the addition of new records for Brazil, synonymization of names into already accepted names, updating names following new taxonomic framework, and specialist checking and accepting newly described species. Species number grew through checking and accepting newly described species and adding new records for Brazil.
While for the Gymnosperms all the included names were checked both in 2010 and 2015, Angiosperm names had around 82% of their names checked in 2010. A considerable number of names (both accepted and synonyms) were added to the system and checked by the specialists. The number of new Angiosperm names included in the system between 2010 and 2015 was 9,274 (11.6%), growing less dramatically in relation to the total numbers, where 16,623 (17.7%) were added, reflecting mostly the activity of the phycology and mycology specialist groups, for which the state of knowledge was always known to be less developed (Maia & Carvalho Jr 2010; Bicudo & Menezes 2010).
In relation to 2010, the number of checked names of Angiosperms grew 30.6%, addressing both the newly included names and the extant, but not yet checked, names from the 2010 edition that were then estimated at 18.5% (calculated from Table 1). The list is now in a much better situation, with almost 94% of its names checked and, wherever possible, either marked as accepted names or as synonyms linked to an accepted name. As an indication, there were 1,191 new names of Angiosperms published for Brazil in the period
between 2010 and 2014 (IPNI 2015). Not all these new taxa were added as accepted species to the list as some of them were considered synonyms by the specialists, but it is likely that a large part of them would have been added. According to Sobral & Stehmann (2009), Brazilian new species represented an average of 7.8% of the plants described for the world between 1990 and 2006. In the years prior to this project (2004-2010), we found that the average percentage of Brazilian plants described compared to the rest of the world was around 8.5%, while from 2010 this figure appears bigger, at 12.2%. An acceleration in the number of species described for Brazil during the period of the project can also be noticed, as from 2004 to 2009 the average species described for Brazil per year was 178.3+/-36 while from 2010 to 2014 the figure increased to 252.6+/-32.1.
New records for Brazil were spotted through the collection, study and naming of new material, much of which was promptly digitalized by herbaria and made available on-line through the portal of the Brazilian List. New records were also highlighted by catalogues, such as Zuloaga et al. (2008) and Jørgensen et al. (2014), floras and monographs (i.e. Medeiros et al. 2014).
Included in the present figures is also the decrease of species numbers resulting from synonymization and changes of circumscription of accepted species, and exclusion of species that were cited for but not effectively located within the national territory thus far.
Better knowledge is becoming available regarding increase in species range beyond the Brazilian borders and prior errors originated by the default setting as ‘endemic’ during the successive revisions of the Brazilian List were corrected. Even taking these readjustments into account, we saw an overall steady increase both for accepted species
Table 17 – Gymnosperm species number scored for each vegetation type.
Vegetation type Species total Restricted to the vegetation type
‘Campinarana’ 3 1
Gallery forest 6 3
‘Terra firme forest’ 8 4
Ombrophilous forest (Pluvial forest) 1 0
Mixed ombrophilous forest 1 0
‘Restinga’ 1 0
totals (3%) and endemic species (4.5%, or 4.1% if we eliminate 62 indications for Anthropized area from Table 16) between 2010 and 2015.
The number of threatened plant species currently found in the Brazilian Red List (Tab. 4) is slightly above 6% the total number of species of seed plant accepted for Brazil. When considering only Brazilian endemic species, the number of threatened plants represents 9.6% of the species. According to Brummitt et al. (2015), the expected number of species endangered worldwide represents around 20-26%. For specialist groups that were globally assessed, such as Cactaceae (Zappi et al. 2012), almost 32% of the species belong to one of the three categories of threat. The smaller proportion currently recorded for Brazil as a whole reflects the fact that the red-listing process in Brazil did not depart from a complete list of taxa, but focused in former lists of endangered species suggested by botanists. In order to get to a realistic picture of how endangered the Brazilian flora really is, a blanket approach studying family by family, species by species is urgently needed.
Top 10 families
This suite of families represents 47.2% of the species richness of Angiosperms in Brazil, having been increased by 68.5% (630 out of the 921 species) in relation to the number of species recorded in 2010 (Forzza et al. 2010). In terms of endemism, the increase was more expressive, at 77%, or 609 of the total of 791 endemic species newly recorded for Angiosperms between 2010 and 2015 belonging to the top 10 families.
The Apocynaceae, formerly the tenth largest family (Forzza et al. 2010), was the only family to be surpassed in species richness by the Malvaceae, number 10 in 2015. Apart from the Poaceae, which has decreased in size by 120 species (-8.6%), the increase in species numbers was between 1 and 26.6% for the largest families, with Rubiaceae (2.1%), Fabaceae (2.3%) and Asteraceae (2.4%) showing the slowest increase while Euphorbiaceae (21.5%) has been the fastest growing family between 2010 and 2015, with a difference well above the 3% found for the Angiosperms as a whole. Two other families that have also markedly increased in size during this period were the Bromeliaceae (11.3%) and the Myrtaceae (11%).
Sobral & Stehmann (2009) pointed out Bromeliaceae as one of the five fastest growing families together with the Orchidaceae,
Fabaceae, Asteraceae and Poaceae. By 2015, while Bromeliaceae continues to grow at a high rate, increase in new species in other families has slowed down, with Orchidaceae at medium pace, Fabaceae and Asteraceae presenting slow increase, and the Poaceae decreased in size through the elimination of over 200 cultivated and introduced species from the present calculations. The increase in the growth speed of the species richness in Euphorbiaceae and Myrtaceae reflects a possible change in the balance of the activities of researchers describing biodiversity in Brazil during the last few years. It is possible that, for less ‘popular’ and more complex, speciose plant families such as these ones, this acceleration may be a direct result of the present project.
In terms of endemism, the three families where the endemism figures grew faster are Euphorbiaceae (26.6%), Bromeliaceae (14%) and Myrtaceae (12.7%), all well above the growth found for Angiosperms as a whole (4.5%). On the other hand, Orchidaceae has only 16 more endemic species than five years ago, increasing its percentage of endemism by only 1%, while Asteraceae had a modest increase of 2.2%.
30 largest genera
Amongst the 30 top genera, 19 belong to the 10 top families, thus influencing the numbers exposed above. The largest species increase took place in
Croton, where the increase of the number of endemic species was also the highest. Following the creation of an international group to study this mega-genus in 2001 (Berry 2015), around 15 new species of Croton
were described between 2010 and 2015, and more new discoveries are being published. However, the 130 species difference cannot be explained by the discovery and description of new species, and it stems from a delay in including existing information (checking all accepted names) that some groups faced during the implementation of the Brazilian List on-line. This is the most high profile example of instances that occurred in other, smaller groups, and by no means the rule within this mainly successful project.
In most cases where there was a significant decrease in species numbers within a genus, the adjustment could be tracked back to a new generic circumscription; for example several species formerly included in Hyptis were transferred to five recently recognized genera (Cantinoa, Cyanocephalus, Eplingiella, Medusantha, Mesosphaerum, and Oocephalus; see Pastore et al. 2011; Harley & Pastore 2012).
Endemism reduction that was linked to a decrease of species number was seen in
Paepalanthus (-16 species) and Leandra (-one species). Adjustments regarding endemism that were not always linked to a reduction in species number were seen in Philodendron (-48 species),
Piper (-12 species), Peperomia (-seven species) and Epidendrum (-one species). The more extreme case, that of Philodendron, can be explained by in-depth research in the Amazonian species, with the study of additional specimens of species previously thought to be endemic to Brazil collected in bordering countries, such as Colombia, combined with the fact that the initial default setting of the Brazilian List was marked ‘ON’ for endemism. Readjustments made within Philodendron show that the endemic species of the genus are, in their majority, from the Atlantic Rainforest. The revision process during the last five years was supported by growing evidence from collections of a vast number of herbaria that went on-line during this period, thus enabling the botanists to visualize species dot maps and perform important corrections for the endemism in their groups (Fig. 5).
The top 10 families have shown a slightly higher proportional growth in endemism than the 30 largest genera that remained collectively similar in terms of their endemism between 2010 and 2015. It is possible that the numbers for the group of 30 top genera were influenced by the dramatic drop in endemism caused by further studies in
Paepalanthus, Piper and Philodendron. Biomes
The overall trend of growing species numbers was maintained, to a certain extent, in data concerning the Brazilian biomes. The almost exclusively Brazilian Atlantic Rainforest and the Cerrado continue to lead in terms of biodiversity and endemism amongst seed plants (Fig. 3), coinciding with the hotspots highlighted by Mittermeier et al. (1998, 2004) and Myers et al. (2000). They are followed by the Amazon Rainforest and the Caatinga; and the Cerrado, a biome currently under severe threat of rapid destruction due to the expansion of the agricultural frontier, has now a wider gap in relation with the Amazon Rainforest through increased species and endemism records added during the last five years.
While the number of species now recorded for the Atlantic Rainforest has increased 7.4% (1,029 species) over the number presented by
Forzza et al. (2010), the records of endemic species has been less expressive, with only 418 extra endemic species, or 6%, added to this biome between 2010 and 2015, causing a fall in endemism percentage from 50.2% (Forzza et al. 2010) to 49.5%. For the Cerrado, the increase in species number was smaller, at 6.3% (713 species), while the endemism increase was also proportionally smaller, at 2.5%, with 102 endemic species record added to this biome, also a fall in the percentage of endemic species from 36.5% (Forzza et al. 2010) to 35.1%. It is possible that this rise in species numbers, yet not followed closely by the increase of endemic species, results from refinement of the knowledge of plant distributions within and beyond each biome, for instance the presence of Atlantic Rainforest species in other biomes by the way of gallery forests in the Cerrado or of enclaves of humid highland forest in the Caatinga, or by species being recorded beyond the Brazilian borders within the same biome (for instance in the Bolivian Cerrado or in the extension of the Atlantic Rainforest into Paraguay and Argentina).
Meanwhile the Caatinga, the only exclusive Brazilian biome, saw an increase of 7.8% (337 species) with 169 records of endemic species added, or an increase of 22.7% from the 2010 data, bringing the percentage of endemic species from 17.2% (Forzza et al. 2010) to 19.7%. This is the only biome where the percentage of endemic species has risen during the 2010-2015 period and this is connected to the local botanical activity in the universities, and may also be related to the compilation of lists and floras that include the Caatinga biome (i.e. Siqueira Filho 2012; Prata
et al. 2013).
Both Pampa and Pantanal, with respectively 340 species (25.3%) and 392 species (44.3%) added, have seen dramatic increases in the biodiversity recorded. In the Pantanal this may be a reflection of recent efforts employed to produce an up-to-date checklist for Mato Grosso do Sul (Farinaccio et al. 2015 no prelo). However, even if the addition of eight endemic species to the 2015 list meant an increase of 17.4%, the overall percentage of endemic species in this biome has decreased from 5.2% to 4.3%, no doubt because a great many species from the Pantanal are also found in Argentina, Bolivia and Paraguay (Sarmiento 1983, Haase & Beck 1989, Larrea-Alcázar et al.
2010). The recent surveys that inform the Bolivian Catalogue (Jørgensen et al. 2014) probably