Journal of Computing and Security
Improving Semi-supervised Constrained k-Means Clustering
Method Using User Feedback
Kavan Fatehi
a,∗
Arastoo Bozorgi
bMohammad Sadegh Zahedi
cEhsan Asgarian
daInformation Processing and Knowledge Discovery Lab,Yazd University, Yazd, Iran.
bFaculty of Electrical and Computer Engineering, Shahid Beheshti University, G.C., Tehran, Iran. cFaculty of Electrical and Computer Engineering, Tehran University, Tehran, Iran.
dFaculty of Electrical and Computer Engineering, Ferdousi Mashhad University, Mashhad, Iran.
A R T I C L E I N F O.
Article history:
Received:08 February 2014
Revised:28 June 2014
Accepted:28 September 2014
Published Online:27 February 2015
Keywords:
Clustering, Semi-supervised using user feedback, Active learning, Boundary data.
A B S T R A C T
Recently, semi-supervised clustering methods have been considered by many researchers. In this type of clustering, there are some constraints and information about a small portion of data. In constrained k-means method, the user (i.e. an expert) selects the initial seeds. In this paper, a constraint k-means method based on user feedback is proposed. With the help of the user, some initial seeds of boundary data obtained from clustering were selected and then the results of the user feedback were given to the constrained k-means algorithm in order to obtain the most appropriate clustering model for the existing data. The presented method was applied to various standard datasets and the results showed that this method clustered the data with more accuracy than other similar methods.
c
2014 JComSec. All rights reserved.
1
Introduction
Data clustering, known as a popular pattern recog-nition techniques, has been used in a wide variety of fields, ranging from web mining, machine learning, image segmentation, and biometric recognition, to electrical engineering, mechanical engineering, remote sensing, and genetics [1]. Many attempts have been made during past years to improve the previous work in the clustering context [2]. Learning methods are divided into three categories: supervised learning,
un-∗ Corresponding author.
Email addresses:[email protected](K. Fatehi),
[email protected](A. Bozorgi),
[email protected](M. S. Zahedi),
[email protected](E. Asgarian)
ISSN: 2322-4460 c2014 JComSec. All rights reserved.
rather, the correlation and structure in the existing data are studied.
As the name suggests, semi-supervised learning is somewhere between unsupervised and supervised learning methods [4]. In this model, for creating a learner model, both labeled and unlabeled data are used; as a result, semi-supervised clustering improves the performance of clustering by learning from the labeled data [5]. In other words, semi-supervised learn-ing is applied to both classification and clusterlearn-ing methods. In semi-supervised classification, the train-ing data include both labeled and unlabeled data; the numbers of unlabeled data are much more than that of the labeled ones [5]. In semi-supervised clustering, the existing data are unlabeled; but, there are some constraints and information about the clusters. These information can be so-called must-link constraints, in which two instances xi and xj must be in the same cluster, and cannot-link constraints, in which xi and xj cannot be in the same cluster [4].
In another categorization, the learning methods are divided into active and passive groups. In active learning methods, which have great semantic similarity to supervised and semi-supervised learning, the goal is to design and analyse learning algorithms which effectively choose the samples to be labeled by an expert [6]. In active learning methods, training data consists of unlabeled data. The goal of the active learner is the same as that of a passive learner [7]. In active learner methods, the learner model can ask for the labels of the training data; actually, by selecting data for labelling, it chooses more accurate data for training. The key idea behind active learning is that the algorithm can achieve greater accuracy with fewer training labels if it is allowed to choose the data from which it learns [8].
Semi-supervised clustering with user feedback is closely related to active learning [9]. In active learning, the learning system attempts to select which data points, if labeled, would be most informative. In semi-supervised clustering, a human selects the data points and puts on them a wide array of possible constraints, instead of labels [9]. Indeed, the goal is to let the user guide the clustering process so that the best clustering model for the data is achieved.
In the current semi-supervised learning methods, the selection of initial seeds for the clustering algorithm is done randomly by the user, which may cause the data to be selected not from all the clusters; as a result, achieving a clustering model with a high degree of accuracy is not possible. Innovation in this paper is the more accurate way of selecting the initial seeds for the constrained k-means algorithm which results in increased accuracy of the algorithm. In this work,
initial clustering was done on the data by applying k-means method and, then using the proposed method, boundary data were appropriately identified from each cluster and selection of the first seeds was done by the user on the boundary data. Results of the user feedback were submitted to constrained k-means algorithm and the clustering steps were guided in a perfect way to reach the most appropriate model for clustering the data.
The rest of the paper is organized as follows: A review of clustering algorithms based on k-means is introduced in the second section of the paper. In the third section, the proposed clustering method is presented. Evaluation criteria for comparing different algorithms, profile of the datasets used for comparing the quality of the proposed clustering methods and the results of evaluating the implemented methods are explained in Section 4. Finally, the last section includes conclusion and suggestions for further research.
2
A review on semi-supervised
cluster-ing algorithms
The clustering algorithms studied in this section are semi-supervised and based on k-means algorithm [10]. These algorithms are organized into two major cate-gories [11]. The first category includes the methods which apply a small number of labeled data for cluster-ing. The other category includes the algorithms which cluster the data according to the stated constraints. Finally, active learning algorithm is studied.
2.1 Algorithms based on labeled data
In this category of algorithms, labeled data are used to initialize the clusters and the restrictions from the data are applied for guiding the process of clustering. 2.1.1 Seeded k-Means algorithm
In seeded k-means algorithm [12], data labeled by the user are used to provide the first number of cluster centers. The cluster center i is the average of the points which possess labeli. Therefore, in this method, the seed clustering is only used for initialization and the seeds are not used in the following steps of the algorithm.
data points remain unchanged and only the label of unseeded data points are allowed to change.
Consequently, like the previous method, constrained k-means algorithm is provided with the initial seeds by the user’s labeled data. These labels remain unchanged during the algorithm process, while they may face change in the seeded k-means method. Constrained k-means method is appropriate when the initial seed labeling is noise-free or when the data labels remain unchanged; on the other hand, seeded k-means is good when the initial labeled data are noisy.
2.2 Algorithms based on constraints about data
In this class of algorithms, there are some constraints among the existing data in the datasets, such as must-link or cannot-must-link constraints between two pieces of data; these constraints are applied in the clustering process. Many semi-supervised clustering algorithms based on constraints have been proposed such as con-strained complete-link [13], constrained EM [14], MR-FKmeans [15], and MPCKmeans [16]. Also, there are some algorithms which are semi-supervised kernel-based algorithms [17,18]. Another type of algorithms which work by maximizing constraint margins can be found in [19–21].
2.2.1 Metric Pairwise Constrained k-Means algorithm
One of the algorithms in this category is Metric Pair-wise Constrained k-Means algorithm [16] which is im-plemented in two steps:
• Initialization of clusters using determined restric-tions by the user.
• Satisfying all the constraints at each iteration of the algorithm.
In other words, this algorithm applies dual con-straints for creating initial clusters and guiding the algorithm throughout its iterations. During the iter-ations, the algorithm is alternating between cluster initialization in E-Step (i.e. set center estimate) and module learning in M-Step. In E-Step, each data x is placed in a cluster such that the total distance of xto the cluster center is minimum, and maximum constraints are met. In M-Step, centers of the sets are double estimated using data from the cluster dataset. 2.2.2 COP k-Means algorithm
Another algorithm is COP k-Means algorithm [21] which is the same as k-Means algorithm for which Must-Link and Cannot-Link constraints are imple-mented on its data points. These two types of
con-straints for sample pairs are defined as follows:
• Must-Link between two data points: this con-straint indicates that two samples must be placed in a single cluster.
• Cannot-Link between two data points: this con-straint shows that two samples cannot exist in one single cluster.
In this method, initial centers are obtained through the use of the stated constraints. Later, any data seg-ment related to those centers for which must-link con-straint has been implemented cannot be selected as a center for another cluster. During the stages of assign-ing data to the cluster, each point is assigned to the nearest cluster which does not violate its constraints. If it is not assigned in that way, the algorithm will terminate.
2.2.3 Pairwise Constrained k-Means algo-rithm
Like previous methods, Pairwise Constrained k-Means algorithm [12] has two types of constraints and, it takes data setX, Must-Link constraints sets between two data points (M), Cannot-Link constraint sets between two data points (C), weight of data (W) and the number of clusters (k) as its input data and returns the independent clusterk.
similar way to k-Means algorithm to update the center of the clusters. Finally, the second and third steps are repeated until the algorithm converges. (Proof of convergence of the algorithm is shown in [11]). 2.3 Active learning
In [22], a method was proposed which is carried out in two steps. In the first step, this algorithm looks forkdata which are located next to each other and each one is in a separate cluster. For this purpose, the farthest-first method is used. At the end of this phase, there must remain at least one data segment from each cluster and these data will be labeled by the user. Later in step two, for each data not existing in the obtained set of neighboring points in phase one, at mostk−1 search is done to find the cluster label of that data. It is achieved based on the closeness of each data to the members of different clusters specified in phase one.
Another algorithm for active learning methods which works according to graphs was given in [23]. This algorithm is a combination of constrained spec-tral clustering and k-means clustering algorithms. It is placed in a category of spectral clustering algorithm, called spectral graph transducer. In order to obtain more information in this method, unlabeled data and data obtained from testing a semi-supervised method are used. Using spectral clustering algorithm can be due to making no assumption about the shape and size proportion of the clusters. According to the number of labels, the algorithm divides the learning points into the following four cases:
• If the labels of the points are converging,
◦ Run the approximate spectral clustering algo-rithm based on k-Means on the data set.
• IfL < θ
◦ Run k-Means algorithm on the unlabeled data and data obtained from the test.
◦ With the help of labeled data and the center of clusters set up a new data set.
◦ Run STG on the new data set.
• IfL >=θ
◦ Run k-Means algorithm on the unlabeled data and test data.
◦ Run k-Means algorithm on the labeled data seperately on each of the two classes.
◦ With the help of the obtained clusters centers, create a new data set.
◦ Perform STG on the new data set.
• IfL=u
◦ Run the set with Linear SVM.
In this algorithm: L is the labeled data, uis the unlabeled data,θis the thereshold limit on the labeled points and SGT is the spectral graph transducer.
3
The proposed algorithm
In this paper, constrained k-means semi-supervised clustering method is introduced. The way of selecting the initial seeds has an important impact on the effec-tiveness of the semi-supervised clustering methods. In constrained k-means clustering method, the user (i.e an expert) selects the first seeds. The expert user se-lects some data for the initial seed and is sure about its placement in a particular cluster while the clustering method most probably will also place the data in the correct cluster. The problem with clustering methods is in setting the boundary data existing between the clusters, in the right cluster; thus, the user is asked to select the initial seeds on the boundary data. The proposed algorithm is shown in algorithm1.
Algorithm 1 Constrained k-means with user feed-back
Input: set of data pointsX ={x1, ..., xn}, number of clustersK
Output: disjointKpartitions{Xl}ofX
1: initialize: do the K-Means algorithm on X =
{x1, ..., xn}data points and make the initial clus-tersH ={h1, ..., hk}
2: boundary data: repeat until convergence 3: foreachhi∈H do
4: xi ∈hi,w= distance ofxifrom hi,y = dis-tance ofxifromhj j6=i,zi=w−y
5: calculate boundary data: set of boundary data pointsB= minziin each clusterhi
6: boundary data selection: 7: foreachhi∈H do 8: select P.Nj
N boundary data fromB 9: end for
10: user feedback: call the user to label the se-lected boundary data
11: do the Constrained K-Means algorithm 12: end for
Clustering data in the proposed method was done in three steps. In the first step, i.e. preprocessing step, the aim was to make a set of clusters as initial clusters which were used in the next steps. The algorithm, used in this step to cluster the data, was k-means algorithm and the number of the clusters was its input.
of sto all other cluster centers was calculated asy. Then, the difference betweenxandywas determined aszfors. This process was done for all data in the present dataset. Finally, in each cluster, the data with minimumzwere the boundary data. After recognizing the boundary data, an important point in selecting the boundary data was that the algorithm may not select boundary data from all the clusters similarly or there might be a cluster, from which no boundary data could be selected. This problem resulted in lacking adequate information about all the clusters and, consequently, decreased accuracy of final clustering. To address this problem, the number of boundary data selected from each cluster was calculated in proportion of the total data. The number of data selected from cluster j followed the next equation.
P.Nj
N (1)
In equation1,N is the total number of data,Nj is the number of data in clusterj, andP is the number of data the user can label. Thus, boundary data were selected from all clusters uniformly. Then, an expert user was asked to determine the labels of the selected boundary data In the last step of this approach, con-strained k-means algorithm was used to do the final clustering process over the remaining data.
4
Results and Evaluation
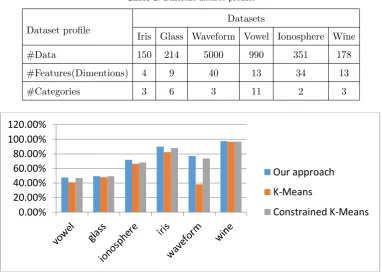
4.1 Data setTo evaluate the effectivity of clustering algorithms, Standard DataSet UCI1 was used. The data set profile is displayed in Table1.
4.2 Evaluation criteria
To compare and evaluate the clustering methods in this research, Accuracy, ARI and NMI were used which are explained in this section.
4.2.1 Accuracy criterion
The accuracy criterion [22] identifies the data rate which has been correctly clustered. For this purpose, the two criteria of sensitivity and specificity are used. Sensitivity indicates the ratio of true positive values (positive values which are truly identified) to all pos-itive values and specificity shows the ratio of true negative values (negative values which are correctly recognized) to all negative values.
1 http://archive.ics.uci.edu/ml/datasets.html
sensitivity=tpos
pos (2)
specif icity= tneg
neg (3)
In Equation2,tposis the number of true positive values andposshows the number of positive values.
In Equation3,tnegis the number of true negative values. According to equation4it can be said that accuracy is a function of sensitivity and specificity.
Accuracy= (sensitivity∗ pos
pos+neg) + (specif icity∗ neg
pos+neg) (4)
4.2.2 ARI (Adjusted Rand Index) criterion To compare the results obtained from clustering base on an external criterion, ARI criterion [22,24] is used. IfUis the external criterion,V the results of clustering, nijthe number of existing objects in both ui group andvj cluster, andni andnj the number if objects inui group andvjcluster, then the ARI criterion is calculated according to Equation5.
P
ij nij
2
−[P
i ni
2
.P
j nj
2
]/ n2
1 2[
P
i ni
2
+P
j nj
2
]−[P
i ni
2
.P
j nj
2
]/ n2 (5)
4.2.3 NMI
This criterion specifies the amount of statistical infor-mation generated by random variables that represent cluster initialization and group labeling done by the user. NMI measure calculates the extent to which the algorithm correctly clusters the labeled data.
N M I = I(C;K)
(H(C) +H(K))/2 (6) In Equation6,Cis the random variable which rep-resents initializations of the points inside the cluster, andKis the random variable representing the label of the groups.
I(X;Y) =H(X)−H(X|Y) represents the mutual information between variablesX andY,H(X) is the Shannon expansion of variableX andH(X|Y) is the Shannon expansion ofX ifY.
278 Improving Semi-supervised Constrained k-Means Clustering Method . . . — K. Fatehi, A.Bozorgi, et al.
Table 1. Different dataset profiles
Dataset profile
Datasets
Iris Glass Waveform Vowel Ionosphere Wine
#Data 150 214 5000 990 351 178
#Features(Dimentions) 4 9 40 13 34 13
#Categories 3 6 3 11 2 3
variables that represent cluster initialization and group labeling done by the user. NMI
measure calculates the extent to which the algorithm correctly clusters the labeled data.
(
;
)
(
(
)
(
) ) / 2
I C
K
N M I
H C
H
K
(6)
In equation 6, C is the random variable which represents initializations of the points
inside the cluster, and K is the rendom variable representing the label of the groups.
I(X;Y) = H(X) – H(X \ Y) represents the mutual information between variables X and
Y, H(X) is the Shannon expansion of variable X and H(X \ Y)is the Shannon expansion
of X if Y.
To evaluate the proposed method and compare it with the two methods of constraint
k-means and k-k-means, it was implemented on the described data sets and the results
relating to CCI, NMI, AND ARI have been displayed in figures 2,3, and 4.
As it is clear from figure 2, the proposed method in CCI criterion, has a better
performance in all data sets except in glass. The maximum improvement in relation to
constraint k-means was 3.53% in ionosphere data set, and the maximum improvement
relating to k-means was 38.70 % in waveform data set.
The highest rates of improvement in NMI standard in relation to constraint k-means
and k-means were 11.22 % and 42.5% respectively in Iris data set. Also, the
improvement of the proposed method in ARI criterion relating to constraint k-means
and k-means were calculated 5.45 % and 40.15% respectively in Iris data set. Figures
3 and 4 illustrate the results related to NMI and ARI criteria.
Fig. 2.
Comparing the results obtained from implementing constraint k-means and k-means methods by the proposed method based on CCI criterion0.00%
20.00%
40.00%
60.00%
80.00%
100.00%
120.00%
Our approach
K-Means
Constrained K-Means
Figure 1. Comparing the results obtained from applying constrained k-means, k-means methods and the proposed method based on CCI criterion
Fig. 3.
Comparing the results obtained from implementing constraint k-means and k-means methods by the proposed method based on NMI criterionFig. 4.
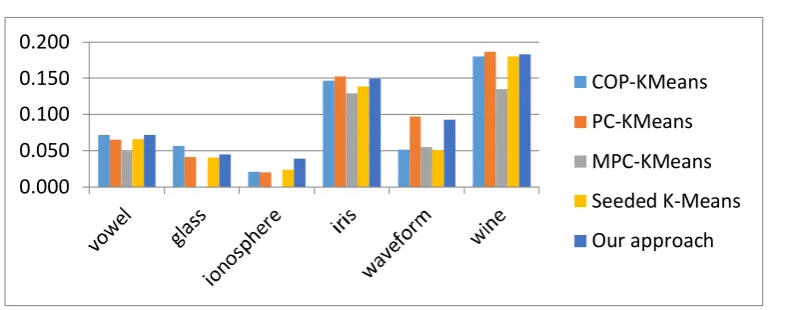
Comparing the results obtained from implementing constraint k-means and k-means methods by the proposed method based on ARI criterionFigures 5, 6 and 7 present the results of comparing the accuracy of our approach with
semi-supervised clustering methods. Compared to other methods the proposed method
achieved better results on most of the data sets; it has the best performance of all the
methods in CCI criterion on vowel, ionosphere, waveform and wine data sets. For NMI,
it achieves the best results in vowel, ionosphere and iris and in other data sets there is a
very slight difference between the proposed method and the best method. Also, in ARI
criterion, it achieved the best results for most of the data sets in comparison with other
methods. Our method has better results than Seeded K-Means and MPC-KMeans in all
datasets. As we can see in the results shown in figures 2-7, our proposed method has
better results than Seeded K-Means and Constrained K-Means on all datasets, because
Seeded K-Means and Constrained K-Means selects the initial seeds randomly, but our
method selects the initial seeds by user feedback and it causes our method has better
results. By this, we can see the effect of selecting initial seeds as the manner we use on
the functionality of the semi-supervised clustering algorithm.
0.000
0.050
0.100
0.150
0.200
Our approach
K-Means
Constrained K-Means
0.000
0.050
0.100
0.150
0.200
Our approach
K-Means
Constrained K-Means
Figure 2. Comparing the results obtained from applying constrained k-means, k-means methods and the proposed method based on NMI criterion
displayed in Figures1,2,3.
As shown in Figure1, based on CCI criterion, the proposed method has a better performance in all data sets except in glass. The maximum improvement in re-lation to constrained k-means was 3.53% in ionosphere data set, and the maximum improvement relating to k-means was 38.70% in waveform data set.
Based on NMI standard, the highest rates of im-provement in relation to constrained means and k-means were 11.22% and 42.5% respectively in Iris data set. Also, improvement of the proposed method based
on ARI criterion relating to constrained k-means and k-means were calculated 5.45% and 40.15% respec-tively in Iris data set. Figures2and3illustrate the results related to NMI and ARI criteria.
October 2014, Volume 1, Number 4 (pp. 273–281) 279
Fig. 3.
Comparing the results obtained from implementing constraint k-means and k-means methods by the proposed method based on NMI criterionFig. 4.
Comparing the results obtained from implementing constraint k-means and k-means methods by the proposed method based on ARI criterionFigures 5, 6 and 7 present the results of comparing the accuracy of our approach with
semi-supervised clustering methods. Compared to other methods the proposed method
achieved better results on most of the data sets; it has the best performance of all the
methods in CCI criterion on vowel, ionosphere, waveform and wine data sets. For NMI,
it achieves the best results in vowel, ionosphere and iris and in other data sets there is a
very slight difference between the proposed method and the best method. Also, in ARI
criterion, it achieved the best results for most of the data sets in comparison with other
methods. Our method has better results than Seeded K-Means and MPC-KMeans in all
datasets. As we can see in the results shown in figures 2-7, our proposed method has
better results than Seeded K-Means and Constrained K-Means on all datasets, because
Seeded K-Means and Constrained K-Means selects the initial seeds randomly, but our
method selects the initial seeds by user feedback and it causes our method has better
results. By this, we can see the effect of selecting initial seeds as the manner we use on
the functionality of the semi-supervised clustering algorithm.
0.000
0.050
0.100
Our approach
K-Means
Constrained K-Means
0.000
0.050
0.100
0.150
0.200
Our approach
K-Means
Constrained K-Means
Figure 3. Comparing the results obtained from applying constrained k-means, k-means methods and the proposed method based on ARI criterion
Fig. 5.
Comparison of the results obtained from implementation of semi-supervised methods and the proposed method based on CCI criterionFig. 6.
Comparison of the results obtained from implementation of semi-supervised methods and the proposed method based on NMI criterionFig. 7.
Comparison of the results obtained from implementation of semi-supervised methods and the proposed method based on ARI criterion0.00%
20.00%
40.00%
60.00%
80.00%
100.00%
120.00%
COP-KMeans
PC-KMeans
MPC-KMeans
Seeded K-Means
Our approach
0.000
0.050
0.100
0.150
0.200
COP-KMeans
PC-KMeans
MPC-KMeans
Seeded K-Means
Our approach
0.000
0.050
0.100
0.150
0.200
COP-KMeans
PC-KMeans
MPC-KMeans
Seeded K-Means
Our approach
Figure 4. Comparison of the results obtained from implementation of semi-supervised methods and the proposed method based on CCI criterion
Fig. 5.
Comparison of the results obtained from implementation of semi-supervised methods and the proposed method based on CCI criterionFig. 6.
Comparison of the results obtained from implementation of semi-supervised methods and the proposed method based on NMI criterionFig. 7.
Comparison of the results obtained from implementation of semi-supervised methods and the proposed method based on ARI criterion0.00%
20.00%
40.00%
60.00%
80.00%
100.00%
120.00%
COP-KMeans
PC-KMeans
MPC-KMeans
Seeded K-Means
Our approach
0.000
0.050
0.100
0.150
0.200
COP-KMeans
PC-KMeans
MPC-KMeans
Seeded K-Means
Our approach
0.000
0.050
0.100
0.150
0.200
COP-KMeans
PC-KMeans
MPC-KMeans
Seeded K-Means
Our approach
Figure 5. Comparison of the results obtained from implementation of semi-supervised methods and the proposed method based on NMI criterion
In other data sets there is a very slight difference be-tween the proposed method and the best method. Also, based on ARI criterion, it achieves the best results for most of the data sets compare to other methods. This method has better results than Seeded K-Means and MPC-K-Means in all datasets. As can be seen in the results shown in Figures 1- 6, the proposed method has better results than Seeded K-Means and
280 Improving Semi-supervised Constrained k-Means Clustering Method . . . — K. Fatehi, A.Bozorgi, et al.
Fig. 5.
Comparison of the results obtained from implementation of semi-supervised methods and the proposed method based on CCI criterionFig. 6.
Comparison of the results obtained from implementation of semi-supervised methods and the proposed method based on NMI criterionFig. 7.
Comparison of the results obtained from implementation of semi-supervised methods and the proposed method based on ARI criterion0.00%
20.00%
40.00%
60.00%
80.00%
PC-KMeans
MPC-KMeans
Seeded K-Means
Our approach
0.000
0.050
0.100
0.150
0.200
COP-KMeans
PC-KMeans
MPC-KMeans
Seeded K-Means
Our approach
0.000
0.050
0.100
0.150
0.200
COP-KMeans
PC-KMeans
MPC-KMeans
Seeded K-Means
Our approach
Figure 6. Comparison of the results obtained from implementation of semi-supervised methods and the proposed method based on ARI criterion
5
Conclusion
In this paper, various data clustering methods were studied and attempts were made to present a method for applying the user feedback to improve clustering results. The focus of this study was on semi-supervised learning with user feedback which had a close relation-ship with active learning method. The goal of active learning is to specify data samples and label them by an expert user to obtain more information about data clusters and models; however, in semi-supervised method using the user feedback, the user is allowed to provide the system with only the information and constraints about the data without knowing about the labels of the data. The aim was to let the user guide the clustering process in a way to obtain the most ap-propriate clustering model for the existing data. As a result, the boundary data were identified first and then the user was asked to label them; after labeling them by the user, a semi-supervised clustering method was applied for the final clustering. In fact, the main goal of this study was not to present a new approach of semi-supervised clustering, rather the innovation is in providing a method to maintain an interaction between the user and clustering system for achieving better results. The results indicated that implement-ing user feedback led to improvement in CCI, NMI, and ARI criteria on different standard datasets. Thus, the study paved the way for further studies on apply-ing user feedback in clusterapply-ing methods. Due to the similarity between semi-supervised methods with user feedback and active learning methods, it can be said that active learning methods can be used in the same way as well. In addition, more accurate ways can be used for selecting the boundary data.
References
[1] Lei Gu and Xianling Lu. Semi-supervised sub-tractive clustering by seeding. InFuzzy Systems
and Knowledge Discovery (FSKD), 2012 9th In-ternational Conference on, pages 738–741. IEEE, 2012.
[2] Anil K Jain. Data clustering: 50 years beyond k-means. Pattern Recognition Letters, 31(8):651– 666, 2010.
[3] Xiaojin Zhu and Andrew B Goldberg. Introduc-tion to semi-supervised learning. Synthesis lec-tures on artificial intelligence and machine learn-ing, 3(1):1–130, 2009.
[4] Ming Wei Leng, Xiao Yun Chen, Jian Jun Cheng, and Long Jie Li. Semi-supervised clustering algo-rithm based on small size of labeled data.Applied Mechanics and Materials, 121:4675–4679, 2012. [5] Yoram Baram, Ran El-Yaniv, and Kobi Luz.
On-line choice of active learning algorithms. The Journal of Machine Learning Research, 5:255–291, 2004.
[6] Daniel Joseph Hsu. Algorithms for active learning. 2010.
[7] Burr Settles. Active learning literature sur-vey. University of Wisconsin, Madison, 52:55–66, 2010.
[8] David Cohn, Rich Caruana, and Andrew McCal-lum. Semi-supervised clustering with user feed-back. Constrained Clustering: Advances in Al-gorithms, Theory, and Applications, 4(1):17–32, 2003.
[9] James MacQueen et al. Some methods for classi-fication and analysis of multivariate observations. InProceedings of the fifth Berkeley symposium on mathematical statistics and probability, volume 1, pages 281–297. California, USA, 1967.
[10] Hien Phuong Lai, Muriel Visani, Alain Boucher, and Jean-Marc Ogier. A new interactive semi-supervised clustering model for large image database indexing. Pattern Recognition Letters, 37:94–106, 2014.
InIn Proceedings of 19th International Confer-ence on Machine Learning (ICML-2002. Citeseer, 2002.
[12] Dan Klein, Sepandar D Kamvar, and Christo-pher D Manning. From instance-level constraints to space-level constraints: Making the most of prior knowledge in data clustering. 2002. [13] Noam Shental, Aharon Bar-Hillel, Tomer Hertz,
and Daphna Weinshall. Computing gaussian mixture models with em using equivalence con-straints. Advances in neural information process-ing systems, 16(8):465–472, 2004.
[14] Sugato Basu, Mikhail Bilenko, and Raymond J Mooney. A probabilistic framework for semi-supervised clustering. In Proceedings of the tenth ACM SIGKDD international conference on Knowledge discovery and data mining, pages 59– 68. ACM, 2004.
[15] Brian Kulis, Sugato Basu, Inderjit Dhillon, and Raymond Mooney. Semi-supervised graph clus-tering: a kernel approach. Machine learning, 74 (1):1–22, 2009.
[16] Bojun Yan and Carlotta Domeniconi. An adap-tive kernel method for semi-supervised cluster-ing. In Machine Learning: ECML 2006, pages 521–532. Springer, 2006.
[17] Fei Wang. Semisupervised metric learning by maximizing constraint margin. Systems, Man, and Cybernetics, Part B: Cybernetics, IEEE Transactions on, 41(4):931–939, 2011.
[18] Hong Zeng and Yiu-ming Cheung. Semi-supervised maximum margin clustering with pair-wise constraints. Knowledge and Data Engineer-ing, IEEE Transactions on, 24(5):926–939, 2012. [19] Alexis Mignon and Fr´ed´eric Jurie. Pcca: A new
approach for distance learning from sparse pair-wise constraints. InComputer Vision and Pattern Recognition (CVPR), 2012 IEEE Conference on, pages 2666–2672. IEEE, 2012.
[20] Mikhail Bilenko, Sugato Basu, and Raymond J Mooney. Integrating constraints and metric learn-ing in semi-supervised clusterlearn-ing. InProceedings of the twenty-first international conference on Machine learning, page 11. ACM, 2004.
[21] Kiri Wagstaff, Claire Cardie, Seth Rogers, Stefan Schr¨odl, et al. Constrained k-means clustering with background knowledge. InICML, volume 1, pages 577–584, 2001.
[22] Zal´an Bod´o, Zsolt Minier, and Lehel Csat´o. Ac-tive learning with clustering. Active Learning Challenges in Machine Learning, Volume 6, page 141, 2011.
[23] Jiawei Han, Micheline Kamber, and Jian Pei. Data mining: Concepts and techniques, (the mor-gan kaufmann series in data management sys-tems). 2006.
[24] Ka Yee Yeung and Walter L Ruzzo. Details of the adjusted rand index and clustering algorithms, supplement to the paper an empirical study on principal component analysis for clustering gene expression data. Bioinformatics, 17(9):763–774, 2001.
Kavan FatehiReceived MS degree in artifi-cial intelligence from University of Yazd. He is currently member of Information Process-ing and Knowledge Discovery Lab in Univer-sity of Yazd. He is interested in data mining, machine learning and information retrieval. Arastoo BozorgiReceived the BS degree in computer engineering from Shahid Bahonar University of Kerman in 2010, and the MS de-gree in software engineering from the Shahid Beheshti University in 2013, Tehran. His cur-rent research interests include social network analysis, graph mining and information re-trieval.
Mohammad Sadegh ZahediReceived the BS degree in Software Engineering (2010) from the University of Zanjan and MS degree in Software Engineering (2103) from Univer-sity of Tehran, Department of Electrical and Computer Engineering. He is currently mem-ber of Database Research Group (DBRG) in University of Tehran. His research interests include information retrieval, social network analysis and data mining.