A Modular Approach to Finer Classification
of ECG Signals
Neethu S. Ravi1, Prof. Paul Thomas2
PG Student [Signal Processing], Dept. of ECE, Mar Baselios College of Engineering and Technology, Kerala, India 1
Professor [Dean (PG)], Dept. of ECE, Mar Baselios College of Engineering and Technology, Kerala, India 2
ABSTRACT:ECG is electrocardiogram which determines the electrical activity of human heart. Cardiologists visually analyse lengthy ECG records to arrive at appropriate conclusion regarding diagnosis. But this a time consuming process and at the same time we cannot rule out the possibility of missing some minutiae details of ECG. Thus automated analysis of ECG signals plays an important role for detecting different cardiac arrhythmia. A modular approach for classification of ECG signals using a classifier module consisting of ANN and Fuzzy Logic is specified in this paper. The work includes two levels for classification. First level classification includes detection of common cardiac disorders into four classes which includes Normal Sinus Rhythm (NSR), Atrial Arrhythmias (AA), Ventricular Arrhythmias (VA) and Myocardial Infarction (MI). Second level classification includes categorization of classes in first level into more specific disorders. Atrial Arrhythmias are further classified into Atrial Fibrillation (AF) and Supraventricular Arrhythmia (SVA). Ventricular Arrhythmias are further classified into Premature Ventricular Contraction (PVC), Ventricular Tachycardia (VT) and Maligant Ventricular Ectopy (MVE). ECG signals used for this work are taken from the standard MIT-BIH database, Physionet database and CU database. A novel method is used to findout the signal length mathematically. Temporal and spectral features are extracted from the ECG signals. These fundamental features are used in the classification section, where the classifier module classifies the signal into its corresponding classes. This work achieved a classification accuracy of about 96.7%.
KEYWORDS: ECG, Atrial Arrhythmias, Ventricular Arrhythmias, NSR, MI, PVC, VT, AF, SVA, LTAF, MVE, ANN, Fuzzy Logic.
I.INTRODUCTION
leakage and Spectral Band Amplitude [10]. JCTB Moraes et. al. proposed a method for classification of ECG signals by using Leakage Measure as a feature [11]. Yun Chi The et. al. proposed a method for classification of ECG signals using Fuzzy logic [12].
Different methods reported in the literature survey include only a small set of diverse characteristic features of ECG signals. But this work uses a modular approach for classification of ECG signals using a classifier module consisting of ANN and Fuzzy Logic and the extracted temporal and spectral [3] features from ECG signals which rule out the hidden information from ECG signals and its diverse characteristics. Signals taken from CU database, MIT-BIH database and Physionet database are used for this automated analysis. Fundamental features extracted from the ECG signals are used for classifying the signal into multiple cardiac disorders. The work uses one set of normal ECG signals and 7 sets of diseased ECG signals. In this modular approach, classifier module I in first level classification categories the signal into four classes. Second level classification categories the first level classes like Atrial Arrhythmias and Ventricular Arrhythmias into 2 and 3 subgroups by using classifier modules II and III respectively. Extracted features are given as input to ANN for training and to the trained ANN architecture fundamental feature extracted from the test signals are given as input. Output obtained from ANN is fed to fuzzy inference system to obtain fuzzified output and classification of ECG signal is done based on this fuzzy output.
II.MATERIALS
Data collection plays an important role in this work. Signals collected from CU database, MIT-BIH database and Physionet database are used in this work. The collected ECG signals include 124 signals belonging to MI with a sampling frequency of 1000Hz, 12 signals belonging to NSR with a sampling frequency of 128Hz, 47 signals belonging to Premature Ventricular Contraction (PVC) with a sampling frequency of 360Hz, 12 signals belonging to Maligant Ventricular Ectopy (MVE) with a sampling frequency of 250Hz , 17 signals belonging to Ventricular Tachycardia (VT) with a sampling frequency of 250Hz, 50 signals belonging to Supraventricular Arrhythmias (SVA) with a sampling frequency of 128Hz, 60 signals belonging to Long Term Atrial Fibrillation (LTAF) with a sampling frequency of 128Hz and 12 signals belonging to Atrial Fibrillation (AF) with a sampling frequency of 250Hz. Database also consists of other details regarding the signals. The work uses designing tools like MATLAB, Neural Network toolbox (nnstart), Fuzzy Inference System (FIS) toolbox and Guide (GUI) toolbox. Programming tool used to implement this work is MATLAB and nnstart is used for classification and FIS is used to improve the classification. The final work is made user friendly with GUI.
III.ECG SIGNAL LENGTH SELECTION
Selection of signal length plays a very important role for determining the quality of features during ECG signal analysis. From various literature surveys it is seen that for ECG signal analysis the commonly used signal length is 3seconds and there is no information regarding the choice of signal length is available. So this work used a novel method to find out the signal length mathematically. The long train Normal ECG signal is broken down into fifty small segments of a common duration starting with 1 second. All features are extracted and the process is repeated for different time periods of the signal. The extracted features are analyzed for best consistency. Duration of the signal is increased in steps of 1 seconds and feature extractions repeated. It is seen that a signal segment of 10seconds duration is a good fit for the different features and across different diseases.
IV. FEATURE EXTRACTION METHODS
This work includes the extraction of temporal and spectral features from the ECG signals during the analysis. Temporal features include Mean Absolute Value (MAV) and Threshold Crossing Count (TCC). Spectral features include Wavelet Mean (WM), Wavelet Standard deviation (WSD), Skewness (SKW), and Kurtosis (KURT), Peak frequency (PF), Mean frequency (MF),Spectral moment (SM), Spectral band amplitude (SBA) and VF-leakage (VFL). 1. Threshold Crossing Count (TCC)
TCC [4] is the number of times the signal crosses a pre-defined threshold value. Threshold is set as 80% of the maximum amplitude of the ECG signal.
2. Mean Absolute Value (MAV)
MAV [4],[5] is the mean of absolute value of ECG samples calculated using the formula,
where, x is the absolute amplitude values of the signal, Lis the signal length.
3. Wavelet Mean (WM)
4-level (Daub4) wavelet decomposition is applied on to the ECG signal and mean 4th level approximation coefficient is calculated by using the formula [6],[7],
WM = ∑ (x ) (2)
where, L is the length of 4th level approximation coefficients, x is the approximation coefficients.
4. Wavelet Standard Deviation (WSD)
4-level (Daub4) wavelet decomposition is applied on to the ECG signal and standard deviation 4th level approximation coefficient is calculated by using the formula [6],[7],
= ( ∑ ( − ) ) / (3)
where, L is the length of 4th level approximation coefficients , xi is the wavelet coefficient and m wavelet coefficients mean.
5. Skewness (SKW)
Skewness is the measure of asymmetry of the signal and is calculated by applying 4-level (Daub4) wavelet decomposition on to the ECG signal [6],[7]. Skewness of the 4th level approximation coefficient is calculated using the formula,
SKW = ∑ ( )
( ) (4)
where, L is the length of 4th level approximation coefficient SD is the standard deviation, x is the approximation coefficient, m is the mean of the approximation coefficients.
6. Kurtosis (KURT)
Kurtosis is used to check whether the samples are flat or peaked with respect to normal distribution [6],[7]. KURT is calculated by applying 4-level (Daub4) wavelet decomposition on to the ECG signal by using the formula,
KURT = ∑ ( )
( ) (5)
where, L is the length of 4th level approximation coefficient, SD is the standard deviation, x is the approximation coefficient, m is the mean of approximation coefficient.
7. Peak Frequency (PF)
Frequency corresponding to the maximum amplitude in the spectral domain is the Peak Frequency [8]. 2-level wavelet decomposition is applied on to the ECG signal and an N-point FFT is done on to the 2nd level approximation coefficients .PF is computed from the obtained spectrum.
PF = max(x ), 1≤i≤L (6)
where, xi is the spectral amplitude at the FFT point i.
8. Mean Frequency (MF)
Central frequency of power spectrum is known as Mean Frequency [9]. ECG signal is subjected to an N - point FFT is to obtain FFT sample values and frequency in spectral domain. Power is calculated by taking square of FFT samples values. MF is calculated by using the formula,
= ∑ ( ∗ )
∑ (7)
where pi is the spectral power at the frequency fpi.
9. Spectral Moment (SM)
FFT is applied on to the ECG signal to calculate SM [10] of the using the formula,
SM = ∑ ( ∗ )
∑ ( ) (8)
10. Spectral Band Amplitude (SBA)
ECG signal is applied with FFT to obtain FFT sample values and frequency in spectral domain. SBA [10] is obtained by taking the ratio of the sum of FFT sample value between 0.7f and 1.4f and the sum of FFT sample values between 0.5Hz and minimum of 20f and 100Hz where f is the peak frequency.
11. VF Leakage (VFL)
ECG signal is applied with FFT to obtain FFT sample values and VFL is calculated using the formula [10],[11]
VFL =
∑ / |( )|
∑ / (| | | |) (9)
where, T/2 is the half time period of the signal, L is the length of ECG signal and x is the amplitude of the signal and T=f/fs where, fs is the sampling frequency and f is the amplitude corresponding to the highest amplitude in spectral domain.
By using above methods temporal and spectral features from ECG signals are extracted and corresponding feature vectors are obtained. Features from 72 signals are used as training set. For classification of Atrial arrhythmias and Ventricular arrhythmias two neural network architectures are trained using 36 samples respectively.
V. CLASSIFICATION METHOD
Classifier module consisting of ANN and Fuzzy is used for the classification of multiple cardiac disorders. ANN is used to model biological neurons using mathematical operations [6],[7]. Neurons are the main processing elements of ANN which functions similar to that of biological neurons. ANN is trained using supervised learning rule. By proper and correct selection of features during training can reduce the error occurring at the ANN output and makes ANN better than other classifiers. ANN consists of three layers - input layer, hidden layer and output layer. Input layer is the layer through which inputs are given to ANN. Number of input neurons in the input layer is equal to the number of features that we are giving as input to ANN. Hidden layer is the layer which all computations are carried out and has no contact with the outside world. Output layer is used to obtain the output and the number of output neurons in output layer is equal to the number of classes in classification. Selection of neural network is done by trial and error method. ECG signal classification is done using pattern recognition network and linear vector quantisation. A total of 110 signals are taken for this selection purpose. 50 signals are used for training the network. Out of 110 signals 105 signals are correctly detected by pattern recognition network. Only 80 signals out of 110 signals are correctly detected by linear vector quantisation network. Based on these obtained results an inference is made that, pattern recognition neural network gives better classification accuracy than linear vector quantisation network. This work uses pattern recognition network for classifying multiple cardiac disorders.
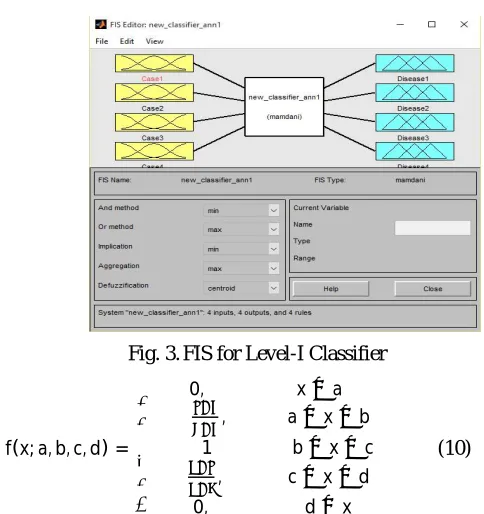
Arrhythmias or Ventricular Arrhythmias then it goes to second level of classification. ANN architecture for First level, Trapezoidal Membership Function and FIS for Level-I are shown in Figure1, 2 and 3respectively. Rule set for Level-I is shown in Table I.
Fig. 1. Level I ANN Architecture
Fig. 2.Trapezoidal Membership Function
Fig. 3.FIS for Level-I Classifier
f(x; a, b, c, d) =
⎩ ⎪ ⎨ ⎪
⎧ 0, x≤a , a≤x≤b 1 b≤x≤c
, c≤x≤d 0, d≤x
(10)
where, x is the input, a,b,c and d are the parameter specifying the range.
TABLE I. RULE SET FOR FIRST LEVEL
Rule Set
2 1 1 1
1 2 1 1
1 1 2 1
Second level classification mainly classifies Atrial Arrhythmias and Ventricular Arrhythmias into smaller 2 and 3 subgroups respectively. For Atrial Arrhythmias, Classifier module-II consisting of ANN-II and FIS-II is used. ANN-II is trained by giving 11 features from each 36samples are given as input (number of input neurons=11). 11 features given as input to ANN are TCC, MAV, WM, WSD, SKEW, KURT, PF, MF, SM, SBA and VFL. Number of hidden neurons in hidden layer is taken as 20. Number of output neurons in the output layer is taken as 2 since Atrial Arrhythmias is classified into 2 classes. Once the network is trained, a neural architecture is obtained and using this architecture the classification of test signal is achieved. Feature vector from the test signal is given as input to the obtained architecture for ANN-II and corresponding ANN output is obtained. Obtained ANN output is given to FIS. ‘.fis file’ with 2 inputs, 2 output and 2 rules is created using fuzzy toolbox and the obtained .fis file and ANN-II output is evaluated to obtain the corresponding FIS-II output. Based on the obtained FIS-II output classification of Atrial Arrhythmias into Atrial Fibrillation (AF) and Supraventricular Arrhythmia (SVA) is achieved. ANN architecture and FIS for Atrial Arrhythmias are shown in Figure 4 and 5 respectively. Rule set for Atrial Arrhythmias is shown in Table II.
TABLE II. RULE SET FOR ATRIAL ARRHYTHMIAS
Rule Set
2 1
1 2
Fig. 4. ANN Architecture for Atrial Arrhythmias
Fig. 5. FIS for Atrial Arrhythmias
corresponding FIS-III output. Based on the obtained FIS-III output classification of Ventricular Arrhythmias into Premature Ventricular Contraction (PVC), Ventricular Tachycardia (VT) and Maligant Ventricular Ectopy (MVE) is achieved. ANN architecture and FIS for Ventricular Arrhythmias are shown in Figure 6 and 7 respectively. Rule set for Atrial Arrhythmias is shown in Table III.
TABLE III. RULE SET FOR VENTRICULAR ARRHYTHMIAS
Rule Set
2 1 1
1 2 1
1 1 2
Fig. 6. ANN Architecture for Ventricular Arrhythmias
Fig. 7. FIS for Ventricular Arrhythmias
V. RESULTS AND DISCUSSIONS
TABLE IV. TEMPORAL FEATURES
Cardiac Disorders
Temporal Features MAV(mV) TCD(ms)
NSR
0.384
5
AF
0.5894
6
MI
1.3754
1
PVC
0.8872
2
SVA
0.3332
2
VT
0.2649
3
LTAF
0.6199
7
MVE
0.4445
2
TABLE V. SPECTRAL FEATURES
Cardiac Disorders Spectral Features WM (mV) WSD (mV) SKEW (mV) KURT (mV) PF (Hz) MF (Hz) VFL (mV) SM (mV) SBA (mV)
NSR
-42.5308
0.589
1.085
3.095
15.25
19.7
0.7703
0.1094 0.1463
AF
-203.7498
72.352
0.3083
2.82
26
38.8
0.9657
0.148
0.9685
MI
-299.65
1.4793
2.1738
4.675
108.67
158.65
0.9825
0.5078 1.0061
PVC
3.903
123.45
1.5774
6.8995
37.6
79.98
1
0.0182 0.3398
SVA
34.7345
74.16
0.3133
2.901
14.17
20.12
0.8818
0.1082 0.2729
VT
1.7137
1.2766
1.4587
5.35
25.64
40.25
0.8989
0.5711 0.1135
LTAF
-12.68
4.5265
0.7928
1.69
13.34
16.67
0.8744
0.02
0.0658
MVE
3.8464
92.42
0.2475
4.46
26.47
24.92
0.9998
0.48
0.1268
TABLE VI. CLASSIFICATION ACCURACY FOR CLASSIFIER MODULES
Parameters Classifier Module-I Classifier Module-II Classifier Module-III
Accuracy (%) 96.7 100 95
TABLE VII. SENSITIVITY FOR CLASSIFIER MODULE-I
Cardiac Disorder Classifier Module-I
Atrial Arrhythmias 98.36% VentricularArrhythmias 95%
Myocardial Infraction 100%
TABLE VIII. SPECIFICITY FOR CLASSIFIER MODULE-I
Cardiac Disorder Classifier Module-I
TABLE IX. SENSITIVITY FOR CLASSIFIER MODULE-II
Cardiac Disorders Classifier Module-II
AF 100%
SVA 100%
TABLE X. SENSITIVITY FOR CLASSIFIER MODULE-III
Cardiac Disorders Classifier Module-III
PVC 100%
VT 100%
MVE 97%
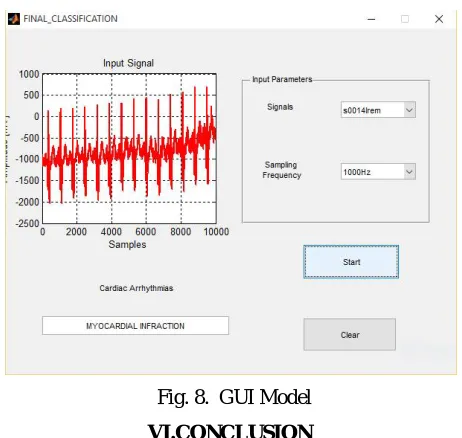
Classifier Module-I, II and III gives a classification accuracy of 96.7%, 100% and 95% respectively. Sensitivity for Classifier Module-I 98.36%, 95% and 100% Atrial Arrhythmias, Ventricular Arrhythmias and Myocardial Infraction respectively. Specificity for Normal signal is 58.3%. For second level classification, Classifier Module-II gives 100% sensitivity for both AF and SVA whereas Classifier Module-III gives a sensitivity of 97% for MVE and 100% for both VT and PVC. Thus the overall classification accuracy achieved by this modular approach is about 96.7%. When compared with literature surveys better classification accuracy is obtained for this modular approach. The work is made more user-friendly with the help of Graphical User Interface (GUI). GUI model consists of input parameters (input signal and the corresponding sampling frequency), the graphical display showing the selected input signal, start button which holds the feature extraction and classification section, Cardiac Arrhythmia display showing the classified output and clear button to clear both the displays. GUI Model created for the work is shown in Figure 8.
Fig. 8. GUI Model
VI.CONCLUSION
ANN output is given to FIS where the .fis file and ANN output is evaluated using ‘evalfis’ function and based on this obtained fuzzy output classification of ECG signal is achieved. Classification section includes two levels. First level classification classifies the ECG signal into four classes like Normal Sinus Rhythm, Atrial Arrhythmias, Ventricular Arrhythmias and Myocardial Infarction by using Classifier Module-I. Second level classification classifies the first level classes into more specific disorders. Atrial Arrhythmias is further classified into two subgroups, which includes Atrial Fibrillation (AF) and Supraventricular Arrhythmia (SVA) by using Classifier Module-II. Ventricular Arrhythmias is further classified into three subgroups, which includes Premature Ventricular Contraction (PVC), Ventricular Tachycardia (VT) and Maligant Ventricular Ectopy (MVE) by using Classifier Module-III. When compared with literature surveys better classification accuracy is obtained for this modular approach for the classification of Normal and seven cardiac disorders. Overall classification accuracy achieved by using this modular approach is about 96.7%.
REFERENCES
[1] Martis, Roshan Joy, U. Rajendra Acharya, Lim Choo Min, “ECG beat classification using PCA, LDA, ICA and Discrete Wavelet Transform,” Biomedical Signal Processing and Control, vol 8, issue 5, pp. 437-448, 2013.
[2] Rahime Ceylan, Yuksel ozbay, "Comparison of FCM, PCA and WT techniques for classification ECG arrhythmias using artificial neural network," Expert Systems with Applications,vol 33, issue 2, pp. 286-295, 2007.
[3] Amit Gothiwarekar, Vaibhav Narawade, Nareshkumar Harale, “The application of wavelet and feature vectors to ECG signals,” IJSER, vol 3, issue 11, pp. 1-5, 2012.
[4] Felipe Alonso - Atienza, Eduardo Morado, Lornea Fernandez - Martinez, Arcadi Garcia – Alberola, Jose Luis Rojo – Alvarez, "Detection of life-threatening arrhythmias using feature selection and support vector machines." Biomedical Engineering, IEEE Transactions vol. 61, no.3, pp.832-840, 2014.
[5] Emran M. Abu Anas, Soo Y. Lee, Md .K. Hasan. "Sequential algorithm for life threatening cardiac pathologies detection based on mean signal strength and EMD functions." Biomedical engineering online vol 9, issue 1, pp. 1-22, 2010.
[6] Karthika V. S, “ Combination of ECG features with artificial neural network for the detection of ventricular fibrillation”, IJMTER, vol. 02, issue 06, pp. 429-442, 2015.
[7] Sambhu D, Umesh A. C, “Automatic Classification of ECG Signals with Feature Extraction using Wavelet Transform and Support Vector Machine,” IJAREEIE, vol.2, special issue 1, pp. 235-241, 2013.
[8] Krasteva Vessela Tzvetanova, Irena Ilieva Jekova, "Spectral analysis of life-threatening cardiac arrhythmias." ELECTRONICS’2005 Conference, pp. 21-23, 2005.
[9] Roger Dzwonczyk, Charles G. Brown, H. A. Werman, “The median frequency of the ECG during ventricular fibrillation: its use in an algorithm for estimating the duration of cardiac arrest,” IEEE Transactions on Biomedical Engineering, vol. 37, no. 6, pp. 640-646, 1990. [10] Anton Amann, Robert Tratnig, Karl Unterkofler, "Reliability of old and new ventricular fibrillation detection algorithms for automated
external defibrillators." Biomedical engineering online, pp. 1-5, 2005.
[11] J. C. T. B. Moraes, M. Blechner, F. N. Vilani, E. V. Costa, "Ventricular fibrillation detection using a leakage/complexity measure method," Computers in Cardiology, pp. 213-216, 2002.