M A J O R A R T I C L E
Quantifying the Evolution and Impact
of Antimalarial Drug Resistance: Drug Use, Spread
of Resistance, and Drug Failure over a 12-Year Period
in Papua New Guinea
Christian Nsanzabana,1,2,aIan M. Hastings,4Jutta Marfurt,1,aIvo Mu¨ller,3Kay Baea,3Lawrence Rare,3Allan Schapira,1
Ingrid Felger,1Bruno Betschart,2Thomas A. Smith,1Hans-Peter Beck,1and Blaise Genton1
1Swiss Tropical Institute, Basel, and2Institut de biologie, Universite´ de Neuchaˆtel, Neuchaˆtel, Switzerland;3Papua New Guinea Institute of Medical Research, Goroka, Papua New Guinea;4Molecular and Biochemical Parasitology, Liverpool School of Tropical Medicine, United Kingdom
Background. Antimalarial use is a key factor driving drug resistance and reduced treatment effectiveness in
Plasmodium falciparum malaria, but there are few formal, quantitative analyses of this process.
Methods. We analyzed drug usage, drug failure rates, and the frequencies of mutations and haplotypes known to be associated with drug resistance over a 12-year period (1991–2002) in a site in Papua New Guinea. This period included 2 successive treatment policies: amodiaquine (AQ) or chloroquine (CQ) from 1991 through 2000 and their subsequent replacement by sulfadoxine-pyrimethamine (SP) plus AQ or SP plus CQ.
Results. Drug use approximated 1 treatment per person-year and was associated with increasing frequencies of pfcrt and pfmdr1 mutations and of treatment failure. The frequency of pfdhfr mutations also increased, especially after the change in treatment policy. Treatment failure rates multiplied by 3.5 between 1996 and 2000 but then decreased dramatically after treatment policy change.
Conclusions. With high levels of resistance to CQ, AQ, and SP, the deployment of the combination of both drugs appears to increase clinical effectiveness but does not decelerate growth of resistance. Our estimates of mutation and haplotype frequencies provide estimates of selection coefficients acting in this environment, which are key parameters for understanding the dynamics of resistance.
Mass deployment of antimalarial drugs invariably re-sults in emergence and spread of resistance. The effec-tiveness of the most widely used antimalarials,
chlo-Received 4 May 2009; accepted 28 August 2009; electronically published 4 January 2010.
Potential conflicts of interest: none reported.
Presented in part: COST Action 857, Second PhD Students Retreat, Brussels, Belgium, 8–10 November 2006 (abstract 7); 1st Three Countries Joint Meeting, French Society of Parasitology, German Society of Parasitology, and Swiss Society of Tropical Medicine and Parasitology, Strasbourg, France; 13–16 June 2007 (abstract P30).
Financial support: The molecular analysis was financed by the Swiss National Science Foundation (grant 3100-AO-103968). The morbidity surveillance was first supported by USAID and then by AusAID within the Malaria Vaccine Epidemiology and Evaluation Project. The principal investigator was supported by the Universite´ de Neuchaˆtel; Switzerland for his PhD training.
a
Present affiliations: Swiss Tropical Institute, Basel, Switzerland (C.N.); Menzies School of Health Research, Casuarina, Australia (J.M.).
Reprints or correspondence: Dr Blaise Genton, Swiss Tropical Institute, Socinstrasse 57, CH 4002 Basel, Switzerland ([email protected]).
The Journal of Infectious Diseases 2010; 201:435–43
2010 by the Infectious Diseases Society of America. All rights reserved. 0022-1899/2010/20103-0018$15.00
DOI: 10.1086/649784
roquine (CQ) and sulfadoxine-pyrimethamine (SP), was heavily compromised by the emergence and spread of resistant Plasmodium falciparum [1]. The genetic ba-sis of this reba-sistance is known in some detail: reba-sistance to CQ and SP is associated with accumulation of mu-tations in pfcrt/pfmdr1 and pfdhfr/pfdhps genes, respec-tively [2–4], which have spread within and across con-tinents [5–7]. Here, we use a unique 12-year compilation of clinical records of drug use, molecular analyses of blood samples, and longitudinal morbidity surveillance to quantify the 3 key components of the process leading to drug failure:
1. The driving force for resistance: the level of com-munity drug use.
2. The mediator: the spread of resistance-associated mutations.
3. The outcome: drug failure and reduced effec-tiveness.
436 • JID 2010:201 (1 February)• Nsanzabana et al
in driving mutations that encodes CQ and SP resistance in an area of moderate to high malaria transmission in Papua New Guinea (PNG). Rather than considering prevalences of these mutations in patient blood, which is potentially misleading if there are changes in transmission intensity and multiplicity of infection (MOI), we present these analyses of the evolution of resistance in terms of allele and haplotype frequencies [8]. We then proceed to quantify the impact on failure rates and ther-apeutic effectiveness.
PATIENTS AND METHODS
Patients and follow-up. The study, part of the Malaria Vac-cine Epidemiology and Evaluation Project [9–11] in Wosera, focused on the inhabitants of the immediate catchment area of the Kunjingini health center in East Sepik Province, PNG. This health center provided the only source of primary care for this area [12], and identification (ID) numbers, presumptive diagnosis, and treatment were recorded for all patients that presented during the period 1991–2002. ID numbers were then linked to those in the Wosera demographic surveillance system, and reattendance at health facilities within any given period of time was thus recorded.
Patients with fever were treated presumptively for malaria according to the guidelines of the PNG Department of Health [13], which for uncomplicated malaria recommended amodia-quine (AQ) for children!20 kg and CQ for others, until 2000.
From 1997 on, to reduce vivax malaria transmission, 1 dose of primaquine (PQ) was combined with AQ or CQ. Second-line treatment was quinine (QN) plus SP. In 2000, the first-line treatment changed to AQ plus SP or CQ plus SP, depending on the patient’s weight.
Blood was collected for parasitological and hematological assessment, and samples were frozen in EDTA-Microtainer (Becton Dickinson).
The Medical Research and Advisory Committee of the Min-istry of Health in PNG gave scientific approval and ethical clearance, and written informed consent was obtained from patients, parents, or legal guardians before recruitment of each patient.
Molecular analysis. DNA was extracted by the QIAamp DNA kit from a random sample of 50 blood samples per year from cases that presented with 11000 asexual P. falciparum
parasites/mL. Polymorphisms in the pfcrt (C72S, M74I, K76T, H97Q, T152A, S163R, A220S, Q271E, N326S/D, I356L/T, R371I), pfmdr1 (N86Y, Y184F, S1034C, N1042D, D1246Y),
pfdhfr (A16V, N51I, C59R, S108N, I164L), and pfdhps (S436A/
F, A437G, K540E, A581G, A613T/S, I640F, H645P) genes were analyzed by DNA microarray as described elsewhere [14]. MOI was determined using GeneScan-based msp2 genotyping [15].
Drug use. Drug pressure was measured as the mean num-ber of treatments per person per year. For 1991–1993, the total
number of treatments dispensed from the clinic was known. The number of treatments in our study area was then obtained by multiplying this total by the proportion of the clinic’s catch-ment falling in our study area (39%, obtained from the total person-time in the demography database for 1999–2002). Our experiences during this period suggest that this catchment had typical levels of patients seeking malaria treatment and that local demographic characteristics did not alter significantly be-tween 1991–1993 and 1997–2002. For 1994–1996, no reliable data on treatments were available. From 1997 onward, treat-ment data were available from the Institute of Medical Research (IMR) study nurses who recorded the drugs used during their visits. They were not present each day, so the total number of treatments was obtained by dividing the recorded number of IMR treatments by the proportion of days that the IMR study team was present. This calculation relies on the assumption that treatment rates and type were independent of presence of the IMR nurses, because the nurses’ role was observational.
Allele and haplotype frequencies. Single allele frequencies of resistance markers were estimated from nonlinear statistical model by accounting for the effects of varying multiplicity of infection and by assuming that resistant and sensitive parasite clones are transmitted independently. The likelihood of a sam-ple containing no resistant clones is(1⫺p)n, where p is the frequency for the mutant allele and n is the MOI of the sample. Similarly, the likelihood of a sample containing no wild-type allele ispn, and for a mixture of both, a wild-type and a resistant allele, is1⫺p –(1n ⫺p)n. The overall likelihood for p is then the product of this likelihood over all samples, using values of
n obtained from msp2 genotyping results [16]. We used a simple
de-Figure 1. Per capita treatment showing use of various drug com-binations, from 1991 through 2002 (but excluding 1994–1996 due to lack of data). AQ, amodiaquine, CQ, chloroquine; SP, sulfadoxine-pyrimethamine.
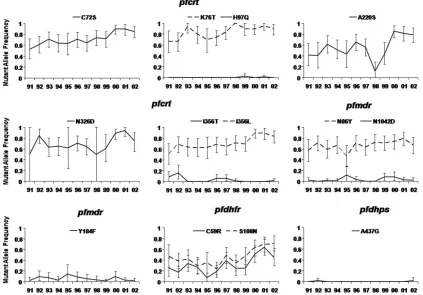
Figure 2. Changes in mutant allele frequency from 1991 through 2002 as a result of use of sulfadoxine-pyrimethamine in combination with chloroquine or amodiaquinea.
scribed in more detail in that publication and in the accom-panying users’ manual.
Selection coefficients were calculated for each allele and hap-lotype by plottingln (R/S)against time, where R and S are the frequency of resistant and sensitive alleles or haplotypes,
re-spectively [18]. Time was converted to parasite generations that assumed 6 P. falciparum generations per year. The selection coefficient for each single-nucleotide polymorphism (SNP) or haplotype was the slope obtained by regression analysis for the 12-year period. Annual selection coefficients were also calcu-lated for correlation with contemporaneous drug usage.
438 • JID 2010:201 (1 February)• Nsanzabana et al
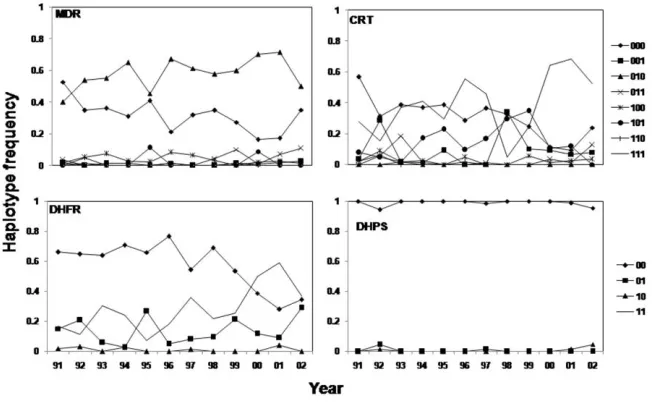
Figure 3. Changes in haplotype frequency from 1991 through 2004.
may reduce effectiveness (mutant parasites may survive the suboptimal treatments that inevitably occur in practice). Failure rates were not PCR-corrected, so they include both recrudes-cent infections that survived treatment and reinfections. Both are important for effectiveness; mutations to resistance increase the probability of surviving treatment and also allow parasites to tolerate high drug levels, thus enabling them to establish new infections in people more rapidly after treatment [20]. Thus, the absence of PCR correction is not problematic for the study.
RESULTS
Drug use. A total of 7612 AQ, 5179 CQ, 337 QN, 2571 SP, and 4430 PQ treatments were delivered at the Kunjingini Health Center to patients from the core villages from 1991 through 2002, corresponding to an average of 0.81 treatment courses per person-year. From 1991 through 1993, only AQ, CQ, and QN were prescribed. Per capita treatment decreased for AQ and CQ between 1991 and 1999 (with the proviso that data for 1994–1996 were not available), remaining relatively stable thereafter (Figure 1), but was always higher for AQ than for CQ. QN use was low during the entire 12-year period. PQ use commenced in 1997 with 0.58 treatments per person, increased to 0.95 in 2000, and then decreased to 0 in 2002 (Figure 1). SP use started in 1997, with 0.01 treatments per person and remained low until 1999. SP was then combined with CQ or AQ as recommended first-line drug, increasing rapidly to 0.86 and 0.74 treatments per person-year in 2001 and 2002, re-spectively (Figure 2). Slides collected by the IMR team during their visits showed that 56% of the (presumptively) treated patients did not have P. falciparum (data not shown), with this percentage stable over time.
Genetic analyses. MOI showed no significant trend over time, averaging1.40.15P. falciparum clones per sample, with
the lowest MOI in 1991 (1.21) and the highest in 2000 (1.78). Thus, 98% of samples could be genotyped (588 samples), with polymorphisms found in pfcrt codons C72S, K76T, H97Q, A220S, N326D, I356L, and I356T, pfmdr1 codons N86Y, Y184F, and N1042D, pfdhfr codons C59R and S108N, and pfdhps co-don A437G. The changes in SNP and haplotype frequencies are shown in Figures 2 and 3, respectively.
Most mutant allele frequencies increased over the 12-year period, except pfmdr1 Y184F and N1042D, pfcrt I356T and H97Q, and pfdhps A437G, which were at low frequencies and showed no discernible trend. Mutant gene frequencies in pfcrt, already frequent (10.4) in 1991 (Figure 2), increased over the
12-year period (for pfcrt I356L, C72S, and K76T multiplying by 1.67, 1.63, and 1.34, respectively). The pfmdr1 N86Y fre-quency was multiplied by 1.18 (Figure 3). The mutant allele frequencies of pfdhfr C59R and S108N decreased between 1991 and 1995, from 0.47 to 0.24 for S108N and 0.26 to 0.07 for C59R. From 1995 onward, the frequencies of these alleles mul-tiplied by 3 and 6.4, respectively.
Among haplotypes, the frequency of pfdhfr is the most in-teresting. The wild-type frequency did not vary significantly between 1991 and 1998, but it dramatically decreased thereafter. The pfdhfr108 single-mutant haplotype did not change much in frequency over the entire period. There was no clear trend for pfdhfr double-mutant haplotype 59R/108N between 1991 and 1997, but after 1998 it increased to a frequency that was 2.5 times higher in 2001 than in 1998 (Figure 3).
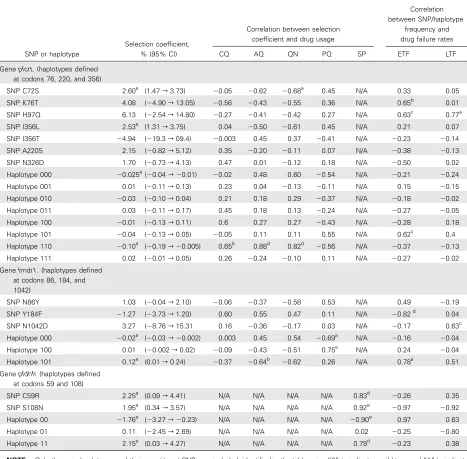
Table 1. Analysis of the Spread and Consequences of Single-Nucleotide Polymorphism (SNPs) and Haplotypes inpfcrt,pfmdr1, andpfdhfr
SNP or haplotype
Selection coefficient, % (95% CI)
Correlation between selection coefficient and drug usage
Correlation between SNP/haplotype
frequency and drug failure rates
CQ AQ QN PQ SP ETF LTF
Genepfcrt. (haplotypes defined at codons 76, 220, and 356)
SNP C72S 2.60a (1.47r3.73) ⫺0.05 ⫺0.62 ⫺0.68a
0.45 N/A 0.33 0.05
SNP K76T 4.08 (⫺4.90r13.05) ⫺0.56 ⫺0.43 ⫺0.55 0.36 N/A 0.65b
0.01
SNP H97Q 6.13 (⫺2.54r14.80) ⫺0.27 ⫺0.41 ⫺0.42 0.27 N/A 0.63c
0.77a
SNP I356L 2.53a (1.31r3.75) 0.04 ⫺0.50 ⫺0.61 0.45 N/A 0.21 0.07
SNP I356T ⫺4.94 (⫺19.3r09.4) ⫺0.003 0.45 0.37 ⫺0.41 N/A ⫺0.23 ⫺0.14
SNP A220S 2.15 (⫺0.82r5.12) 0.35 ⫺0.20 ⫺0.11 0.07 N/A ⫺0.38 ⫺0.13
SNP N326D 1.70 (⫺0.73r4.13) 0.47 0.01 ⫺0.12 0.18 N/A ⫺0.50 0.02
Haplotype 000 ⫺0.025a(⫺0.04r⫺0.01) ⫺0.02 0.48 0.60 ⫺0.54 N/A ⫺0.21 ⫺0.24
Haplotype 001 0.01 (⫺0.11r0.13) 0.23 0.04 ⫺0.13 ⫺0.11 N/A 0.15 ⫺0.15
Haplotype 010 ⫺0.03 (⫺0.10r0.04) 0.21 0.18 0.29 ⫺0.37 N/A ⫺0.18 ⫺0.02
Haplotype 011 0.03 (⫺0.11r0.17) 0.45 0.18 0.13 ⫺0.24 N/A ⫺0.27 ⫺0.05
Haplotype 100 ⫺0.01 (⫺0.13r0.11) 0.6 0.27 0.27 ⫺0.43 N/A ⫺0.28 0.18
Haplotype 101 ⫺0.04 (⫺0.13r0.05) ⫺0.05 0.11 0.11 0.55 N/A 0.62c
0.4
Haplotype 110 ⫺0.10a (⫺0.19r⫺0.005) 0.65b
0.88d 0.82d ⫺0.56 N/A ⫺0.37 ⫺0.13
Haplotype 111 0.02 (⫺0.01r0.05) 0.26 ⫺0.24 ⫺0.10 0.11 N/A ⫺0.27 ⫺0.02
Genefmdr1. (haplotypes defined
at codons 86, 184, and 1042)
SNP N86Y 1.03 (⫺0.04r2.10) ⫺0.06 ⫺0.37 ⫺0.58 0.53 N/A 0.49 ⫺0.19
SNP Y184F ⫺1.27 (⫺3.73r1.20) 0.60 0.55 0.47 0.11 N/A ⫺0.82d
0.04
SNP N1042D 3.27 (⫺8.76r15.31 0.16 ⫺0.36 ⫺0.17 0.03 N/A ⫺0.17 0.63c
Haplotype 000 ⫺0.02a (⫺0.03r⫺0.002) 0.003 0.45 0.54 ⫺0.69a N/A ⫺0.16 ⫺0.04
Haplotype 100 0.01 (⫺0.002r0.02) ⫺0.09 ⫺0.43 ⫺0.51 0.75a N/A 0.24 ⫺0.04
Haplotype 101 0.12a (0.01r0.24) ⫺0.37 ⫺0.64b
⫺0.62 0.26 N/A 0.78a 0.51
Genepfdhfr(haplotypes defined
at codons 59 and 108)
SNP C59R 2.25a (0.09r4.41) N/A N/A N/A N/A 0.83d
⫺0.26 0.35
SNP S108N 1.95a (0.34r3.57) N/A N/A N/A N/A 0.92e
⫺0.97 ⫺0.92
Haplotype 00 ⫺1.76a (⫺3.27r⫺0.23) N/A N/A N/A N/A ⫺0.90e
0.97 0.63
Haplotype 01 0.11 (⫺2.45r2.69) N/A N/A N/A N/A 0.02 ⫺0.25 ⫺0.80
Haplotype 11 2.15a (0.03r4.27) N/A N/A N/A N/A 0.79d ⫺
0.23 0.38
NOTE. Only the main haplotypes and their constituent SNPs are included, identified in the table using “0” to indicate a wild type and “1” to indicate a mutant. Hence,pfcrthaplotype 001 is wild type at positions 76 and 220 and mutant at position 356;pfmdr1haplotype 011 is wild type at position 86 and mutant at positions 184 and 1042; and so on. The Table provides 3 key factors describing the spread of resistance: (1) selection coefficients for CQ and SP resistance-related molecular markers over the whole study period assuming 6 generations ofPlasmodium falciparumper year. (2) The correlation between these selection coefficients (a measure of how rapidly the mutations are spreading or disappearing) and level of individual drug use. This was done on an annual basis (ie, each year constitutes 1 data point), excluding years 1994–1996 in which there was no quantification of drug usage. (3) The correlation between the allele/haplotype frequency and early and late treatment failure rates analyzed on an annual basis. In the case of treatment failures andpfcrtandpfmdr, we only include 1991–1999 (because failure rates are not directly comparable in the periods before and after the introduction of SP as their partner drug). Similarly, SP was only deployed for 3 years, 2000–2002, so correlation was only over 3 time points. AQ, amodiaquine; CI, confidence interval; CQ, chloroquine; ETF, early treatment failure (between days 8 and 28); LTF, late treatment failure (between days 29 and 42); N/A, not applicable; QN, quinine; PQ, primaquine; SP, sulfadoxine-pyrimethamine.
a
.
P⭐.05
b
.
Pp.06
c
.
Pp.07
d
.
P⭐.01
e
.
440 • JID 2010:201 (1 February)• Nsanzabana et al
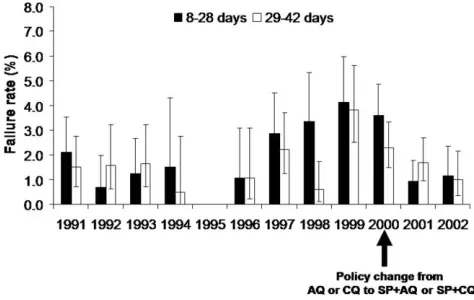
Figure 4. Treatment failure rates in relation to changes in treatment policy. AQ, amodiaqine; CQ, chloroquine; SP, sulfadoxine-pyrimethamine.
(P⭐.05). Among the pfcrt haplotypes, there was low but sig-nificant selection against the triple wild-type haplotype and against the double-mutant 76/220 haplotype. In pfmdr, there was significant selection against the triple wild-type haplotype and positive selection for the double-mutant 86/1042 haplo-type. There was significant selection for the pfdhfr double-mu-tant haplotype and significant selection against the pfdhfr 59/ 108 wild-type haplotype. In particular, the selection coefficient for the pfdhfr 59/108 double mutant after 1999 (ie, after the change to SP plus AQ or SP plus CQ as a first drug in 2000) was 4.87% (data not shown), but it was not significant (⫺14.34% to 24.07%).
The correlations between selection coefficients and drug use patterns were nonsignificant for nearly all the pfcrt and pfmdr1 mutations and QN, AQ, and CQ use, except for pfcrt C72S and QN use, and pfcrt 76/220 haplotype and AQ and QN use (Table 1). In contrast, the correlations between selection coefficients of pfdhfr SNPs and haplotypes and SP use were significantly positive.
Treatment effectiveness. Overall, 148 (2.2%) of 6678 treated patients were reinfected during the 8–28-day period and an additional 122 (1.8%) patients were reinfected during the 29–42-day follow-up period. The treatment failure rate for the 28-day follow-up period did not change significantly between 1991 and 1995, but it gradually increased from 1996 until 1999; treatment failures were 3.8 times more common in 1999 than in 1996 (Figure 4). Patient follow-up was not recorded in 1995. After 1999, the treatment failure rate decreased dramatically, resulting in a treatment failure rate that was 3.5 lower in 2002 than it was in 1999 (Figure 1). There was no significant overall trend for treatment failure rates over the 29–42-day follow-up period. Nevertheless, treatment failure during that period was 3.8 times more likely in 2002 than in 1991 (Figure 4).
DISCUSSION
Over the 12-year study period, annual drug use was∼1 treat-ment per person, consistent with the area being of moderate to high intensity of transmission, with little drug access outside the formal health sector [10]. There was a gradual decline in deployment of AQ and CQ, whereas use of SP was high, fol-lowing its introduction in 2000. Despite little use of SP before 2000, pfdhfr108 and pfdhfr59 mutations were already present in 1991, and there was significant selection for these mutations even without evident SP use (Table 1 and Figures 2 and 3). Several explanations are possible: first, trimethoprim-sulfa-methoxazole, an antifolate used mainly for its antibacterial ef-fect, could select for pfdhfr mutations [21]. Second, SP was not systematically recorded when it was given with QN as a second-line treatment. Third, resistant parasites could immigrate from neighboring areas, where SP resistance was higher. Fourth, ef-fects of antifolate pressure exerted by mass drug administration of pyrimethamine in the 1960s and 1970s were persistent [22]. Any of these explanations would be compatible with the model that the acquisition of mutations enabling parasites to become tolerant takes much longer than subsequent acquisition of sol-id resistance [23]. The haplotypes of genes, rather than poly-morphisms at individual codons, are the basic unit of drug selection. Evolution of resistance may proceed through a series of haplotype turnovers, some haplotypes initially spreading be-fore being replaced in turn by more-resistant haplotypes [23]. Interestingly, our analyses suggest that resistance is in very dif-ferent stages of development (Figure 3) in the 4 genes; pfdhps is represented essentially by only wild-type haplotypes. Mutants occur only on a single codon 86 in pfmdr1, although there was a late appearance of a double pfmdr86/1042 haplotype. In pfcrt the wild-type haplotype was almost eliminated and replaced by the 76/356 and 76/220/356 mutant haplotypes, with the triple mutant eventually largely displacing the double mutant.
In pfdhfr, the wild-type haplotype shows a steady decline with the 108 single-mutant haplotype, initially being slowly displaced by the 59/108 double-mutant haplotype but increas-ing rapidly after the introduction of SP as a first-line drug in 1999. The estimated selection coefficient was 4.9% after this introduction, and although the sample size was tiny (3-year points), resulting in a large confidence interval (⫺14% to 24%), it is interesting that this estimate is almost identical to that of 5% reported by Anderson and Roper [18], despite their work being performed in a low-transmission area and examining a more highly resistant pfdhfr triple mutant haplotype, which would have been displacing the double.
of drug treatment was previously estimated at ⫺5% [27] in Malawi, so making an illustrative assumption that the advan-tage in the presence of the drug is +25% and that 30% of infec-tions are treated would give an overall selection coefficient of(0.3⫻0.25) + (0.7⫻⫺0.05)p0.04. Obviously, as drug use increases or decreases, this overall selection coefficient will change; hence, the importance of examining the correlation between the 2 parameters is clear (Table 1). In principle, it should be possible to disentangle the 2 effects by regressing the selection coefficient against drug use and finding where the regression cuts the Y axis (when drug usep0), which would give the selective disadvantage in the absence of the drug, but in practice the relationship was so weak as to preclude this calculation.
The sign and magnitude of these selection coefficients, s, is a key parameter in much of population genetic theory. For example, the magnitude of s affects the following:
1. The rate at which mutations and haplotypes migrate across geographic regions. Classically, the rate isj冑(2s), where jis the standard deviation of parasite dispersal via host move-ment ([23]; but see the brief discussion in the Appendix of [29]).
2. The chance of new mutations surviving the first few generations after their first appearance or introduction (see box 2 of [30]).
3. The mutation/selection balance and hence the frequency of the mutation that would be present before drugs are deployed [31].
4. The size of the selective sweep in the genome surround-ing a mutation besurround-ing selected for resistance [32].
The estimates for s given in Table 1 can therefore be used to calibrate and inform broader discussions of the population ge-netics of emergence and spread of resistance. They can also be used to validate models of the spread of resistant mutations, which should predict selection coefficients similar to those ob-served in the field. Although the estimates of s are imprecise, the results are remarkably consistent (Table 1). Despite the central role of the selection coefficient in understanding the dynamics of resistance, in addition to the value of 5% estimated for pfdhfr by Anderson and Roper [18], the only other estimate of selection coefficients acting on P. falciparum drug-resistant mutations/haplotypes appears to be that of Nair et al [33]. They used the decline in clinical effectiveness of SP rather than direct frequency estimation to assess the selection coefficient acting on dhfr resistance as 11%. The results summarized in Table 1 are therefore a substantive advance.
The increasing treatment failure rate between 1996 and 1999 can be ascribed to the increasing parasite resistance to standard treatment with CQ and AQ [34, 35], consistent with increasing
frequencies of the CQ resistance–associated mutant alleles in
pfcrt and pfmdr1. Although AQ in combination with SP is
efficacious in some areas where both drugs have previously been used in monotherapy [36, 37], this drug combination is already failing in PNG [38–40]. Our data have shown that resistant
pfdhfr allele frequencies already began to increase in 1998 before
the large-scale use of SP. The addition of SP to AQ or CQ in 2000 improved the effectiveness of the standard treatment but did not prevent the increase in 4-aminoquinolines resistance in this situation where resistant alleles were already frequent. Treatment failure rates by day 28 with combination therapy reached 16% in Wosera in 2003 [38]. Later molecular data have also confirmed that resistance to SP, as measured by pfdhfr S108N and C59R frequencies, continued to increase steadily from 1999 onward [39, 40].
Few previous studies have assessed the relationships between therapeutic effectiveness and molecular resistance markers over extended periods [41–43]. The only other study, in Senegal [19], to correlate these with drug pressure found results similar to ours. The frequencies of both resistance markers and clinical failure to both SP and CQ increased rapidly despite restriction of antimalarial treatments to parasitologically confirmed cases [19].
We conclude by considering how closely the 3 parts of the process leading to resistance interrelate. There were strong cor-relations between SP use and pfdhfr selection coefficients but little correlation between drug use and selection coefficients in either pfcrt or pfmdr1, probably because mutations known to be associated with resistance (pfcrtK76T and pfmdrN86Y) were already present at high frequencies. There also appears to be a closer relationship between mutations in pfdhfr and SP resis-tance than there is between pfmdr1/pfcrt mutations and CQ/ AQ failures. The weak correlations between individual muta-tion/haplotype frequency and CQ/AQ failure rates very likely reflect other phenomena, such as external factors that include pharmacogenetics, compliance, and host immunity.
442 • JID 2010:201 (1 February)• Nsanzabana et al Acknowledgments
We thank the population of the Wosera area, for their commitment to participate in this study; the nurses at the Kunjingini health center and staff of the PNG Institute of Medical Research (IMR), who contributed to the collection of morbidity surveillance data; the team of drivers, village workers, and community relation officers, who collected the demographic data; and the 2 anonymous referees, for their helpful comments.
References
1. Talisuna AO, Bloland P, D’Alessandro U. History, dynamics and public health importance of malaria parasite resistance. Clin Microbiol Rev
2004; 17(1):235–254.
2. Plowe CV, Cortese JF, Djimde A, et al. Mutations in Plasmodium
fal-ciparum dihydrofolate reductase and dihydropteroate synthase and
ep-idemiologic patterns of pyrimethamine-sulfadoxine use and resistance. J Infect Dis 1997; 176:1590–1596.
3. Fidock DA, Nomura T, Talley AK, et al. Mutations in the P. falciparum digestive vacuole transmembrane protein PfCRT and evidence for their role in chloroquine resistance. Mol Cell 2000; 6(4):861–871. 4. Reed MB, Saliba KJ, Caruana SR, Kirk K, Cowman AF. Pgh1 modulates
sensitivity and resistance to multiple antimalarials in Plasmodium
fal-ciparum. Nature 2000; 403(6772):906–909.
5. Cortese JF, Caraballo A, Contreras CE, Plowe CV. Origin and dissem-ination of Plasmodium falciparum drug-resistance mutations in South America. J Infect Dis 2002; 186(7):999–1006.
6. Wootton JC, Feng X, Ferdig MT, et al. Genetic diversity and chloro-quine selective sweeps in Plasmodium falciparum. Nature 2002; 418(6895):320–323.
7. Roper C, Pearce R, Nair S, Sharp B, Nosten F, Anderson T. Intercon-tinental spread of pyrimethamine-resistant malaria. Science 2004; 305(5687):1124.
8. Hastings IM, Smith TA. MalHaploFreq: a computer programme for estimating malaria haplotype frequencies from blood samples. Malar J 2008; 7(1):130.
9. Genton B, al-Yaman F, Beck HP, et al. The epidemiology of malaria in the Wosera area, East Sepik Province, Papua New Guinea, in prep-aration for vaccine trials. I. Malariometric indices and immunity. Ann Trop Med Parasitol 1995; 89(4):359–376.
10. Genton B, al-Yaman F, Beck HP, et al. The epidemiology of malaria in the Wosera area, East Sepik Province, Papua New Guinea, in prep-aration for vaccine trials. II. Mortality and morbidity. Ann Trop Med Parasitol 1995; 89(4):377–390.
11. Alpers MP, al-Yaman F, Beck HP, et al. The Malaria Vaccine Epide-miology and Evaluation Project of Papua New Guinea: rationale and baseline studies. P N G Med J 1992; 35(4):285–297.
12. Mu¨ller I, Smith T, Mellor S, Rare L, Genton B. The effect of distance from home on attendance at a small rural health centre in Papua New Guinea. Int J Epidemiol 1998; 27(5):878–884.
13. Papua New Guinea Department of Health. Standard treatment for common illnesses of children in Papua New Guinea. 6th ed. Port Moresby, Papua New Guinea: Department of Health, 1993. 14. Crameri A, Marfurt J, Mugittu K, et al. Rapid microarray-based method
for monitoring of all currently known single-nucleotide polymor-phisms associated with parasite resistance to antimalaria drugs. J Clin Microbiol 2007; 45(11):3685–3691.
15. Falk N, Maire N, Sama W, et al. Comparison of PCR-RFLP and Gene-scan-based genotyping for analyzing infection dynamics of Plasmodium
falciparum. Am J Trop Med Hyg 2006; 74(6):944–950.
16. Schneider AG, Premji Z, Felger I, et al. A point mutation in codon 76 of pfcrt of P. falciparum is positively selected for by chloroquine treat-ment in Tanzania. Infect Genet Evol 2002; 1(3):183–189.
17. Press WH, Teukolsky SA, Vetterling WT, Flannery BP. Numerical rec-ipes in C: the art of scientific computing. 3rd ed. Cambridge, UK: Cambridge University Press, 2007.
18. Anderson TJ, Roper C. The origins and spread of antimalarial drug resistance: lessons for policy makers. Acta Trop 2005; 94(3):269–280. 19. Noranate N, Durand R, Tall A, et al. Rapid dissemination of
Plas-modium falciparum drug resistance despite strictly controlled
anti-malarial use. PLoS ONE 2007; 2(1):e139.
20. Hastings IM, Watkins WM. Tolerance is the key to understanding antimalarial drug resistance. Trends Parasitol 2006; 22 (2):71–77. 21. Laufer MK, Plowe CV. Cotrimoxazole prophylaxis and malaria in
Af-rica: h7ave the important questions been answered? Am J Trop Med Hyg 2006; 75:373–374.
22. Spencer M. The history of malaria control in the southwest Pacific region, with particular reference to Papua New Guinea and the Sol-omon Islands. PNG Med J 1992; 35:33–66.
23. Watkins WM, Sibley CH, Hastings IM. The search for effective and sustainable treatments for Plasmodium falciparum malaria in Africa: a model of the selection of resistance by antifolate drugs and their com-binations. Am J Trop Med Hyg 2005; 72(2):163–173.
24. Ord R, Alexander N, Dunyo S, et al. Seasonal carriage of pfcrt and
pfmdr1 alleles in Gambian Plasmodium falciparum imply reduced
fit-ness of chloroquine-resistant parasites. J Infect Dis 2007; 196:1613– 1619.
25. Laufer MK, Thesing PC, Eddington ND, et al. Return of chloroquine antimalarial efficacy in Malawi. New Eng J Med 2006; 355 (19):1959– 1966.
26. Babiker H, Hastings IM, Swedberg G. Impaired fitness of drug-resistant malaria parasites: evidence and implication on drug deployment pol-icies. Expert Rev Anti Infect Ther 2009; 7:581–593.
27. Hastings IM, Donnelly MJ. The impact of antimalarial drug resistance mutations on parasite fitness, and its implications for the evolution of resistance. Drug Resist Updat 2005; 8:43–50.
28. Walliker D, Hunt P, Babiker H. Fitness of drug-resistant malaria par-asites. Acta Trop 2005; 94 (3):251–259.
29. Fisher RA. The wave of advance of advantageous genes. Ann Eugen
1937; 7:355–369.
30. Hastings IM. Gametocytocidal activity in antimalarial drugs speeds the spread of drug resistance. Trop Med Int Health 2006; 11(8):1206– 1217.
31. Hastings IM. The origins of antimalarial drug resistance. Trends Par-asitol 2004; 20(11):512–518.
32. Hastings IM. A model for the origins and spread of drug resistant malaria. Parasitology 1997; 115:133–141.
33. Nair S, Williams JT, Brockman A, et al. A selective sweep driven by pyrimethamine treatment in SE Asian malaria parasites. Mol Biol Evol
2003; 20:1526–1536.
34. Mu¨ller I, Bockarie M, Alpers M, Smith T. The epidemiology of malaria in Papua New Guinea. Trends Parasitol 2003; 19(6):253–259. 35. Genton B, Baea K, Lorry K, Ginny M, Wines B, Alpers MP.
Parasi-tological and clinical efficacy of standard treatment regimens against
Plasmodium falciparum, P. vivax and P. malariae in Papua New Guinea.
PNG Med J 2005; 48(3–4):141–150.
36. Dorsey G, Njama D, Kamya MR, et al. Sulfadoxine/pyrimethamine alone or with amodiaquine or artesunate for treatment of uncompli-cated malaria: a longitudinal randomised trial. Lancet 2002; 360(9350): 2031–2038.
37. Rwagacondo CE, Niyitegeka F, Sarushi J, et al. Efficacy of amodiaquine alone and combined with sulfadoxine-pyrimethamine and of sulfa-doxine pyrimethamine combined with artesunate. Am J Trop Med Hyg
2003; 68(6):743–747.
38. Marfurt J, Mu¨eller I, Sie A, et al. Low efficacy of amodiaquine or chloroquine plus sulfadoxine-pyrimethamine against Plasmodium
fal-ciparum and P. vivax malaria in Papua New Guinea. Am J Trop Med
Hyg 2007; 77(5):947–954.
39. Marfurt J, Mu¨ller I, Sie A, et al. The usefulness of twenty-four molecular markers in predicting treatment outcome with combination therapy of amodiaquine plus sulfadoxine-pyrimethamine against falciparum malaria in Papua New Guinea. Malar J 2008; 7:61.
allele in Plasmodium falciparum isolates after the introduction of sul-fadoxine/pyrimethamine in combination with 4-aminoquinolines in Papua New Guinea. Infect Genet Evol 2006; 6(6):447–452.
41. Kublin JG, Cortese JF, Njunju EM, et al. Reemergence of chloroquine-sensitive Plasmodium falciparum malaria after cessation of chloroquine use in Malawi. J Infect Dis 2003; 187(12):1870–1875.
42. Plowe CV, Kublin JG, Dzinjalamala FK, et al. Sustained clinical ef-ficacy of sulfadoxine-pyrimethamine for uncomplicated falciparum malaria in Malawi after 10 years as first line treatment: five year pro-spective study. BMJ 2004; 328(7439):545. Erratum in: BMJ 2004; 328(7442):762.
43. Babiker HA, Satti G, Ferguson H, Bayoumi R, Walliker D. Drug re-sistant Plasmodium falciparum in an area of seasonal transmission. Acta Trop 2005; 94(3):260–268.
44. Quaye I, Sibley CH. Molecular data on Plasmodium falciparum chlo-roquine and antifolates resistance: a public health tool. Trends Parasitol
2002; 18(4):184–186.
45. Plowe CV. Monitoring antimalarial drug resistance: making the most of the tools at hand. J Exp Biol 2003; 206(Pt 21):3745–3752. 46. Plowe CV, Roper C, Barnwell JW, et al. World Antimalarial Resistance
Network (WARN) III: molecular markers for drug resistant malaria. Malar J 2007; 6:121.
47. Hastings IM, Korenromp EL, Bloland PB. The anatomy of a malaria disaster: drug policy choice and mortality in African children. Lancet Infect Dis 2007; 7(11):739–748.