Automatic Classification of Phonocardiogram
Prof. M.Vishwanath Shervegar*1
Department of Electronics and Communication Engineering, Visvesvaraya Technological University, Moodlakatte
Institute of Technology, Kundapura, Karnataka, India*1
ABSTRACT: This paper presents a novel method of automatic classification of phonocardiogram. The noisy phonocardiogram is segmented to form noisy datasets of one heart cycle. The dataset is created for murmur and normal sounds. The datasets are LMS filtered to produce two new datasets to form the filtered datasets. The test sound which is a noisy phonocardiogram is taken, segmented and each segment of one cycle duration is checked for normal and murmur segments. The test sound is LMS filtered and re-segmented. The segments are checked for normal and murmur sounds and the results are compared with the previously obtained results.
KEYWORDS: Phonocardiogram, Homomorphic filtering, LMS filtering, K-means clustering.
I. INTRODUCTION
Phonocardiography is the study of heart sounds. The acquisition of phonocardiogram is done in hospitals using stethoscopes. Very often this acquisition is affected by the presence of the ambient background noise. So detection of murmurs becomes difficult. So removal of the noise becomes utmost important for the early diagnosis of the diseases. Filtering is one such method used to remove the noise. There are many filtering techniques used and adaptive filtering is one of them. This paper discusses the use of LMS filter to remove the noise in the raw phonocardiogram. LMS filtering techniques are known for their fast convergence rate.
This paper discusses the three very important aspects of phonocardiogram signal processing namely segmentation by homo-morphic filtering, filtering by LMS techniques and classification by k-means clustering. The dataset for our purpose was obtained from Peter Bentley’s website mentioned in [1] containing mostly noisy sounds.
The whole system was built up in Matlab R2010 environment and the simulations and comparisons were done to assess the results of all the three phonocardiogram signal processing techniques.
II. METHODOLOGY 2.1 Creation of raw datasets :
The phonocardiogram obtained from [1] is used to create a raw dataset of impure heart sounds. The dataset is created for separate abnormal and normal heart sounds. The dataset is created by taking a sample phonocardiogram, segmenting it and storing the sounds containing individual heart cycles in a separate folder called Abnormal (for abnormal sounds) and normal (for normal sounds) in matlab workspace in the form of wav files. Both the folders contain 200 sounds each of normal and pathological sounds. All sounds are of same length and sampling rate. The segmentation is automated by writing a matlab code for homo-morphic filtering to generate the sounds as mentioned in [2].
2.2 Creation of Filtered datasets:
The raw dataset of impure heart sounds is then further LMS filtered to produce filtered datasets. The filtered dataset consists of filtered normal and abnormal heart sounds to be separately stored in nfilt (normal sounds) and afilt (abnormal sounds) folders in matlab workspace in the form of wav files. Both the folders contain 200 sounds each of normal and pathological sounds. All sounds are of same length and sampling rate.
2.3 Implementation of algorithms:
ISSN (Print) : 2320 – 3765 ISSN (Online): 2278 – 8875
I
nternational
J
ournal of
A
dvanced
R
esearch in
E
lectrical,
E
lectronics and
I
nstrumentation
E
ngineering
(An ISO 3297: 2007 Certified Organization)
Vol. 5, Issue 1, January 2016
segmented sounds representing the individual heart cycles is classified as murmur or normal sound using k-means clustering for the same set of parameters.
Figure 1: Flow chart showing implementation of algorithms.
The results of clustering are compared and assessed. If same results are obtained then it could be concluded that amount of noise in heart sound is very less and does not hinder murmur detection. If the results are different then it could be concluded that amount of noise in heart sound is very high and does affect murmur detection. The classification percentage is then calculated based on the amount of murmur present in the heart sound, if any.
III. RESULTS AND DISCUSSION
Figure 2: Segmentation steps for the raw Figure 3: Segmentation steps for the filtered heart sound 201108011118.wav. heart sound 201108011118.wav.
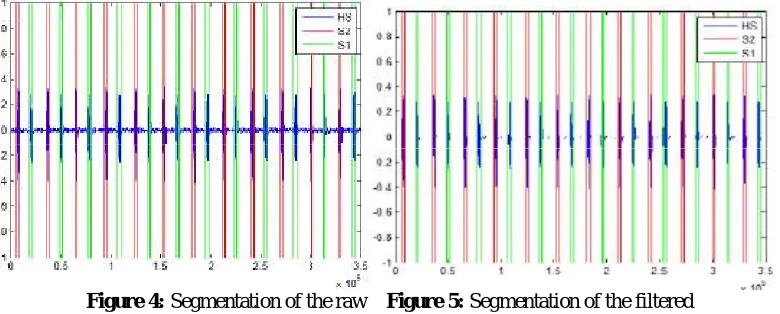
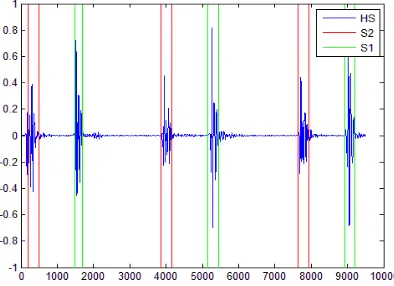
Figure 4: Segmentation of the raw Figure 5: Segmentation of the filtered heart sound 201108011118.wav. heart sound 201108011118.wav.
ISSN (Print) : 2320 – 3765 ISSN (Online): 2278 – 8875
I
nternational
J
ournal of
A
dvanced
R
esearch in
E
lectrical,
E
lectronics and
I
nstrumentation
E
ngineering
(An ISO 3297: 2007 Certified Organization)
Vol. 5, Issue 1, January 2016
Figure 8: Segmentation of the raw Figure 9: Segmentation of the filtered heart sound 201108222258.wav. heart sound 201108222258.wav.
Figure 10: Segmentation steps for the raw Figure 11: Segmentation steps for the filtered heart sound 201106221450.wav. heart sound 201106221450.wav.
Figure 12: Segmentation of the raw Figure 13: Segmentation of the filtered heart sound 201106221450.wav. heart sound 201106221450.wav.
Figure 16: Segmentation of the raw Figure 17:Segmentation of the filtered heart sound heart sound 103_1305031931979_B.wav. 103_1305031931979_B.wav.
Figure 18: Segmentation steps for the raw heart Figure 19: Segmentation steps for the filtered Sound106_1306776721273_C2.wav. heart sound 106_1306776721273_C2.wav.
ISSN (Print) : 2320 – 3765 ISSN (Online): 2278 – 8875
I
nternational
J
ournal of
A
dvanced
R
esearch in
E
lectrical,
E
lectronics and
I
nstrumentation
E
ngineering
(An ISO 3297: 2007 Certified Organization)
Vol. 5, Issue 1, January 2016
Nameofsegment
(seg) SNR Before LMS SNR After LMS
201108011118.wav
Seg 1 9.8918 10.7072
Seg 2 9.995 10.7381
Seg 3 9.8897 10.6044
Seg 4 9.4978 10.2643
Seg 5 9.6345 10.4446
Seg 6 9.7449 10.5955
Seg 7 9.724 10.3986
Seg 8 9.7134 10.5342
Seg 9 9.5802 10.5235
Seg10 9.7608 10.5252
Seg11 9.6925 10.473
201108222258.wav
Seg1 13.0258 13.6127
Seg2 14.9012 15.5216
Seg3 15.669 16.102
Seg4 15.8739 16.3168
Seg5 15.7966 16.2142
Seg6 14.9906 15.7146
Seg7 15.5339 16.057
201106221450.wav
Seg1 10.479 10.9796
Seg2 13.5019 13.5073
Seg3 12.5922 13.0246
Seg4 13.4389 13.4435
Seg5 13.2626 13.6019
Seg6 13.3013 13.4519
Seg7 13.4235 13.6796
Seg8 13.2032 13.1967
Seg9 12.9923 13.2406
Seg10 13.5785 13.7664
103_1305031931979_B.wav
Seg1 1.0074 2.0011
Seg2 0.85361 1.2119
Seg3 0.73026 0.54173
Seg4 0.72377 0.83007
Seg5 0.84982 1.0803
Seg6 1.4503 2.121
Seg7 0.65694 1.8496
Seg8 0.90006 0.8452
Seg9 1.3787 0.90407
Seg10 2.2954 1.327
Seg11 1.5564 2.4287
106_1306776721273_C2.wav Seg1 1.2706 1.7075
Seg2 -0.24437 1.1495
Sound
Name of segment (seg)
Before After
LMS Doctor’s
201108011118.wav
Seg 1 Normal Normal Normal Seg 2 Normal Normal Normal Seg 3 Normal Normal Normal Seg 4 Normal Normal Normal Seg 5 Normal Normal Normal Seg 6 Normal Normal Normal Seg 7 Normal Normal Normal Seg 8 Normal Normal Normal Seg 9 Normal Normal Normal Seg10 Normal Normal Normal Seg11 Normal Normal Normal
201108222221.wav
Seg1 Abnormal Abnormal Abnormal Seg2 Abnormal Abnormal Abnormal Seg3 Abnormal Abnormal Abnormal Seg4 Abnormal Abnormal Abnormal Seg5 Abnormal Abnormal Abnormal Seg6 Abnormal Abnormal Abnormal Seg7 Abnormal Abnormal Abnormal
201106221450.wav
Seg1 Abnormal Normal Normal
Seg2 Normal Normal Normal
Seg3 Normal Normal Normal
Seg4 Normal Normal Normal
Seg5 Normal Normal Normal
Seg6 Normal Normal Normal
Seg7 Normal Normal Normal
Seg8 Normal Normal Normal
Seg9 Normal Normal Normal
Seg10 Abnormal Normal Normal
103_1305031931979_B.wav
Seg1 Normal Normal Normal
Seg2 Abnormal Normal Normal Seg3 Abnormal Normal Normal Seg4 Abnormal Normal Normal Seg5 Abnormal Normal Normal
Seg6 Normal Normal Normal
Seg7 Normal Normal Normal
Seg8 Normal Normal Normal
Seg9 Abnormal Normal Normal Seg10 Normal Normal Normal Seg11 Normal Normal Normal
106_1306776721273_C2.wav Seg1 Abnormal Normal Normal Seg2 Abnormal Normal Normal
ISSN (Print) : 2320 – 3765 ISSN (Online): 2278 – 8875
I
nternational
J
ournal of
A
dvanced
R
esearch in
E
lectrical,
E
lectronics and
I
nstrumentation
E
ngineering
(An ISO 3297: 2007 Certified Organization)
Vol. 5, Issue 1, January 2016
Figure 22: shows filtered and raw sounds viewed in Gold-wave software by the doctor.
Five test sound analysis of the phonocardiogram are shown as listed in table 1 and 2. The first step in the analysis of segmentation includes homo morphic filtering. The energy of a heart sound signal is obtained as a squared amplitude of the signal. A logarithm of the squared amplitude for a test heart sound is taken. It is then filtered using a low-pass filter with a cut-off frequency of 10 Hz in order to remove murmurs that hinder the segmentation. The exponential of the resulting output of the filter is calculated which is then threshold to 0.8 times the mean value as per [2]. The sounds above the threshold are considered heart sounds while the remaining is discarded. The steps for segmentation are shown in figures 2, 6, 10, 14 and 18. The heart sounds are time marked as sounds S1 (small amplitude shown by green lines) and S2 (larger amplitude shown by red lines). It is clear from figures 4, 8, 12, 16, 20. The segmented heart sounds usually designated by y, are compared with the dataset of normal and abnormal raw heart sounds segment-wise. Each segment of the raw test sound is then classified as normal or abnormal depending on the result of the k-means clustering algorithm.
The k-means clustering algorithm is implemented for the resulting segments of raw heart sounds. A minimum value of k=3 is arbitrarily fixed. The features used here are the mean value of each segment, the standard deviation and the variance. Using these features, a k-means algorithm first calculates the Euclidean distance between the segments of the raw test heart sound and the heart sound segments of the training dataset of normal and abnormal heart sounds. Smaller the value of Euclidean distance more normal is the heart sound. The result is displayed in the command window as normal or abnormal.
The second part of the automatic classification is the classification of the LMS filtered heart sound obtained by adaptive filtering of raw test heart sound. The LMS algorithm is used to generate the filtered training dataset consisting of normal and abnormal heart sounds. The parameters of the algorithm are set so as to remove the noise and retain the murmur portion of the heart sound along with S1 and S2 sounds. The parameters are fixed as follows:
The step size µ=0.1; The filter length M=10; The leakage factor =0.1; The delay=10 samples.
The LMS algorithm is used with the same parameters to create a filtered training dataset and to filter the raw test sound. The raw test sounds are LMS filtered and designated as ylms. The LMS filtered sounds are then further segmented using the same homo morphic filtering method discussed above. The steps for segmentation are shown in figures 3, 7, 11, 15 and 19. The segmented heart sounds are shown in figures 5, 9, 13, 17 and 21. The figures show that most of the noise present in the heart sound had been filtered out.
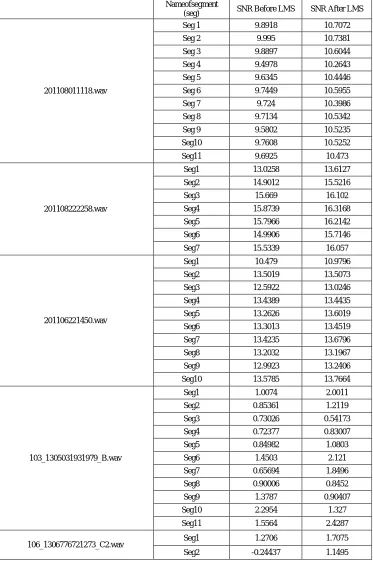
The segmental signal to noise ratio is also calculated for the test sound segments both filtered and raw. It is given by equations (1) and (2) as, overall_SNR_raw and overall_SNR_filtered
Overall SNR_raw = 10*log10 (sum (y. ^2)/sum ((y-ylms). ^2));(1) Overall SNR_raw = 10*log10 (sum (y-ylms. ^2)/sum ((y-ylms). ^2));(2)
Table 2 shows the classification of heart sound segments of the test sound before and after LMS filtering. Table 2 reveals that the sound 201108011118.wav had all its segments normal before and after LMS filtering. There were eleven segments. The sound 201108222221.wav had all its segments abnormal before and after LMS filtering. There were seven segments. In sound 201106221450.wav segment 1 and 10 were abnormal before LMS filtering but became normal after LMS filtering. This is inherent due to presence of noise that got cancelled with the filtering. Remaining segments were normal in both instances. There were 10 segments in all. In the sound103_1305031931979_B.wav same results were observed. Segments 2, 3, 4 and 9 which were abnormal in the first case turned out to be normal in the latter case. Other segments remained normal. There were 11 segments in all. In sound 106_1306776721273_C2.wav all segments were abnormal before LMS and became normal after LMS. There were only two segments in all.
All the test sounds were tested in consultation with the cardiologists. The heart sounds both raw and filtered were analysed using Gold-wave software. Gold-wave aids a cardiologists in revealing information about the presence of noise or murmur in the heart sound. The audio-visual interpretation of the presence of noise, murmur and heart sounds were given by the cardiologists and the detailed analysis is listed in tables 1 and 2. The cardiologists’ feedback reveals that all sounds classified under LMS filtered matched the cardiologists’ results. Figure 22 shows the screenshot of a Gold-wave software showing LMS filtered and raw sounds.
The feedback of the cardiologists along with the automatic classification algorithm results reveals a great deal of information about the nature of heart sounds. In sound 201108011118.wav noise did not affect the classification or in other words there was minimal noise. Classification yielded a normal sound with 100% accuracy. In sound 201108222221.wav too noise did not affect the classification or in other words there was minimal noise. Classification yielded an abnormal sound with 100% accuracy. In sound 201106221450.wav noise did affect classification. The classification accuracy was 80% before filtering and 100% after filtering. In sound 103_1305031931979_B.wav sound affected classification. Before filtering the accuracy was 55% normal and 100% accuracy of normalcy was obtained after filtering. In sound 106_1306776721273_C2.wav noise completely misclassified the sound. Before filtering the accuracy was 0% normalcy and after filtering the accuracy was 100%.
IV. CONCLUSION
Automatic classification of phonocardiogram involves quick and easy classification of heart sound. Usually the recording of phonocardiogram is done in noisy environments. As the doctors require quick and urgent analysis of heart sounds a concrete platform is necessary. Since noisy phonocardiogram yield inaccurate results, automatic classification of phonocardiogram could yield a much needed platform for early diagnosis of diseases. This work utilises a simple but robust method of segmentation called segmentation by homo-morphic filtering. The segmentation of the heart sound utilised in this work will be helpful for the doctors to gauge different vital parameters of heart sound and ailments. For example segmentation could be used to calculate the heart rate, which itself is a vital parameter for determining the condition of heart.
Since phonocardiogram is a nonlinear signal it is often difficult to remove the background noise. So LMS algorithm will prove to be a vital tool in removing such noises which is a part of this work. Removing the noise has the advantage that SNR will be greatly improved and the clarity of the sound both in terms of audio and visual will be improved. The work also focusses on k-means clustering algorithm for classification purpose. It utilises Euclidian distance as a measure of calculating the normality or abnormality of heart sound. Since it requires very less computational requirements performs at high speed and more accurately even in noisy environments it has been discussed in this work.
All together the combination of all three algorithms along with cardiologists’ feedback has provided a great opportunity to build a system with high accuracy that is capable of providing good and reliable results.
V. FUTURE SCOPE
Phonocardiography has a bright future. Especially it is very convenient for early and fast detection of diseases for a doctor using the principles, methods and practises of phonocardiography. This works entitles for non-real time acquisition of phonocardiogram and its classification in noisy and noiseless environments.
ISSN (Print) : 2320 – 3765 ISSN (Online): 2278 – 8875
I
nternational
J
ournal of
A
dvanced
R
esearch in
E
lectrical,
E
lectronics and
I
nstrumentation
E
ngineering
(An ISO 3297: 2007 Certified Organization)
Vol. 5, Issue 1, January 2016
ACKNOWLEDGEMENTS
The authors thank the doctors of KMC Hospital, Mangalore for validating the test sounds for murmur, noise and normalcy for comparison with the above obtained results.
REFERENCES
1. P Bentley et al.Classifying Heart Sounds Challenge. The PASCAL (2011).
2. P Ramaswamy and Ventus, Biological Signal Analysis. Publishing ApS, ISBN (2010).
3. MSVishwanath, et al. Phonocardiography–the future of cardiac Auscultation, International Journal of Scientific & Engineering