GENETICS | INVESTIGATION
A Composite-Likelihood Method for Detecting
Incomplete Selective Sweep from Population
Genomic Data
Ha My T. Vy* and Yuseob Kim†,1
*Interdisciplinary Program of EcoCreative and†Department of Life Science, Ewha Womans University, Seoul, Korea 120-750
ABSTRACT Adaptive evolution occurs as beneficial mutations arise and then increase in frequency by positive natural selection. How, when, and where in the genome such evolutionary events occur is a fundamental question in evolutionary biology. It is possible to detect ongoing positive selection or an incomplete selective sweep in species with sexual reproduction because, when a beneficial mutation is on the way tofixation, homologous chromosomes in the population are divided into two groups: one carrying the beneficial allele with very low polymorphism at nearby linked loci and the other carrying the ancestral allele with a normal pattern of sequence variation. Previous studies developed long-range haplotype tests to capture this difference between two groups as the signal of an incomplete selective sweep. In this study, we propose a composite-likelihood-ratio (CLR) test for detecting incomplete selective sweeps based on the joint sampling probabilities for allele frequencies of two groups as a function of strength of selection and recombination rate. Tested against simulated data, this method yielded statistical power and accuracy in parameter estimation that are higher than theiHStest and comparable to the more recently developednSLtest. This procedure was also applied to AfricanDrosophila melanogasterpopulation genomic data to detect candidate genes under ongoing positive selection. Upon visual inspection of sequence polymorphism, candidates detected by our CLR method exhibited clear haplotype structures predicted under incomplete selective sweeps. Our results suggest that different methods capture different aspects of genetic information regarding incomplete sweeps and thus are partially complementary to each other.
KEYWORDSpositive selection; selective sweep; composite likelihood; polymorphism
P
OSITIVE natural selection is one of the most fundamen-tal driving forces for biological evolution. However, it is known that mutations conferring higher relative fitness to carriers, or beneficial mutations, do not occur frequently at a given gene or genomic region of interest in most natural populations of plants and animals. Even if a beneficial allele is currently under strong directional selection, its direct iden-tification at the sequence level is not easy since the allele frequency change is likely to be too slow to follow over time in typical population genetic surveys unless the generation time is very short and a large amount of serially sampled sequences are available. Therefore, it is extremely difficult to directly follow the random occurrence of beneficial mutationsand their spread under selective environments in nature. For this reason, the investigation depends heavily on detecting the signature of past episodes of positive selection, whether the beneficial mutation is alreadyfixed in the population or still on the way tofixation (i.e., ongoing selection for a mutation that occurred in the past but still segregating in the population), from the present-day patterns of within- and between-species genetic variation (reviewed in Nielsen 2005; Sabeti et al.
2006; Akey 2009; Stephan 2010). Such signatures of positive selection provide information for reconstructing evolutionary events that happened in the population’s history. In addition, signals of positive selection imply functional importance of the loci and thus can be used to identify genetic variation that contributes to phenotypic diversity or annotate the genome functionally (Biswas and Akey 2006).
One of the basic methods for detecting positive selection is to search for the distinct pattern of within-species genetic variation left by a“selective sweep.”A selective sweep occurs when a new advantageous mutation increases in frequency quickly in the population and results in a great reduction in variation, a temporary increase in linkage disequilibrium, and Copyright © 2015 by the Genetics Society of America
doi: 10.1534/genetics.115.175380
Manuscript received February 5, 2015; accepted for publication April 23, 2015; published Early Online April 24, 2015.
Supporting information is available online at www.genetics.org/lookup/suppl/ doi:10.1534/genetics.115.175380/-/DC1.
1Corresponding author: Department of Life Science, Ewha Womans University,
a skew in allele frequency distribution in the nearby region of a recombining chromosome (Maynard Smith and Haigh 1974; Kaplanet al.1989; Fay and Wu 2000; Kim and Nielsen 2004). A selective sweep may be“complete”when the advantageous mutation goes to fixation and all local variation is removed except those that escaped the sweep by recombination. This type of selective sweep has drawn much attention and a num-ber of statistical tests, mostly based on summary statistics such as Tajima’sD, Fu and Li’sDandF, and Fay and Wu’sHtest, were proposed to detect mainly complete positive selection from sequences sampled shortly after thefixation of a benefi -cial mutation (Tajima 1989; Fu and Li 1993; Fay and Wu 2000). More advanced statistical tests based on composite likelihood were also proposed (Kim and Stephan 2002; Meiklejohnet al.2004; Nielsenet al.2005).
Hudsonet al.(1994)first observed evidence of an ongo-ing selective sweep—a subgroup of sampled sequences har-boring very low variation due to linkage to the putative beneficial allele that reached an intermediate frequency— at theSodlocus inDrosophila melanogaster. However, as the availability of population genomic data was limited and dis-covering rare episodes of recent selective sweeps was con-sidered very difficult in natural populations, capturing such “incomplete”or ongoing selective sweeps must have been considered even more difficult. Therefore, theoretical work mainly focused on inferring selective sweeps that were al-ready completed in the past (Kaplan et al. 1989; Barton 1998; Fay and Wu 2000; Kim and Stephan 2002; Przeworski 2002). However, Sabeti et al. (2002), in one of the first large-scale population genomic surveys for detecting recent positive selection, showed that the human genome harbors a number of loci with clear signatures of incomplete selec-tive sweeps. Since then, detecting this type of selecselec-tive sweep soon became an important topic in both empirical and theoretical population genetics (Quesada et al. 2003; Meiklejohn et al. 2004; Sabeti et al. 2006; Saunders et al.
2006; Voightet al.2006).
Sabetiet al.(2002) introduced a long-range haplotype test based on extended haplotype homozygosity (EHH) that quan-tifies the residual association between an allele at the core locus and its genetic background (i.e., the linked haplotype at the time of the allele’s mutational origin). Under neutrality, a haplotype associated with an allele at higher frequency extends to a shorter distance, thus yielding smaller EHH, since the allele is older (Toomajianet al.2003). A significantly large EHH for a given allele frequency at the focal locus then sug-gests the hitchhiking effect driven by positive selection. If the ancestralvs.derived alleles of a polymorphic site can be dis-tinguished, positive selection is expected to generate a much larger EHH for the derived allele than that for the ancestral allele. This is the rationale of theiHSstatistic in Voightet al.
(2006) that is now routinely used in population genomic stud-ies. Recently, Ferrer-Admetlla et al.(2014) proposed a new statistic,nSL, that is similar toiHSbut is robust to
recombina-tion rate variarecombina-tion and exhibits improved power to detect sweeps.
The success and popularity of discovering incomplete sweeps may be attributable to unique haplotype structures that can be relatively easily and reliably captured by a rather simple test statistic such as iHS. If the local mutation rate fluctuates, it may create a random region of severely reduced variation that might be taken as a candidate for a complete selective sweep (Kim and Stephan 2002). With an incomplete sweep, the pattern of polymorphism in the haplotype block containing the ancestral allele of the focal locus reflects ge-netic variation that existed before the start of the selective sweep. Then, this haplotype block is effectively a negative control for the selective sweep that would alleviate the prob-lem of localfluctuation in mutation rate. In the case of local adaptation, the inclusion of sequences from a neighboring deme, where positive selection did not take place, into analy-sis was shown to increase the statistical power of detecting positive selection (Innan and Kim 2008). The ancestral hap-lotype block in an incomplete sweep is expected to play a sim-ilar role in increasing statistical power to detect selection to that of the neighboring deme for complete sweeps.
sequencing (NGS) methods, which inevitably contain occasional low-quality or missing base calls. The composite-likelihood ap-proach can be straightforwardly applied to such data with miss-ing information. By applymiss-ing this method to simulated data and a population genomic data set inD. melanogaster, we demon-strate that this approach improves our ability to detect clear signatures of incomplete selective sweeps.
Materials and Methods
Sampling probability under an incomplete selective sweep
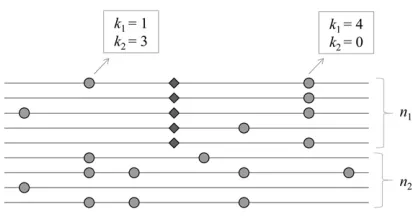
We aim to detect the signature of an incomplete selective sweep in which a beneficial allele originating from a single event of a point mutation (thus a hard selective sweep) reaches an intermediate frequency in a population. Consider multisite polymorphism observed in the alignment of n ran-domly sampled homologous chromosomes (Figure 1). It is assumed that neutral alleles segregate at these polymorphic sites, except one under selection (denoted the“Slocus”) with n1copies of the beneficial allele andn2(=n–n1) copies of
the ancestral allele. The strength of selection for the beneficial allele is given bya= 2Ns, whereNis the number of diploid individuals in the population andsis the selection coefficient [the relativefitness of the beneficial over the ancestral allele is 1 +s, assuming codominance (h= 0.5)]. At a neutral site that isdnucleotides away from theSlocus, letk1(k2) be the count
of the derived allele in the subsample ofn1(n2) chromosomes
carrying the beneficial (ancestral) allele. Ifdis small enough to generate the hitchhiking effect of the beneficial allele, an increased or decreased frequency of the derived neutral allele due to hitchhiking is reflected byk1/n1, while its frequency
before hitchhiking is estimated by k2/n2, assuming that the
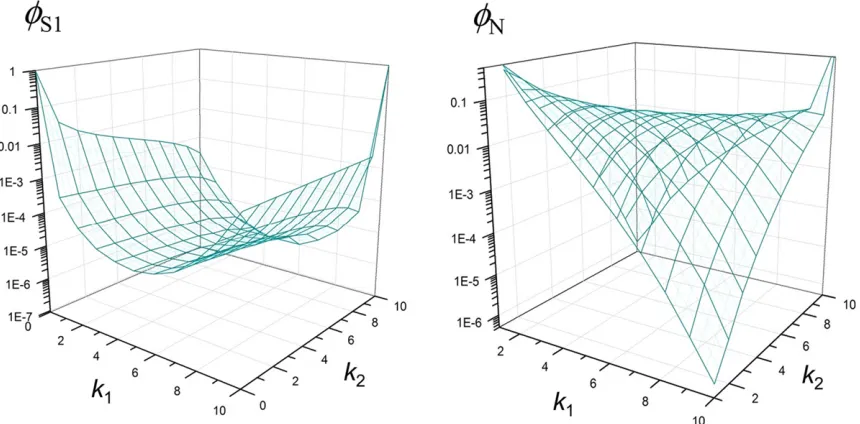
frequency of the neutral allele among chromosomes carrying the ancestral allele at theSlocus does not change during the sweep (seeAppendix). Therefore, the hypothesis of an incom-plete sweep acting on the (putative)Slocus predicts a very distinct joint probability distribution ofk1andk2, compared to
an alternative (i.e., neutral) hypothesis (Figure 2). Our goal is to build a parametric test based on this joint sampling proba-bility, denoted byf[fðk1;k2;n1;n2;dÞ;for detecting an
in-complete selective sweep (i.e., identifying theSlocus in DNA sequence polymorphism).
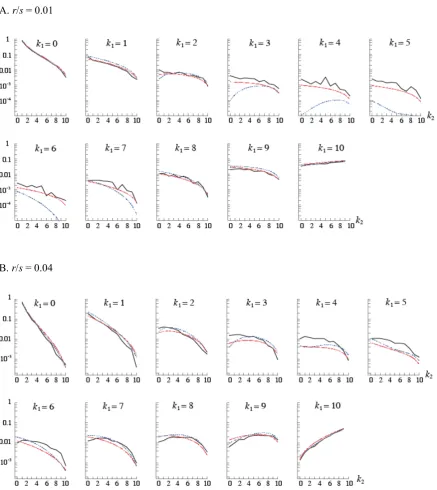
We obtained two approximate solutions to such a joint sampling probability, fS1 andfS2;by modifying the
equiva-lent solution for complete sweeps in Nielsenet al.(2005) and that in Etheridgeet al.(2006), respectively (Appendix). The corresponding probability under the null hypothesis (no selec-tion),fN;can also be obtained. The primary parameter that determinesfS1andfS2isr=s¼R=ð2aÞ;wherer=rnd(rn=
recombination rate per nucleotide per generation) is the re-combination rate between theSlocus and the neutral site and
R= 4Nr. In comparison against simulated data generated by
msms (Ewing and Hermisson 2010) under the model of an incomplete sweep,fS2approximates the sampling probability
much better thanfS1for small recombination rates
(Support-ing Information,Figure S1). However,fS2is not applicable for
larger recombination rates (r=s.1=Pin¼2111=i) (Etheridge et al.2006).
CLR test
Letxbe the position of the putativeSlocus, which is assumed to be one of the polymorphic sites in the sequence alignment and thus partition the data into subsamples ofn1andn2
chro-mosomes carrying the derived and ancestral alleles at the locus, respectively. n1 is also denoted asn1(x) to emphasize
that the positionxuniquely determines the derived allele fre-quency of the putative Slocus. This partition by the Slocus also determines the counts of the derived neutral allele at nucleotide site iin the two subsamples, kð1iÞ and k
ðiÞ 2 : Then,
for a givenx, a maximum-composite-likelihood estimate of the strength of selection,a^ðxÞ, is obtained as a value ofa(ifRper site is externally given) that maximizes the CLR,
Lðx;aÞ ¼logLISðx;ajDataÞ
LNðDataÞ ;
(1)
where
LISðx;ajDataÞ ¼PðDatajx;aÞ
¼Q
i6¼x
fS:kð1iÞ;k2ðiÞ;n1;n2;ji2xj
(2)
and
LNðDataÞ ¼
Y
i
fNkð1iÞ;k2ðiÞ;n1;n2
(3)
are composite likelihoods under the hypotheses of incomplete selective sweep and neutrality, respectively. In the following, unless stated otherwise we use onlyfS1for Equation 2 despite
its error for smallr/s. The impact of this error on the perfor-mance of our likelihood test is addressed below. Unless stated otherwise, multiplication above is done across all sites in the data, including monomorphic sitesðkð1iÞ¼k
ðiÞ
2 ¼0Þ:It is also
possible to multiply probabilities over polymorphic sites only (analogous to L2 and L4 in Kim and Nielsen 2004), which
It is straightforward to calculate the CLR given in Equation 1 in the presence of missing values in sequence data, for example due to low-quality base calls that are common in NGS data sets. If missing base calls are made at a site on chromosomes in the sample, the sampling probability for this site is calculated aftern1and/orn2are reduced accordingly. If
base calls are missing at the core SNP (the putativeSlocus), entire chromosomes carrying the missing base calls are ex-cluded from the calculation of composite likelihoods.
Next, the maximum-composite-likelihood estimate of the locus under selection is obtained by calculating a^ðxÞ for all polymorphic sites in a given chromosomal region and then identifying the site (at position ^x) that maximizes Lx:¼
Lðx;a^ðxÞÞ:This procedure also implies that a test statistic for hypothesis testing would be given by
T0¼max
x Lx (4)
and we may reject the null hypothesis (neutrality) if T0 is
larger than a certain cutoff value. The null distribution ofT0
is determined by applying the above calculation to polymor-phic sites in a large number of data sets simulated under the neutral model. Imposingfixed polymorphic sites (-s option in ms) orfixed scaled mutation rate (-t option) but conditioning on the similar number of polymorphic sites in simulated data led to almost identical distributions (data not shown). How-ever, it was observed that the maximum CLR for a given focal site (Lx) is negatively correlated withn1ðxÞ, most likely
be-cause a derived allele with smaller allele frequency originated more recently and is thus associated with a longer extended haplotype. If not corrected, this will bias the estimated locus of selection to be a polymorphic site with a lower frequency of the derived (putatively beneficial) allele. A solution to this problem would be to transformLx to remove its correlation
withn1ðxÞ:We tried and evaluated various forms of the
nor-malized test statistic. The following procedure yielded the most optimal performance of parameter estimation (see below). Let
mðfÞ and Qðf;eÞ be the mode and the 12 equantile of the distribution ofLx obtained from polymorphic sites whose
de-rived allele frequency isfin simulated neutral data sets. Then, we define a new statistic
T1¼max
x T1x¼maxx
Lx2mðn1ðxÞÞ
Qðn1ðxÞ;eÞ2mðn1ðxÞÞ:
(5)
Then, the estimated location of the S locus, ^x; is the value of xthat achieves the maximum in the above formula. This also leads to the final estimate of the strength of selection, ^
a[a^ðxÞ;for a given set of sequences. For a givene, the null distribution ofT1is obtained by applying the above procedure
to a large number of sequence samples, with an equivalent number of polymorphic sites and a scaled recombination rate, that are generated by neutral simulation. Unless stated other-wise, we reject the null hypothesis of neutrality (no selection) with significance levelP= 0.001, which resulted in an optimal range of statistical powers with varying parameter values cho-sen below.
Analysis of D. melanogaster population genomic data
replacing it by a sequence of “N” characters. Then, we extracted a phased table of polymorphic sites with their phys-ical locations. Next, the ancestral and derived alleles were inferred using the syntenic assembly of D. melanogasterand
D. simulans(available atwww.dpgp.org) and designating the allele observed insimulansas ancestral or the table of ances-tral allele probability for polymorphic sites calculated for DPGP1 RAL sequences (Chan et al. 2012). This procedure could assign the ancestral/derived states for 85% of poly-morphic sites obtained above. The remaining polypoly-morphic sites were not included in inputfiles. We also excluded from analysis the telomeric and centromeric regions of each chro-mosome arm with low recombination rates: from the midpoint of a chromosome arm we moved toward the telomere and toward the centromere until the points over which the mean genetic distance per megabasefirst becomes,1 cM, using the best-fitting equations for crossing-over rates on 100-kb win-dows obtained by Comeronet al.(2012).
Composite likelihood is calculated by taking a SNP as the putative Slocus (“core SNP”): thus the sample is partitioned
into n1 and n2 sequences as described above. The sample
frequency of the focal derived allele is thereforef=n1/(n1+n2).
Note that, as this SNP may contain missing values (N in data) and the corresponding chromosomes are excluded from calculating the composite likelihood,n1+n2can be,22. For
computational convenience, we assumed scaled recombina-tion rate 4Nrn= 0.012 per site in the calculation of likelihood
for all chromosome arms. As sampling probability under se-lection is primarily a function of r=s¼R=ð2aÞ; but only slightly modified byaalone, a deviation of actual recombi-nation rate from the above assumption would lead to a corre-sponding error in the estimate of a, without affecting the location and value of the maximum-composite-likelihood ra-tio. Localfluctuation in the scaled mutation rate,u, was also ignored: we estimated meanufor each chromosome arm and used it in the calculation of likelihoods for any region within the chromosome arm. Incorrect assumptions ofuwere shown to affect minimally the performance of our test (see below). Joint sampling probabilities were obtained using the approximation proposed in Nielsen et al. (2005), i.e., fS1; assuming that the ancestral pattern of polymorphism at the time of the beneficial mutation follows either standard neutral equilibrium (test option A) or the currently observed genome-wide empirical frequency spectrum (test option B) (Appendix). The significance of the CLR, maximized with respect toaand then normalized for the derived allele frequency, is assessed as described forT1above, however, using the site-wise null
dis-tribution of CLR obtained from individual polymorphic sites (5 3 105 SNPs) generated by msms under neutrality, with
parameters adjusted to match sample size, mean recombina-tion rate, and the mean density of polymorphic sites to those ofDrosophilagenome data. Namely, multiple-test correction, as implemented above by the null distribution of the local maximum of test statistic (T1) in a window of defined
se-quence length, is not performed here. Therefore, a P-value determined this way cannot be compared to that used for
analyzing simulated incomplete sweeps above. We consider sites that yield large normalized CLR, corresponding toP,
0.001, as candidate loci under selection. This level of signifi -cance is rather arbitrary. However, rather questionable candi-dates of incomplete sweeps (with unclear haplotype structure upon visual inspection; see Results below) are already de-tected at this level and, therefore, a less stringent level will likely increase the number of such loci.
Haplotype homozygosity tests
We applied two haplotype homozygosity tests, iHS (Voight
et al. 2006) andnSL(Ferrer-Admetlla et al.2014), to detect
incomplete sweep in simulated data as well asD.melanogaster
data. For the analysis of simulated data, unstandardized iHS
(log[iHHA/iHHD]) was calculated for individual polymorphic
sites according to Voightet al.(2006), using the rehh R pack-age (Gautier and Vitalis 2012) (http://cran.r-project.org/web/ packages/rehh/index.html), and unstandardizednSL was
calculated through the program provided by Ferrer-Admetlla
et al.(2014) athttp://cteg.berkeley.edu/~nielsen/. Using the same set of simulated neutral samples as used above for CLR analysis, the 12equantile and mode of the distribution of the unstandardizediHSwere obtained for each derived allele fre-quency and these values were used to define standardizediHS
by applying the procedure of obtainingT1by Equation 5. The
test statistic for detecting an incomplete selective sweep in a replicate of a 100-kb sequence sample is therefore the most negative standardized iHSamong sites and the procedure of obtaining the null distribution and assessing the significance of this statistic is identical to that ofT1by the CLR method. The
same normalization procedure was applied for thenSLstatistic.
We also tried the standardization procedure based on the as-sumption of normal distribution described in Voight et al.
(2006) for both statistics and discovered that our standardiza-tion procedure leads to slightly increased statistical power (data not shown).
For the genomic scan of D. melanogaster data below, we first obtained standardized iHS and associated P-values for individual polymorphic sites in the data according to the pro-cedure described by Voight et al. (2006) performed by the rehh package. In the calculation of iHHA andiHHD by this
package haplotype homozygosity for sequences does not ex-tend from the core SNP if missing base calls are encountered in a subset of the sequences. Namely, missing bases (N) are treated as an allele distinct from A, C, G, or T. We found that this frequently generates very small iHHA and thus
errone-ously very negativeiHS(i.e., false detection of selection). To correct this problem, we wrote our own code that calculates
iHHAandiHHDwhile skipping positions of missing bases in
These corrections led to detection of clearer signatures of in-complete sweeps (upon visual inspection of haplotype struc-tures). For thenSL statistic, since wefind it less sensitive to
missing data thaniHS, we used the same input data as used for the CLR test and then performed standardization accord-ing to Ferrer-Admetllaet al.(2014).
Simulated data under different demographic assumptions
To explore the robustness of the CLR test to demographic assumptions, we generated neutral data sets, using msms
(Ewing and Hermisson 2010) under three different scenarios: population bottleneck, exponential population growth, and population subdivision. All data sets were generated with equal sequence length (100 kb) and number of polymorphic sites (3000). For the bottleneck model, we simulated a population bottleneck lasting from 0.4Nto 0.2Ngenerations in the past with different severitiesc= 0.4, 0.2, and 0.1 (c=Nb/N, where Nbis the population size during the bottleneck). In the case of
the exponential growth model, populations start growing ex-ponentially from a population size of 0.4N, with three different growth rates g= 10, 100, and 500. For the population sub-division model, we simulated a two-island model with symmet-ric, constant migration ratesM= 0.1, 1, 10 and then drew all sequences for each sample from one island. We also varied the recombination rate [R (per 10 kb) = 4000, 6000, 8000, 10,000, 12,000] in each model to study the effect of altered linkage disequilibrium on the null distribution. For each pa-rameter set, at least 1000 replicates with a sample size of 20 chromosomes were obtained.
Codes and scripts
All source codes developed here for analyzing simulated and actual data are available upon request. Command line scripts for simulations performed above usingmsandmsmsare pro-vided inFile S1.
Results
Statistical power of the composite-likelihood test
To evaluate the performance of the composite-likelihood method described above, we applied it to simulated data sets generated by msms(Ewing and Hermisson 2010) under the model of incomplete selective sweeps. In simulation, the ben-eficial allele of theSlocus, located in the middle of the 100-kb sequence, reaches frequency b= 0.5 in the population and a sample of 20 sequences is generated. Then, test statisticT1in
Equation 5 was determined after the maximum CLRs were calculated over all SNPs in the sample with derived allele frequency $3 and #17. The null hypothesis of neutrality was rejected ifT1.the 99.9th percentile of the null
distribu-tion, which was obtained from data sets simulated under the model of neutral equilibrium with the same sequence length and recombination rate. This cutoff value (P= 0.001) ofT1is
a function of e. When various values of e (0.0006, 0.001, 0.0016, 0.002, and 0.003) were tried, the statistical power
fluctuated moderately (5%) while e = 0.002 resulted in the best performance in parameter estimation (the largest proportion of replicates in which the correct site, at position 50 kb, yielded the largestT1). We thus usee= 0.002 in the
following analyses.
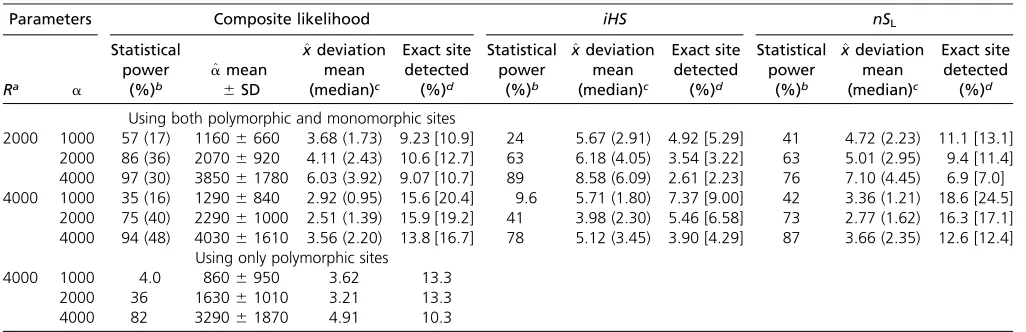
The statistical power of the test increased as the final frequency of the beneficial mutation,b, in the population in-creased: withR= 2000,a= 2000, andbincreasing from 0.3 to 0.7 by 0.1, the statistical powers were 0.45, 0.71, 0.87, 0.95, and 0.98, respectively. This test performed better with largerbpresumably because as a larger proportion of individ-uals (thus sequences in a sample) are affected by selection, the pattern of polymorphism becomes more distinctive from the neutrality, and also because the uS component of sampling probability was obtained from the solution obtained for a com-plete selective sweep. For a fixed value of b, the statistical power increased with increasing strength of selection, as expected (Table 1).
This performance of the composite-likelihood test was compared to that of long-range haplotype methods that use
iHSandnSLstatistics (Voightet al.2006; Ferrer-Admetllaet al.
2014). Instead of using the normal distribution-based standard-ization ofiHSandnSL, we applied the normalization procedures
that were used to obtainT1above (seeMaterials and Methods),
which made it possible to directly compare the performance of the CLR,iHS, andnSLmethods. In all parameter sets tested, the
statistical power of our composite-likelihood method is higher than that of iHSbut only slightly better than that of thenSL
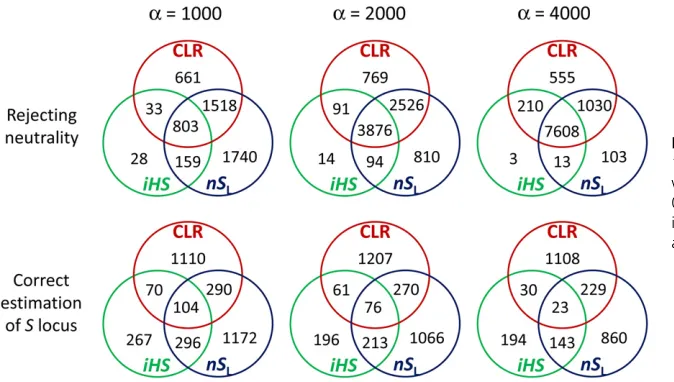
method [Table 1; note that results here were obtained assum-ing that the correct scaled recombination rate of the sequence is available (see below)]. Interestingly, there are a relatively large number of simulated incomplete sweeps detected by either CLR ornSLonly, particularly with weaker strength of selection
(Fig-ure 3), suggesting that the CLR andnSLmethods capture
dif-ferent aspects of data as signatures of incomplete sweeps and thus are largely complementary to each other.
Effect of recombination rate and linkage disequilibrium
The above result is based on the null distribution of the test statistic obtained from neutral simulations that used recombi-nation rates identical to those used in the simulation of incomplete sweeps. However, in practice, the correct rate of recombination, scaled or unscaled, for a given genomic region may not be available. This turns out to be a serious problem for our CLR method, as we found that the null distribution of the likelihood ratio is highly sensitive to the scaled recombination rate (Figure 4). It appears that, with decreasing recombination rate, linkage disequilibrium (LD) between adjacent polymor-phic sites increases and this inflates the likelihood of an in-complete sweep (LIS) relative to that of neutral evolution
(LN). Therefore, one approach to control the false-positive rate
2006), to generate samples with an equivalent level of LD [measured by the average r2 over all pairs of sites, wherer
is the normalized LD as measured by correlation of allele fquencies between two loci (Hill and Robertson 1968)] the re-combination rate needs to be greatly reduced in the neutral simulation. When we obtained the null distribution ofT1from
such low-recombination simulation, the statistical power of our CLR method decreased dramatically (Table 1). In contrast, the null distribution ofnSLwas affected minimally by recombination
rate variation (data not shown), as it was originally proposed to cope with uncertainty in recombination rates (Ferrer-Admetlla
et al.2014).
Inferring the strength of selection and the position of the S locus
Because sequences are randomly sampled from a population, the copy number of the beneficial allele,nB=n1(50,000), in
a sample is variable (binomial): withb= 0.5,nB,3 or.17
in,0.5% of replicates, which makes it impossible to detect the true locus under selection. In the other replicates, the exact locus is detected if the maximumT1is obtained at the
correct site (i.e.,bx= 50,000). Compiling results from all rep-licates (regardless of whether the correct site is inferred or not), wefind that the estimate of the strength of selectionab is unbiased, although the variance of the estimate is large (Table 1). More than half of replicates yielded bx within
1–3 kb from the target of selection. The proportion of rep-licates in which the exact site is inferred ranges from 9 to 16%, more accurate estimates occurring with higher recombination rates. If the sample frequency of the beneficial allele matches the population frequency (0.5), this proportion significantly increases (Table 1).
In theiHSandnSLmethods the estimated location of the S locus,bx, is given as the polymorphic site from which the most negative normalized statistic is obtained. Applied to the same sets of simulated data, bx byiHS was less accurate
than by either CLR ornSL(Table 1). The exact position of the Slocus was correctly inferred about three times more often by CLR than by iHS but roughly as often as by nSL. CLR also
yielded the smallest mean deviation ofbxfrom the true loca-tion. Overall, the accuracies of estimates are similar between the CLR and nSL methods. Surprisingly, however, the three
methods are weakly correlated with respect to estimating the exact location of selection (Figure 3): for example, applied to 10,000 replicates of simulation witha= 4000, the CLR and
nSLmethods detected the correct site under selection in 1390
and 1255 replicates, respectively. However, in only 252 rep-licates the correct site was detected by both methods. Again, this result suggests that the CLR andiHS/nSLmethods
cap-ture slightly different information in multisite polymorphism to detect incomplete sweeps and estimate the position of the putative Slocus. When we define a new estimate as the average over those by the CLR and nSL methods, its
mean deviation from the correct site in kilobases [i.e., ð^xCLRþ^xnSLÞ=2250;0003102
3] is 2.74, 2.42, and 3.25
for a = 1000, 2000, and 4000, respectively (with R = 4000), which is smaller than the deviation obtained by an individual method (Table 1). Therefore, small improve-ments in the accuracy of position estimates are made by combining the two methods.
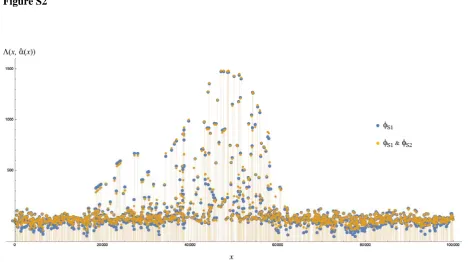
Modification of composite likelihoods
So far, sampling probability based on approximation by Nielsen
et al. (2005), fS1; was used for obtaining composite likeli-hoods. For small recombination rates (r=s,1=Pin¼2111=i), we
may replacefS1by more accurate approximation,fS2based
on Etheridge et al.(2006). This, however, did not lead to a significant change in the profile of the CLR (Figure S2). We also examined the effect of not including monomorphic sites in the data. When the CLR is calculated by multiplying joint sampling probabilities over only polymorphic sites in the data, it leads to lower statistical power to detect selection Table 1 Accuracy of parameter estimates using the composite-likelihood,iHS, andnSLmethods
Parameters Composite likelihood iHS nSL
Ra a
Statistical power (%)b ^ amean 6SD ^ xdeviation mean (median)c Exact site detected (%)d Statistical power (%)b ^ xdeviation mean (median)c Exact site detected (%)d Statistical power (%)b ^ xdeviation mean (median)c Exact site detected (%)d
Using both polymorphic and monomorphic sites
2000 1000 57 (17) 11606660 3.68 (1.73) 9.23 [10.9] 24 5.67 (2.91) 4.92 [5.29] 41 4.72 (2.23) 11.1 [13.1] 2000 86 (36) 20706920 4.11 (2.43) 10.6 [12.7] 63 6.18 (4.05) 3.54 [3.22] 63 5.01 (2.95) 9.4 [11.4] 4000 97 (30) 385061780 6.03 (3.92) 9.07 [10.7] 89 8.58 (6.09) 2.61 [2.23] 76 7.10 (4.45) 6.9 [7.0] 4000 1000 35 (16) 12906840 2.92 (0.95) 15.6 [20.4] 9.6 5.71 (1.80) 7.37 [9.00] 42 3.36 (1.21) 18.6 [24.5]
2000 75 (40) 229061000 2.51 (1.39) 15.9 [19.2] 41 3.98 (2.30) 5.46 [6.58] 73 2.77 (1.62) 16.3 [17.1] 4000 94 (48) 403061610 3.56 (2.20) 13.8 [16.7] 78 5.12 (3.45) 3.90 [4.29] 87 3.66 (2.35) 12.6 [12.4]
Using only polymorphic sites
4000 1000 4.0 8606950 3.62 13.3
2000 36 163061010 3.21 13.3
4000 82 329061870 4.91 10.3
aScaled recombination rate (4Nr) across the 100-k-long simulated sequence.
bPercentages of simulated samples that yieldP,0.001. In parentheses: using an adjusted recombination rate in neutral simulations to yield mean LD identical to that of data
to be analyzed.
cMean (median) deviation in kilobases of the estimated location of selection from the true location (x= 50,000):^x250;00031023:
and larger errors in estimating the strength and position of selection than when multiplication was done over all sites (Table 1). This result suggests that not only the (joint) fre-quency spectrum of polymorphism but also the spatial distri-bution or density of polymorphic sites contains information regarding incomplete selective sweeps.
Effect of complex demography
Next, to evaluate the robustness of the CLR method to complex demography and population structure, we examined how the null distribution of the test statistic (T1) changes if it is
obtained from data sets simulated under the models of popu-lation bottleneck, expansion, and subdivision (see Materials and Methods). In each model parameters were chosen to pro-duce a significant deviation of the frequency spectrum from that under neutral equilibrium. The number of polymorphic sites (3000) per sample remained constant for varying models and parameters. First, with a population bottleneck that lasted from 0.4Nto 0.2Ngenerations ago, decreasing the size of the bottlenecked population (c=NB/Ndecreasing from 0.2, 0.1, to
0.05) dramatically shifted the distribution of the CLR upward (Figure S3A). This shift appears to be explained by a reduction in scaled (population-level) recombination rate due to the bot-tleneck, which leads to increased LD: when the recombination rate was increased to reduce LD (quantified by mean pairwise r2), the distribution of the CLR shifted back downward (Figure
S4A). With matching LD, distributions obtained under the bot-tleneck (4Nrn= 0.1; meanr2= 0.0543) and under the
stan-dard neutral model (a constant-sized panmictic population; 4Nrn = 0.04; mean r2 = 0.0543) are very similar (Figure
S4A). However, the right tail of the distribution is still slightly larger than that of neutral equilibrium.
Similarly, the null distribution of the CLR shifts upward due to rapid exponential growth of population size (g.100) in the expansion model and limited migration (M, 1) in the subdivision model (Figure S3, B and C). Again, by increasing the recombination rate in the simulation, thus reducing the average level of LD among sites, these distributions are shifted downward. Similar distributions of the CLR (right tails) are
obtained from simulations under the standard and complex demography if the levels of LD match (Figure S4). These results suggest that, in the analysis of a genomic region for which underlying population demography and/or correct re-combination rate are not known, the false-positive rate of detecting incomplete sweeps by CLR can be greatly reduced, if not completely, by generating samples with matching LD by standard neutral simulation.
Results above were obtained by calculating the likelihood of incomplete sweeps, assuming the standard neutrality at the time of beneficial mutation [f0(p) =u/p; test option A].
We can replace f0(p) with the empirical distribution of the
derived allele frequency observed in the simulations of these demographic models (test option B). The latter option is essentially the approach by Nielsenet al.(2005) to mini-mize the compounding effect of complex demography in detecting the signature of selection. However, it had little effect in correcting the null distribution and did not prevent the inflation of the CLR with increasing LD between segre-gating sites (Figure S3).
Application to D. melanogaster genomic data
The composite-likelihood method described above was applied to population genomic data of D. melanogaster to detect in-complete sweeps. We used 22 haploid genome sequences from Rwanda (the RG sample) described in Pool et al.(2012). As the species’ancestral range is known to lie within southern and eastern Africa, the RG sample is likely to satisfy the assumption of equilibrium demography (constant-sized random-mating population before the start of the sweep in our model) better than any other available genomic data sets inD. melanogaster. However, when we examined the genome-wide distribution of derived allele frequency, a slight but clear deviation (excess of rare alleles) from the standard neutrality was observed (Figure S5). This is likely due to nonequilibrium demography (mild population bottleneck and recent population growth) that may have affected the RG sample (Poolet al.2012) but might also be due to errors in base calling and ancestral/derived state inference.
Figure 3 Numbers of simulation replicates (of 10,000) from which incomplete selection sweeps were detected (rejection of null hypothesis atP,
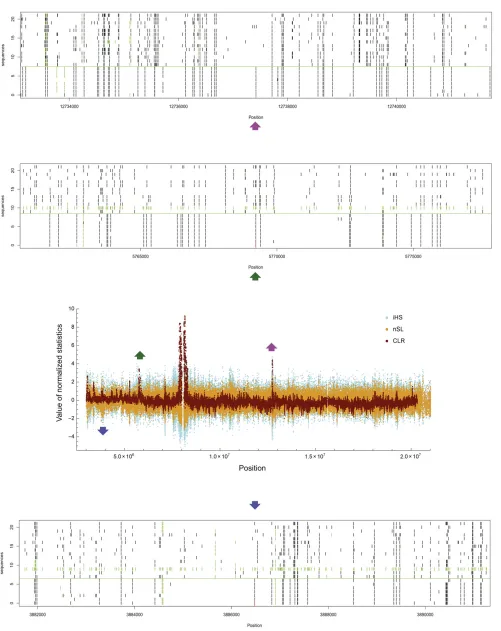
A genome scan was conducted by sequentially taking all polymorphic sites in the data with derived allele frequencies satisfying 0.35,f,0.8 as core SNPs and calculating com-posite likelihoods. We observed clear clustering of SNPs yield-ing a large CLR (Figure 5 for chromosome arm 2R), corresponding toP,0.001 (seeMaterials and Methods), scat-tered over thefive major chromosome arms. We consider each cluster as a footprint of a single episode of an incomplete selective sweep. (Other scattered and isolated sites that yield
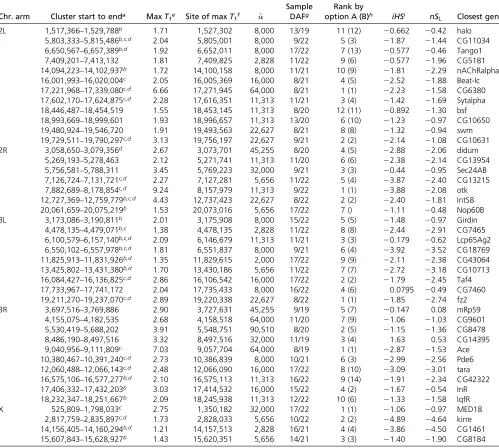
P , 0.001 but do not form clusters were not considered.) A SNP with the largest CLR within a cluster (the “peak”) is therefore a candidate position of ongoing selection. There are 42 clusters in total, using test option A, and we identified an annotated gene in FlyBase (version FB2014_03) containing or closest to the peak in each cluster (Table 2). Test options A and B generated very similar profiles of the CLR along the chromosome (Figure S6) and thus led to the detection of almost identical sets of candidate loci in each chromosome arm. When clusters are ranked according toT1 within each
chromosome arm, ranks by options A and B are strongly cor-related (Table 2). Upon visual inspection of aligned and sorted sequences, we observed clear segregating patterns of SNPs indicative of incomplete sweeps—far fewer polymorphisms and high linkage disequilibrium among chromosomes contain-ing the derived allele compared to those containcontain-ing the ances-tral allele at the core SNP—at the majority of these candidate loci (Figure 5 andFigure S7).
The calculations above were performed using a uniform value of scaled mutation rate,u, for each chromosome arm. To examine whether local variation in u has an effect on the accuracy of inference, we performed the CLR test with the local value ofucalculated from a 10-kb window surrounding each core SNP. This procedure yielded almost the same profile of composite likelihood along the chromosome and the same list of selection candidates (data not shown), presumably be-cause the ratio of composite likelihoods depends weakly onu:
change in u appears to affect LIS and LN in Equation 1 to
a similar degree.
Patterns similar to the outcome of incomplete selective sweeps may arise by a complete selective sweep: at an appropriate recombination distance from the position of the beneficial mutation that reachedfixation, low variation and high frequency of derived alleles would be observed among chromosomes whose linkages to beneficial mutation were not broken by recombination. However, a normal level of variation will be observed among chromosomes that recombined away from the beneficial mutation. We therefore checked whether our candidate regions of incomplete selective sweeps overlap with those of complete selective sweeps in the RG sample detected by Poolet al.(2012) (343 regions listed in their table S13). Seventeen of our 42 clusters overlap with the candidate regions of complete sweeps (Table 2).
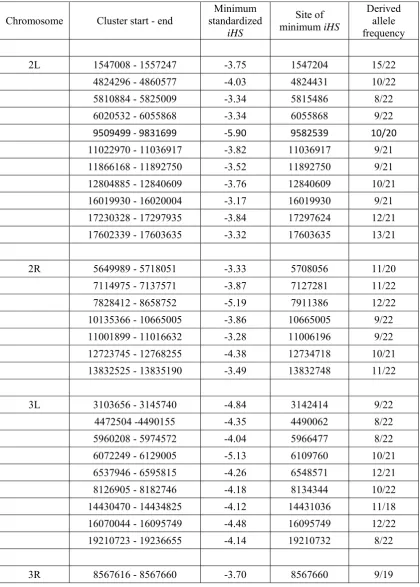
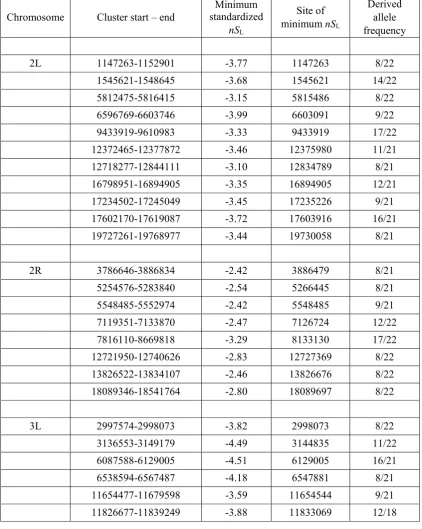
Next, we calculatediHSandnSLstatistics for the same data
set for which CLR was obtained above. Even though correc-tions were made to address the complexity of data (missing base calls and incomplete inference of ancestral/derived alleles; seeMaterials and Methods), many sites yielding very negativeiHSappear to be false positives because clear haplo-type structures predicted under incomplete sweeps are not observed at those loci (Figure S8). On the other hand, sites yielding very negativenSLare associated with a much clearer
haplotype pattern. However, there are still cases of very un-clear haplotype patterns detected by nSL (Figure S8). We
could identify clusters of negativeiHSand those of negative
nSL, similar to clusters of large CLR above. However, the
over-all pattern of clustering for negative iHS ornSL is not clear,
whereas very distinct clusters of large CLR were observed (Figure 5). Many sites generated large negative iHS or nSL
by themselves without belonging to any cluster and we did not consider them as candidate loci under selection. We found that these isolated occurrences of large negativeiHS/nSLand
other sites with large negative iHS/nSL but without clear
Figure 4 Distribution of maximum CLR, T0¼ maxx2S½10logðLIS=LNÞ; where the maximum was
haplotype structure of incomplete sweep are associated with unusually small iHHA. Namely, stochastic fluctuation in
haplotype structure surrounding the ancestral allele appears to frequently generate false-positive signatures of selection captured byiHSornSL.
To examine whether the CLR,iHS, andnSLmethods
de-tect common candidate loci under selection, we adjusted the
P-value cutoff of iHS or nSL for each chromosome arm so
that the numbers of iHSornSL clusters match that of the
CLR in the same chromosome arm (Table S1andTable S2).
ancestral alleles on the top and derived alleles on the bottom (divided by a horizontal green line). Derived alleles and missing base calls at polymorphic sites are marked by black and green bars, respectively.
Table 2 List of putative loci under incomplete selective sweeps inD. melanogasterRwanda population detected by the CLR method
Chr. arm Cluster start to enda MaxT
1e Site of maxT1f a^
Sample DAFg
Rank by
option A (B)h iHSi nS
L Closest gene
2L 1,517,366–1,529,788b 1.71 1,527,302 8,000 13/19 11 (12) 20.662 20.42 halo 5,803,333–5,815,486b,c,d 2.04 5,805,001 8,000 9/22 5 (3) 21.87 21.44 CG11034 6,650,567–6,657,389b,d 1.92 6,652,011 8,000 17/22 7 (13) 20.577 20.46 Tango1 7,409,201–7,413,132 1.81 7,409,825 2,828 11/22 9 (6) 20.577 21.96 CG5181 14,094,223–14,102,937b 1.72 14,100,158 8,000 11/21 10 (9) 21.81 22.29 nAChRalpha5 16,001,993–16,020,004c 2.05 16,005,369 16,000 8/21 4 (5) 22.52 21.88 Beat-Ic 17,221,968–17,339,080c,d 6.66 17,271,945 64,000 8/21 1 (1) 22.23 21.58 CG6380 17,602,170–17,624,875c,d 2.28 17,616,351 11,313 11/21 3 (4) 21.42 21.69 Sytalpha 18,446,487–18,454,519 1.55 18,453,145 11,313 8/20 12 (11) 20.892 21.30 bsf 18,993,669–18,999,601 1.93 18,996,657 11,313 13/20 6 (10) 21.23 20.97 CG10650 19,480,924–19,546,720 1.91 19,493,563 22,627 8/21 8 (8) 21.32 20.94 swm 19,729,511–19,790,297c,d 3.13 19,756,197 22,627 9/21 2 (2) 22.14 21.08 CG10631 2R 3,058,650–3,079,356d 2.67 3,073,701 45,255 8/20 4 (5) 22.88 22.06 didum
5,269,193–5,278,463 2.12 5,271,741 11,313 11/20 6 (6) 22.38 22.14 CG13954 5,756,581–5,788,311 3.45 5,769,223 32,000 9/21 3 (3) 20.44 20.95 Sec24AB 7,126,724–7,131,721c,d 2.27 7,127,281 5,656 11/22 5 (4) 23.87 22.40 CG13215 7,882,689–8,178,854c,d 9.24 8,157,979 11,313 9/22 1 (1) 23.88 22.08 otk 12,727,369–12,759,779b,c,d 4.43 12,737,423 22,627 8/22 2 (2) 22.40 21.81 IntS8 20,061,659–20,075,219b 1.53 20,073,016 5,656 17/22 7 () 21.11 20.48 Nop60B 3L 3,173,086–3,190,811b 2.01 3,175,908 8,000 15/22 5 (5) 21.48 20.97 Girdin
4,478,135–4,479,071b,c 1.38 4,478,135 2,828 11/22 8 (8) 22.44 22.91 CG7465 6,100,579–6,157,140b,c,d 2.09 6,146,679 11,313 11/21 3 (3) 20.179 20.62 Lcp65Ag2 6,550,102–6,557,978b,c,d 1.81 6,551,837 8,000 9/21 6 (4) 23.92 23.52 CG18769 11,825,913–11,831,926b,d 1.35 11,829,615 2,000 17/22 9 (9) 22.11 22.38 CG43064 13,425,802–13,431,380b,d 1.70 13,430,186 5,656 11/22 7 (7) 22.72 23.18 CG10713 16,084,427–16,136,825c,d 2.86 16,106,542 16,000 17/22 2 (2) 21.79 22.45 Taf4 17,733,967–17,741,172 2.04 17,735,433 8,000 16/22 4 (6) 0.0795 20.49 CG7460 19,211,270–19,237,070c,d 2.89 19,220,338 22,627 8/22 1 (1) 21.85 22.74 fz2 3R 3,697,516–3,769,886 2.90 3,727,631 45,255 9/19 5 (7) 20.147 0.08 mRpS9
4,155,075–4,182,535 2.68 4,158,518 64,000 11/20 7 (9) 21.06 21.03 CG9601 5,530,419–5,688,202 3.91 5,548,751 90,510 8/20 2 (5) 21.15 21.36 CG8478 8,486,190–8,497,516 3.32 8,497,516 32,000 11/19 3 (4) 1.63 0.53 CG14395 9,040,956–9,111,809c 7.03 9,057,704 64,000 8/19 1 (1) 22.87 21.53 Ace 10,380,467–10,391,240c,d 2.73 10,386,839 8,000 10/21 6 (3) 22.99 22.56 Pde6 12,060,488–12,066,143c,d 2.48 12,066,090 16,000 17/22 8 (10) 23.09 23.01 tara 16,575,106–16,577,277b,d 2.10 16,575,113 11,313 16/22 9 (14) 21.91 22.34 CG42322 17,406,332–17,432,203b 3.03 17,414,532 16,000 15/22 4 (2) 21.67 20.54 InR 18,232,347–18,251,667b 2.09 18,245,938 11,313 12/22 10 (6) 21.33 21.58 lqfR X 525,809–1,798,033c 2.75 1,350,182 32,000 17/22 1 (1) 21.06 20.97 MED18
2,817,759–2,835,897c,d 1.73 2,828,033 5,656 10/22 2 (2) 24.89 24.64 kirre 14,156,405–14,160,294b,d 1.21 14,157,513 2,828 16/21 4 (4) 23.86 24.50 CG1461 15,607,843–15,628,927b 1.43 15,620,351 5,656 14/21 3 (3) 21.40 21.90 CG8184
aPositions of thefirst (start) and last (end) sites of significant CLR (P,0.001) within the cluster. bOverlap with a candidate region of complete selective sweep.
cOverlap with a cluster detected by theiHStest. dOverlap with a cluster detected by thenS
Ltest.
eMaximum CLR (T
1) within the cluster.
fThe location of maximumT
1or the putative nucleotide site under selection within the cluster.
gThe derived allele frequency (DAF) in the data at the putative site under selection. hThe rank within the chromosome arm of the maximumT
1when option A (B) is used for calculating composite likelihoods.
iThe value ofiHSandnS
If a CLR cluster and an iHSornSL cluster are not.50 kb
away from each other, they are defined as overlapping can-didates of selection. Of 25 CLR clusters that do not overlap with candidates of complete sweeps, 13 overlap with iHS
clusters (Table 2). Ten of those 13 iHS clusters are also
nSLclusters, reflecting a very high level of overlap between
theiHSandnSLmethods. There is only one case of
coinci-dence between CLR and nSL peaks not being an iHSpeak
(excluding those overlapping with complete sweeps). There-fore, less than half of CLR peaks were detected also by the
nSLmethod. Visual inspection of haplotype structures
indi-cates that such candidate loci detected by all three methods tend to exhibit a much clearer pattern of incomplete sweeps than others (Figure S7). However, there are also loci detected by the CLR method only but with clear haplotype patterns (for example, near position 5,770,000 in 2R; Figure 5). We also identified a few peaks of negativenSLwith clear
haplotype patterns not overlapping with CLR or iHSpeaks (for example, near position 3,886,000 in 2R; Figure 5). However, such cases are exceptional: if an nSL peak is not
overlapping with the CLR or iHSpeaks, it is more likely to show unclear than clear haplotype patterns (Figure S8).
Discussion
We developed a composite-likelihood method for detecting incomplete selective sweeps and inferring the location and strength of positive selection from DNA sequence polymor-phism. As this method is built on analytic approximations to sampling probabilities under an explicit model of the evolu-tionary process, hypothesis testing and parameter estimation can be performed systematically, for example, allowing the estimation of the strength of selection. This approach also has the potential to be extended to incorporate more complex scenarios of incomplete sweeps if the sampling probabilities can be obtained as functions of additional parameters. On the other hand, statistical methods aiming to capture the ex-tended haplotype such as theiHSandnSLtests (Voightet al.
2006; Ferrer-Admetlla et al.2014) have an advantage of re-quiring fewer assumptions about the evolutionary process to be inferred (i.e., how directional selection occurs) and are also easier to implement the procedure and to interpret the result. We thus compared the performance of our CLR method and the extended haplotype method, using both simulated and actual sequence data.
Analysis of simulated data showed that our CLR approach achieves statistical power and accuracy in estimating the location of selection similar to those by thenSLmethod (Table
1), however, under the assumption that the true scaled recom-bination rate of the genomic region is known when generating the null distribution by neutral simulation. If a falsely lower estimate of the scaled recombination rate is used for a genomic region under test, which is likely true if an incomplete selective sweep left a polymorphism with long-range LD, it will greatly reduce the statistical power to detecting it as the cutoff value in the null distribution becomes larger. Such a large sensitivity of
the CLR to the recombination rate (the level of linkage disequi-librium) is a major problem that needs to be addressed in future improvement of our approach. However, if local recom-bination rate or map distance is well estimated in advance over a large genomic region (much larger than typical sizes of sweep-affected areas), scaled recombination at a particular lo-cus might be correctly inferred from observed polymorphism in the neighboring regions, given that LD over a large region is much less affected by localfluctuation, for example by selec-tion. Namely, generating the null distribution with neutral sim-ulation that yields the observed level of LD in data under test, as we suggested to correct the effect of unknown recombina-tion rate, might be an unnecessarily conservative test, if the observed LD is definitely unusual (i.e., higher) compared to that in neighboring regions.
A related problem due to the sensitivity of our statistic to the level of linkage disequilibrium is the increased chance of detecting false-positive incomplete sweeps in the presence of nonstandard demography (Figure S4). Because various demo-graphic processes can inflate the level of LD throughout the genome, which upwardly shifts the distribution of T1
in the absence of selection, obtaining the null distribution un-der the assumption of the standard neutral model can lead to erroneous detections of sweeps. Again, if the nature of (com-plex) demography affecting the data is not known, the false-positive detection might be controlled by the null distribution from simulated samples under the standard neutral model but adjusted to exhibit the level of LD observed in the data.
A more important result in the comparison between the CLR and iHS/nSL tests is that their performances are rather
complementary to each other, as their outcomes are not so strongly correlated, especially for weak selection (a= 1000; Figure 3). It is probably because the two methods are de-signed to detect slightly different footprints of incomplete se-lective sweeps. Our method primarily captures joint frequency spectra at linked neutral loci for the two subsamples divided according to theSlocus (Figure 2), whereas theiHSandnSL
methods target the extended haplotype homozygosity, al-though these two signatures are obviously closely related through the reduction of polymorphism surrounding the pu-tative beneficial allele.
As it was not as feasible to evaluate statistical significance of CLR tests by generating appropriate null distributions for a large number of genomic regions in D. melanogaster, we applied the CLR and iHS/nSL methods as outlier detection
approaches. We evaluated the relative performance of the three methods by obtaining similar numbers of outliers (can-didate loci) for each chromosome arm and visually inspecting haplotype structures surrounding the putative sites under se-lection. In general, the clearest haplotype patterns of incom-plete selective sweeps were obtained when the loci were detected by all three methods. Candidates detected only by our CLR method exhibited relatively clean patterns compared to those detected by theiHSornSLmethod (Figure 5,Figure
the CLR approach. Visual inspection also suggests that many false positives are detected byiHSbecause extended homozy-gosity surrounding the ancestral allele of the core SNP can be randomly reduced to very small values. Namely, whileiHHD
captures the hitchhiking effect of the beneficial allele, stochas-ticfluctuation ofiHHAgreatly increases the variance ofiHHA/ iHHD. In addition, if a small number, say n9, of sequences
containing the derived allele of focal SNP are highly homozy-gous (e.g., hidden identity by descent) by chance while the othern12n9sequences are heterozygous at the normal level,
it can lead to a very largeiHHD. Our approach is not affected
by such problems, as our CLR does not simply depend on differences in the levels of variation between the two subsam-ples of data but compares neutral vs. selective scenarios as potential explanations for the subdivided pattern of polymor-phism. The stochasticfluctuation of SNP density in the ances-tral block appears to be less of a problem fornSLthan foriHS,
given that much clearer haplotype structures are detected by
nSLthan byiHS, probably because it does not use genetic map
distance but the number of intervening SNPs for measuring the size of the extended haplotype.
As population genomic data are obtained predominantly by NGS platforms, missing or low-quality base calls in data may greatly affect the performance of evolutionary inferences from DNA sequence polymorphism. It is straightforward to calculate sampling probability under both neutral and selective hypoth-eses given the configuration of missing bases at each site in the data. Therefore, our CLR approach can be applied to data with an arbitrary frequency of missing bases without systematic problems. On the other hand, it is not clear how to handle missing bases in quantifying the extended homozygosity for theiHSornSLtest. We skipped the site containing a missing
base in calculating the extension of homozygosity for a pair of sequences because clear haplotype structure of an incomplete sweep could not be identified otherwise. It is not clear how this procedure would affect the performance of theiHStest.
In conclusion, we proposed a composite-likelihood method for detecting incomplete selective sweeps and demonstrated that it achieves improvements in parameter estimation and ability to capture clear haplotype patterns compatible with incomplete sweeps compared to long-range haplotype tests. Although it has a disadvantage in not being robust to uncertainty in scaled recombination rates and complex de-mography, our composite-likelihood ratio provides information that is not captured by an advanced haplotype-based method usingnSL. We thus recommend that both CLR andnSLbe used
together to maximize the chance of detecting true targets of selection. As incomplete selective sweeps provide excellent op-portunities to estimate the strength and location of selection, due to the presence of ancestral polymorphism in the data, compared to complete sweeps, these methods will contribute to broadening our understanding of adaptive evolution in na-ture. In the framework of the likelihood-ratio test, we may conceive extension of this approach to study further details of incomplete selective sweeps beyond simple confirmation of positive selection and basic parameter estimation. For
example, recent analysis predicted that many beneficial mu-tations are likely to stall at intermediate frequencies due to heterozygote advantage (Sellis et al.2011). If this process generates sampling probabilities distinct from that left by simple directional selection with incomplete dominance, we may detect it under the current framework of the composite-likelihood test.
Acknowledgments
This research was supported by the Global Top5 Grant of Ewha Womans University 2013 and the National Research Foundation of Korea grants 2012R1A1A2004932 (to Y.K.).
Literature Cited
Akey, J. M., 2009 Constructing genomic maps of positive selection
in humans: Where do we go from here? Genome Res. 19: 711–
722.
Barton, N. H., 1998 The effect of hitch-hiking on neutral geneal-ogies. Genet. Res. 72: 123–133.
Biswas, S., and J. M. Akey, 2006 Genomic insights into positive
selection. Trends Genet. 22: 437–446.
Chan, A. H., P. A. Jenkins, and Y. S. Song, 2012 Genome-wide
fine-scale recombination variation in Drosophila melanogaster. PLoS Genet. 8: e1003090.
Comeron, J. M., R. Ratnappan, and S. Bailin, 2012 The many
landscapes of recombination in Drosophila melanogaster. PLoS Genet. 8: e1002905.
Etheridge, A., P. Pfaffelhuber, and A. Wakolbinger, 2006 An
ap-proximate sampling formula under genetic hitchhiking. Ann. Appl. Probab. 16: 685–729.
Ewing, G., and J. Hermisson, 2010 MSMS: a coalescent
simula-tion program including recombinasimula-tion, demographic structure and selection at a single locus. Bioinformatics 26: 2064–2065. Fay, J. C., and C. I. Wu, 2000 Hitchhiking under positive
Darwin-ian selection. Genetics 155: 1405–1413.
Ferrer-Admetlla, A., M. Liang, T. Korneliussen, and R. Nielsen,
2014 On detecting incomplete soft or hard selective sweeps
using haplotype structure. Mol. Biol. Evol. 31: 1275–1291. Fu, Y.-X., and W.-H. Li, 1993 Statistical tests of neutrality of
mu-tations. Genetics 133: 693–709.
Gautier, M., and R. Vitalis, 2012 rehh: an R package to detect
footprints of selection in genome-wide SNP data from haplotype structure. Bioinformatics 28: 1176–1177.
Hill, W. G., and A. Robertson, 1968 Linkage disequilibrium in
finite populations. Theor. Appl. Genet. 38: 473–485.
Hudson, R. R., K. Bailey, D. Skarecky, J. Kwiatowski, and F. J. Ayala,
1994 Evidence for positive selection in the superoxide
dismu-tase (Sod) region of Drosophila melanogaster. Genetics 136:
1329–1340.
Innan, H., and Y. Kim, 2008 Detecting local adaptation using the
joint sampling of polymorphism data in the parental and de-rived populations. Genetics 179: 1713–1720.
Kaplan, N. L., R. R. Hudson, and C. H. Langley, 1989 The“ hitch-hiking effect”revisited. Genetics 123: 887–899.
Kim, Y., and R. Nielsen, 2004 Linkage disequilibrium as a
signa-ture of selective sweeps. Genetics 167: 1513–1524.
Kim, Y., and W. Stephan, 2002 Detecting a local signature of
genetic hitchhiking along a recombining chromosome. Genetics 160: 765–777.
Maynard Smith, J., and J. Haigh, 1974 The hitch-hiking effect of
Meiklejohn, C. D., Y. Kim, D. L. Hartl, and J. Parsch, 2004 Identification of a locus under complex positive selection inDrosophila simulans by haplotype mapping and composite-likelihood estimation. Genetics 168: 265–279.
Nielsen, R., 2005 Molecular signatures of natural selection. Annu. Rev. Genet. 39: 197–218.
Nielsen, R., S. Williamson, Y. Kim, M. J. Hubisz, A. G. Clarket al.,
2005 Genomic scans for selective sweeps using SNP data.
Ge-nome Res. 15: 1566.
Pool, J. E., R. B. Corbett-Detig, R. P. Sugino, K. A. Stevens, C. M.
Cardenoet al., 2012 Population genomics of sub-Saharan
Dro-sophila melanogaster: African diversity and non-African admix-ture. PLoS Genet. 8: e1003080.
Przeworski, M., 2002 The signature of positive selection at
ran-domly chosen loci. Genetics 160: 1179–1189.
Quesada, H., U. E. Ramírez, J. Rozas, and M. Aguadé, 2003
Large-scale adaptive hitchhiking upon high recombination in Drosoph-ila simulans. Genetics 165: 895–900.
Sabeti, P. C., D. E. Reich, J. M. Higgins, H. Z. Levine, D. J. Richter
et al., 2002 Detecting recent positive selection in the human
genome from haplotype structure. Nature 419: 832–837.
Sabeti, P. C., S. F. Schaffner, B. Fry, J. Lohmueller, P. Varillyet al.,
2006 Positive natural selection in the human lineage. Science
312: 1614–1620.
Saunders, M. A., J. M. Good, E. C. Lawrence, R. E. Ferrell, W.-H. Li
et al., 2006 Human adaptive evolution at myostatin (GDF8), a regulator of muscle growth. Am. J. Hum. Genet. 79: 1089–1097. Sellis, D., B. J. Callahan, D. A. Petrov, and P. W. Messer,
2011 Heterozygote advantage as a natural consequence of
ad-aptation in diploids. Proc. Natl. Acad. Sci. USA 108: 20666–20671.
Stephan, W., 2010 Detecting strong positive selection in the
ge-nome. Mol. Ecol. Res. 10: 863–872.
Stephan, W., T. H. E. Wiehe, and M. W. Lenz, 1992 The effect of
strongly selected substitutions on neutral polymorphism: analytic results based on diffusion theory. Theor. Popul. Biol. 41: 237–254.
Stephan, W., Y. S. Yun, and C. H. Langley, 2006 The hitchhiking
effect on linkage disequilibrium between linked neutral loci. Genetics 172: 2647–2663.
Tajima, F., 1989 Statistical method for testing the neutral
muta-tion hypothesis by DNA polymorphism. Genetics 123: 585–595.
Toomajian, C., R. S. Ajioka, L. B. Jorde, J. P. Kushner, and M. Kreitman,
2003 A method for detecting recent selection in the human
ge-nome from allele age estimates. Genetics 165: 287–297. Voight, B. F., S. Kudaravalli, X. Wen, and J. K. Pritchard, 2006 A
map of recent positive selection in the human genome. PLoS Biol. 4: e72.
Appendix
Derivation offS1and fS2
We consider a constant-sized population ofNdiploid individuals that reproduce in discrete generations according to the Wright–Fisher model, thus equivalent to a population of 2Nhaploid individuals. Assume that mutation to a beneficial allele occurred at positionxof a chromosome at timeT=t(generations counted backward in time) in the past. At the time of sampling (T = 0), this mutant allele reaches an intermediate frequency b in the population. A random sample of n
chromosomes is assumed to contain n1andn2=n2n1copies of the beneficial and the ancestral allele, respectively, that
define the corresponding partition of the sample into two subsamples as illustrated in Figure 1. Letk1andk2be the counts of
the derived allele in respective subsamples at a neutrally evolving site at positionx2dorx+d. The probability of observing
k1andk2jointly is given by
fðk1;k2;n1;n2;dÞ
Z 1
0 uSð
k1;n1;p;dÞuNðk2;n2;pÞf0ðpÞdp; (A1)
wheref0ðpÞis the probability density of the derived allele frequency at the time of beneficial mutation (T=t).uNðk2;n2;pÞ
is the probability of samplingk2derived alleles in a sample ofn2chromosomes in a neutrally evolving population in which
frequency of the allele drifted for tgenerations starting fromp. During the course of a selective sweep, the deterministic change of the linked neutral allele frequency among chromosomes carrying the ancestral allele at theSlocus (frequencypA
in the “ancestral background”) is predicted to be small (Stephan et al. 1992; Meiklejohn et al. 2004). A moderate de-terministic change inpAoccurs whileb,0.8, the range to which our method applies (Figure S9). We, however, ignore
this change. We also ignore the change of allele frequency by genetic drift in the ancestral background, assuming t,,2Nð12bÞ;and obtain
uNðk2;n2;pÞ ¼
n2
k2
pn2ð12pÞn22k2: (A2)
Namely, we assume that the subsample ofn2chromosomes effectively captures the ancestral polymorphism at the time of
beneficial mutation. Next,uSðk1;n1;d;pÞis the probability of observingk1copies of the derived allele at positiondin the
subsample of n1sequences that carry the beneficial allele. Strictly, this probability must be a function of the frequency of
the beneficial allele at the time of sampling. However, as the frequency of the neutral allele among chromosomes carrying the beneficial allele (i.e., in the“beneficial background”) is known to change drastically only at the early stage of hitchhiking when the frequency of the beneficial allele is low and then change little until thefixation of the beneficial allele (Stephan
et al. 1992), we approximate uSðk1;n1;d;pÞ by sampling probability for the case of the complete selective sweep. We
multiply uS and uN inside the integral of (A1), assuming that the frequency of linked neutral alleles in the beneficial background is distributed independently of possible stochastic change in allele frequency in the ancestral background and that chromosomes are sampled independently in the two genetic backgrounds. In reality, the “migration” of lineages by recombination during the selective sweep may cause correlated stochastic changes of allele frequencies in the two back-grounds. However, we ignore such complications, as the stochasticfluctuation ofpin the ancestral background by genetic drift is ignored in thefirst place (see above).
Nielsenet al.(2005) and Etheridgeet al.(2006) provided approximate solutions that allow the derivation of the above sampling probabilityuS as a function of neutral allele frequency,p, at the time of the beneficial mutation. Using a star-like genealogy approximation, Nielsenet al.(2006) obtained the probability of observingk1derived alleles at the neutral locus
from the sample ofn1chromosomes after a selective sweep,
uSðk1;n1;d;pÞ ¼Zn1;n1vk1;n1þ
X
n121
i¼0
Zi;n1
vk1þ12n1þi;iþ1
k1þ12n1þi
iþ1 þvk1;iþ1
iþ12k1
iþ1
; (A3)
where vk;n¼
n k
pkð12pÞn2k
is the probability thatk ofndistinct ancestral lineages atT =tcarry the derived mutant alleles andZk;n¼
n k
zekð12zeÞn2kis the probability thatkofnlineages atT= 0 escape the sweep by recombining away
from the beneficial allele, with the escaping probability per lineage given byze¼12ð4NsÞ2ðrnd=sÞ¼12ð2aÞ2ðR=2aÞ: