2074
Optimization of cutting parameters for surface
roughness of polyamide 66/33 glass fiber composite
gear using response surface methodology
Atul Sharma1, M.L. Aggarwal2, Lakhwinder Singh3,
Mechanical Engineering Department1,2,3,YMCA University of Science and Technology.1,2,3
Email: [email protected]1
Abstract-In the present investigation, polyamide 66% polymer 33% glass fiber composite spur gear fabricated in
three steps: blanks are produced by injection molding process, machined on lathe machine and teeth cut on gear shaper. An attempt has been made to investigate the effect of gear shaping process parameters like rotary feed, cutting speed and cutting fluid ratio on surface roughness during machining. Response surface methodology (RSM) is used to design the experiments and analysis. Optimum values of rotary feed ,cutting speed and cutting fluid ratio during shaping operation of glass fiber reinforced polymer (GFRP) composite gear is used to minimize the surface roughness and results validated experimentally. Analysis of variance (ANOVA) is carried out to analyze the effect of process parameters and their interaction on the surface roughness of the gear teeth. Response surface is generated to find out the minimum surface roughness and the corresponding cutting parameters. The paper is about the studying of the effect of various parameters on surface roughness of composite spur gear material.
Keywords-Gear shaper, glass fiber reinforced polymer composite, optimization, RSM.
1. INTRODUCTION
Polymer composite materials now a day are the emerging materials in mechanical power transmission application. Glass fiber reinforced polymer (GFRP) gears are preferred for light weight applications in many areas like automotive, space and aviation industries due to high mechanical properties, excellent wear, noiseless operation, corrosion resistant, neat and clean environment (no need of lubrication) during power transmission. At present, great interest is to investigate for effective means for machining of polymer composite materials to achieve low surface roughness. Surface roughness is one of the governing factors in controlling the life, noise, vibration of gears during power transmission. Machining parameter such as cutting velocity, feed rate, depth of cut could be optimized for surface roughness, flank wear, crater wear, machining force during turning of GFRP [1]. Surface roughness depends upon machining parameters including cutting speed, feed rate, tool material [2]. In the case of milling operations parameter optimization of GFRP results in minimum surface roughness as response [3]. Effect of different tool materials on surface roughness in drilling of GFRP has varying results, regression model using experimental data could be developed [4]. Investigation of spindle revolution per minute, feed rate of spindle and drill diameter revealed the effect on minimum surface roughness in addition to this many researchers worked on machinability of GFRP, use of
response surface methodology and lubricating filler materials [5-8].
In the present study the GFRP gears were manufactured in three steps: blanks were produced by injection molding process, machined on lathe machine and teeth cut on gear shaper. Cutting speed, rotary feed and cutting fluid ratio were the cutting parameters selected for the optimization of surface roughness of gear teeth through response surface methodology. Three confirmation tests were done to validate the optimal combination of process parameters as predicted by response surface methodology.
2075
2. EXPERIMENTAL DETAILS
2.1. Materials
In this study engineering polymer Zytel 70G33LN010 having 33% glass fiber manufactured by DuPont in the form of granules has been chosen for making the gears. In this base matrix is polyamide 66 and the reinforcement is glass fibers. Properties of the material are given in Table1.
Table 1. Properties of GFRP (DuPont Zytel 70G33LNC010)
S.No. Particular Value Unit
1 Density 1390 Kg/m3
2 Stress at break 200 MPa
3 Tensile modulus 10500 MPa
4 Poisson’s ratio 0.39 -
2.2. Methods
First of all gear specifications are finalized based on the facilities available and to fix the sizes of tools, machines and techniques. Based on gear specifications the gear blanks are prepared on injection molding machines. These rough blanks are machined on turning machines to make the final size. When final size is completed the finished gear blanks are sent to gear shaper machine to obtain the desired number of teeth within tolerances. To predict the surface roughness surface response methodology is adopted to obtain the model of second order. By doing the pilot experiments the cutting parameters are selected, followed by design of experiments. By finalizing the desired number of experiments the surface roughness data is obtained with the help of surface roughness tester.
2.2.1. Gear specification
Detailed specifications of gear are given in Table 2.
Table 2. Specification of GFRP Gear
Engineering polymer Zytel 70G33LN010 having 33% glass fibre manufactured by DuPont in the form of granules is dried at 353 K for 4 hours, this material is
put into injection moulding machine in the mould and solid blanks are obtained.
The solid blanks obtained from injection molding is mounted on three jaw chuck of kirloskar make lathe machine, firstly one side of the blank is operated with facing, drilling followed by boring and turning. After that side is reversed then operations of turning and facing were performed.
The finished gear blank is mounted on the vertical mandrel of HMT make gear shaper model S150 to cut the teeth .It is properly mounted on the gear shaper spindle. The cutter is having reciprocating motion along with rotation on its axis so that all the cutting edges are used.
2.2.2 Response surface methodology
The surface finish of the gear tooth surface is very important for life, noise and vibration of the gears while running in the engineering applications. During machining surface quality of the gears could be improved by selection of the proper cutting parameters while generating gear teeth in gear shaper. In order to find out the surface roughness of the gears in advance it is important to find out the theoretical models enable to predict the surface roughness. Response surface methodology (RSM) is a collection of statistical and mathematical technique which is used for the modeling and analysis of problems in which interested response (surface roughness) is influenced by the variables (cutting parameters) and the target is to obtain the minimum surface roughness by selecting the optimum parameters.
In mechanical applications there is a relationship between an output (surface roughness) and a set of variables (cutting parameters). If we denote output variable by x and cutting parameters by y1, y2, y3,y4 …….,yn .If there is a relationship between x and y .Then a model can be written in the form given in equation (1).
x = f (y
1,y
2,y
3,y
4…….,y
n) + z (1)
Where z represents noise or error observed in the response x. Then we denote the expected response as equation (2).
E(x) = f(y
1,y
2,y
3,y
4…….,y
n) = x’
(2)
Then the surface represented by equation (3) is known as the response surface.
x’ = f (y
1,y
2,y
3,y
4…….,y
n) (3)
S.N o.
Description Symbo
l
Formula value
1 Number of teeth z Given 48
2 Module m Given 2
3 Addendum ha ha=1m 2
4 Dedendum hf hf=1.25m 2.5
[image:2.595.66.295.606.707.2]2076 So the first step in response surface methodology is to
find a suitable approximation for the functional relationship between x and set of independent cutting parameters. In most cases second order model is used in response surface methodology.
2.2.3 Design factors with levels
The range of process parameters are selected based on pilot experiments. Table 3, shows three parameters and three levels.
For gear shaper rotation of the uncut surface of work piece is through rotation of blank in vertical axis and cutter reciprocates in vertical plane, so rotary feed corresponds to new material in millimeter which comes in contact with cutter per stroke referred as mm/stroke.
Table 3. Process parameters and their levels.
Parameters symbol Levels
L1 L2 L3
Rotary feed (mm/stroke)
F 0.15 0.17 0.19
Cutting speed (stroke/min)
S 180 210 240
Fluid ratio (percentage)
R 4 8 12
2.2.4. Design of experiments
The Box-Behnken design is used to study the quadratic effect of factors after identifying the significant factors using screening factorial experiments. Array of experiments is given in Table 4.
Table 4. Array of experiments.
2.2.5. Surface roughness test
The average surface roughness is measured by using the Mitutoyo make Surftest SJ-301 instrument. Data is given in Table 5.
Table 5. Data of surface roughness of gear teeth.
As the stylus of tester is the precision part, it is gently put on the teeth surface of the gear and allowed to move in the perpendicular direction of the machined surface to measure the accurate values. The experiments are executed as per the design matrix and the surface roughness readings are put in place as per the experiments.
3. RESULTS AND DISCUSSION
The data obtained from the surface roughness test for 17 experiments are used for optimization of the output response by selecting the cutting parameters by using RSM technique. The data is first uploaded in MINITAB 16 software and response surface analysis is performed.
3.1. Analysis of Variance (ANOVA)
Analysis of variance technique is useful for checking adequacy of the calculated empirical relationship. The perfectness of the fit of the model is checked by determination coefficient R2.As shown in Table 6, the coefficient of determination calculated is 97.61% for surface roughness. It states that 97.61% of the experimental data validate the compatibility for the predicted data in the model.
S.No. F S R Ra
1 0.15 180 8 1.425
2 0.19 180 8 1.059
3 0.15 240 8 2.076
4 0.19 240 8 1.913
5 0.15 210 4 2.373
6 0.15 180 8 1.42
7 0.15 210 12 2.2
8 0.19 210 12 1.34
9 0.17 180 4 1.514
10 0.17 180 12 1.56
11 0.17 180 12 1.522
12 0.17 240 12 1.265
13 0.17 210 8 1.213
14 0.17 210 8 1.362
15 0.17 210 8 1.278
16 0.17 210 8 1.118
17 0.17 210 8 1.203
Run No. Rotary
feed
Cutting speed
Cutting fluid ratio
1 0.15 180 8
2 0.19 180 8
3 0.15 240 8
4 0.19 240 8
5 0.15 210 4
6 0.15 180 8
7 0.15 210 12
8 0.19 210 12
9 0.17 180 4
10 0.17 180 12
11 0.17 180 12
12 0.17 240 12
13 0.17 210 8
14 0.17 210 8
15 0.17 210 8
16 0.17 210 8
2077 Higher R-square values are desired for data to fit into
[image:4.595.306.498.504.635.2]the model, its value falls in between 0 and 100%.The value of R-Sq adjusted is 95.76 % which shows the high significance of model and its value increases if new term will be added. F-ratio is the ratio between regression mean square and the mean square error, if the calculated value of F increases then the significance of the parameter also increases. As shown in the ANOVA table the three parameters as per the significance in ascending order is rotary feed, cutting fluid ratio, cutting speed having the F value of 12.4, 87 and 114 respectively.
Table 6. Analysis of variance for surface roughness
A value of process parameter whose p-value is below 0.05 has a significant effect on the performance characteristics, and p-value between 0.05 and 0.1 shows the low significant effect. The parameter has the lowest effect on the process whose p-value is more than 0.1.The final relationship was constructed using these coefficients; it includes constant terms, single terms, square terms and interaction terms. The parameters whose p-value is more than 0.05 is removed from the model and final empirical relationship obtained is given as equation (4).
Surface roughness = + 17.3682-284.208 rotary feed + 0.0424327 cutting speed + 0.826720 cutting fluid ratio + 917.931 rotary feed*rotary feed + 0.0371587 cutting fluid ratio*cutting fluid ratio – 4.21573 rotary feed*cutting fluid ratio – 0.00387183 cutting speed* cutting fluid ratio. (4)
Table 7. Residuals for surface roughness.
The predicted values of the cutting parameters are obtained by inserting these values in equation (4) and residuals are obtained by subtracting from the experimental data. As shown in the Table 7 the residual values are very small which accounts for validity of this empirical relationship.
2.4 2.2 2.0 1.8 1.6 1.4 1.2 1.0 2.6
2.4
2.2
2.0
1.8
1.6
1.4
1.2
1.0
Ra-Exp.
R
a
-P
re
d
.
Scatterplot of Ra-Pred. vs Ra-Exp.
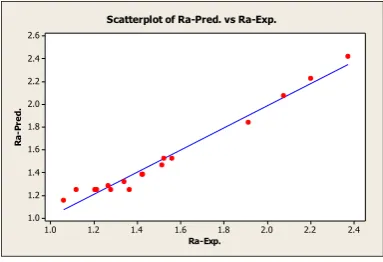
Fig. 1. Scatter plot
Scatter plot between the surface roughness obtained by putting the values of cutting parameters in equation 4 and surface roughness obtained experimentally along with the residuals is shown in Figure 1.The data is scattered roughly along the straight line. Hence it is proved that the regression equation is following the experimental results.
Sourc
e DF SS MS F p
Model 7 2.36 0.338 52.6 0.000
F 1 0.59 0.08 12.4 0.006
S 1 0.26 0.74 114 0.000
R 1 0.011 0.557 87 0.000
F2 1 0.388 0.515 80 0.000
R2 1 0.526 0.94 147 0.000
SR 1 0.517 0.517 80 0.000
FR 1 0.067 0.213 33 0.000
Resi. 9 0.057 0.001 Lack
of fit 3 0.02 0.007 1.41 0.328 Pure
error 6 0.03 0.005
Total 16 2.42
S=0.08, R-Sq. (adj) = 95.76%, R-Sq.= 97.61%
Press = 0.296
S.No. Ra-Pred. Ra-Exp. Residual
1 1.386 1.425 0.0391
2 1.152 1.059 -0.0934
3 2.073 2.076 0.0026
4 1.840 1.913 0.0731
5 2.421 2.373 -0.0480
6 1.386 1.42 0.0341
7 2.227 2.2 -0.0275
8 1.319 1.34 0.0205
9 1.466 1.514 0.0481
10 1.527 1.56 0.0328
11 1.527 1.522 -0.0052
12 1.285 1.265 -0.0204
13 1.246 1.213 -0.0328
14 1.246 1.362 0.1162
15 1.246 1.278 0.0322
16 1.246 1.118 -0.1278
2078
3.2
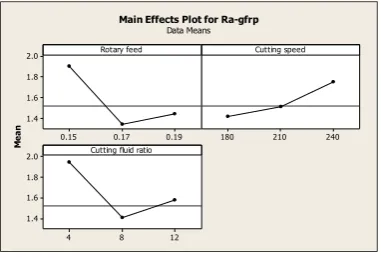
Main effects plotIn the main effects plot shown in Figure 2, the importance of the parameters is measured by the inclination of the line. The parameter which is having high slope in the plot has the major effect on the surface roughness.
3.2.1 Effect of cutting speed on surface roughness
From the plot of cutting speed and surface roughness as the cutting speed increases from 180 stroke/min to 240 stroke/min, surface roughness starts increasing, it is due to the fact that at high speed, glass fiber pullout from the matrix material takes place due to impact and bending, so surface roughness is high but when the cutting speed decreases the fiber shear off take place and surface roughness is low.
3.2.2 Effect of rotary feed on surface roughness
In the main effect plot of rotary feed it is found that as the rotary feed increase from 0.15 mm/stroke to 0.17 mm/stroke surface roughness decreases and when it increases from 0.17 mm/stroke to 0.19 mm/stroke the surface roughness increases this is due to fact that at rotary feed of 0.17 mm/stroke the cutting tool position itself for the combined effect of overlapping and jumping between the consecutive cutting strokes.
3.3.3 Effect of cutting fluid ratio on surface roughness
From the plot of cutting fluid ratio and surface roughness as the cutting fluid ratio increased from 4 to 8the surface roughness goes on decreasing, at low ratio water content is high and polymer has the moisture absorption tendency, glass fiber get pull out from the matrix and as the cutting fluid ratio is increased from 8 to 12 there is less water absorption and fiber get shear off at above the material surface so surface roughness slightly increased.
0.19 0.17 0.15 2.0
1.8
1.6
1.4
240 210 180
12 8 4 2.0
1.8
1.6
1.4
Rotary feed
M
e
a
n
Cutting speed
Cutting fluid ratio
Main Effects Plot for Ra-gfrp Data Means
Fig. 2. Main effects plot
3.3
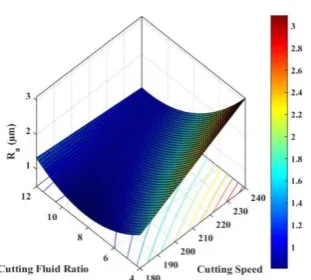
Surface plotAfter removing the insignificant parameters from the regression equation, it is left with two interactions. First is in between rotary feed and cutting fluid ratio, second is in between cutting speed and cutting fluid ratio.
3.3.1 Interaction between cutting fluid ratio and rotary feed.
It can be deduced from response surface shown in Figure 3, that with a rise in rotary feed from 0.15 to 0.19 mm/stroke at cutting fluid ratio of 4 % the surface roughness increases and it is minimum at 0.17 with cutting fluid ratio of 8 %.
Fig. 3. Surface plot between cutting fluid ratio and rotary feed.
3.3.2 Interaction between cutting fluid ratio and cutting speed.
[image:5.595.309.470.313.460.2] [image:5.595.72.263.609.738.2]2079 Fig. 4. Surface plot between cutting speed and cutting
fluid ratio for surface roughness
4. CONFIRMATION TEST
By taking the optimum cutting parameter into account from the surface plot, gear shaper machine set at cutting speed of 180 strokes/min, rotary feed of 0.17 mm/stroke, cutting fluid ratio of 8%; 3 experiments have been performed as shown in Table 8 and the average value of surface roughness obtained is 0.82 µm which is near to predicted value of 0.902 µm. By using response surface methodology, cutting parameters of gear shaper is successfully optimized for surface roughness of spur gear teeth. The detail of the experiments is given in Table 8, where D is the description, PL is parameter with level and Ra is surface roughness.
Table 8. Experimental values.
5.
CONCLUSIONSThe three step process of injection molding, turning, gear shaping shows good results in controlling the surface roughness of gear teeth over single step process of injection molding as follows:
1. Response surface methodology optimization technique using Box Behnken method reduced the surface roughness. The best predicted surface roughness found is 0.902 µm which is closed to experimental value of 0.82 µm.
2. Impact of the cutting parameters on the surface roughness is found out through value of F ratio from the ANOVA. It is found out that cutting speed is having the highest value of 114.9 affecting the surface roughness to the highest extent, cutting fluid ratio is having the value of 86.66 influencing the surface roughness on second number and rotary feed is having the value of 12.43 influencing the surface roughness on third number. All the three parameters are having the p-value equal to 0.000 which is less than 0.05 and hence they are significant.
3. The optimum machining parameters are found as cutting fluid ratio 8%, cutting speed 180 strokes/min, Rotary feed 0.17 mm/stroke. The significant parameters effect the performance characteristics are at 97.61 % confidence level
4. The second order model is developed to predict the surface roughness using response surface methodology based on cutting parameters. It is having R-square adjusted value of 95.76% which shows the correctness of the model if new terms will be added.
REFERENCES
[1] A.Naveen Sait, S.Arvindan, and A.Noorul Haq. “Optimization of machining parameters of glass fibre reinforced plastic (GFRP) pipes by desirability function analysis using Taguchi technique”. International Journal of Technol, pages 581-589, 2009.
[2] Ferit Fieiei, Zekeriya Aypareasi, and Huseyin Unal. “Influence of cutting tool and conditions on machinability aspects of polyphthalamide (PPA) matrix composite materials with 30% glass fiber reinforced”. International Journal of Advance Manufacturing Technol, pages 3067-3073, 2017. [3] Sachin Ghalme, Ankush Mankar, and Y.J.
Bhalerao. “Parameter optimization in milling of glass fibre reinforced plastic (GFRP) using DOE-Taguchi method”. Springer Plus, pages 1-9, 2016. [4] M.Mudhukrishnan, P.Hariharan, K.Palanikumar,
and B.Latha. “Tool materials influence on surface roughness and oversize in machining glass fiber reinforced polypropylene (GFR-PP) composites”. Materials and Manufacturing Processes, pages 988-997, 2016.
D Pred.
value Av. value
Exp. 1 Exp.
2
Exp. 3
P L
S1F2 R2
S1F2R 2
S1F2R 2
S1F2 R2
S1F2R 2
R a
2080 [5] K.Palanikumar, B.Latha, V.S. Senthilkumar, and
J.PauloDavim. “Analysis on drilling of glass fiber reinforced polymer (GFRP) composites using grey relational analysis”. Materials and Manufacturing processes, pages 297-305, 2012. [6] A.I. Azmi, R.J.T. Lin, and D.Bhattacharyya.
“Experimental study of machinability of GFRP composites by end milling”. Materials and Manufacturing Processes, pages 1045-1050, 2012. [7] Prasanta Kumar Bardhan, Suprs Patra, and Goutam Sutradhar. “Analysis of density of sintered iron powder component using the response surface method”. Materials Sciences and Applications, pages 152-157, 2010.