Abstract- The National Policy on Education, as revised in 1992, had emphasized the need for a substantial improvement in quality of education to achieve essential levels of learning. The Programme of Action, 1992, stressed the need to lay down Minimum Levels of Learning (MLL) at primary and upper primary stage. This need emerged from the basic concern that irrespective of caste, creed, location or sex, all children must be given access to education of comparable standards. The MLL strategy for improving the quality of elementary education was seen as an attempt to combine quality with equity. A strong focus on quality issues in elementary education underpins all efforts under SSA, which is increasingly becomes center point, as the programme advances. The quality issue in elementary education revolves around the quality of infrastructure and support services, opportunity time, teacher characteristics and teacher motivation, pre-service and in-service education of teachers, curriculum and teaching learning materials, classroom processes, pupil evaluation monitoring and supervision etc.
To improve the education of our children, only intensions and efforts are not enough. We need the combination of vision, commitment and develop professional research orientation for Nation building. This is truer in case of Uttar Pradesh where high degree of population, high degree of poverty, low literacy rate, high rate of student and teacher absenteeism, high degree of teacher student ratio and erratic behavior of parents. This paper is based on concurrent evaluation of Sarva Shiksha Abhiyan (SSA), which is running all over the country. However, the special focus of this paper is an evaluation of programme in three districts of U.P. namely Sitapur, Barabanki and Hardoi.
Key Words- Basic Education, Dropout Children, Elementary Education, Factors Influencing of Basic Education, Mid Day Meal, Quality of Education, Sarva Shiksha Abhiyan, School Infrastructure, Teacher Students Ratio.
Manuscript revised on May 9, 2019 and published on June 5, 2019 Dr. Tarannum Siddiqui, Assistant Professor, Career Convent Girls P.G. College, Affiliation from University of Lucknow, Uttar Pradesh, India. Email ID: [email protected]
Dr. R. C. Tyagi, Assistant Professor, Giri Institute of Development Studies, Lucknow, Uttar Pradesh, India. Email ID: ,[email protected]
I. INTRODUCTION
In aggregate terms, the India has make progress in alleviating poverty, promoting literacy, improving health and hygienic conditions. The whole process becomes slow in our country, due to lack of quality in education particularly in basic education which is the foundation of entire education. Improving the quality is not just a growth of literacy rate, mobilization of society through campaigns, services and charities. The quality of education is significant issue closely linked to the state of boys’ and girls’ education. According to Mahatma Gandhi (Harijan 1st December, 1933) ‘Real education
has to draw out the best from the boys and girls to be educated. This can never be done by packing ill-assorted and unwanted information into the hands of the students. It becomes a dead weight crushing all originality in them and turning them into mere automata’. To improve the education of our children, only intensions and efforts are not enough. We need the combination of vision, commitment and develop professional research orientation for nation building. This is truer in case of Uttar Pradesh where high degree of population, high degree of poverty, low literacy rate, high rate of student and teacher absenteeism, high teacher student ratio and erratic behavior of parents. This paper is based on concurrent evaluation of Sarva Shiksha Abhiyan (SSA), which is running all over the country. However, the special focus of the paper is an evaluation of programme in three districts of U.P. namely Sitapur, Barabanki and Hardoi. The first author was associated in this evaluation study and worked as project director.
The aim of Sarva Shiksha Abhiyan is to provide fruitful and relevant elementary education to all children in the 6-14 years of age groups by 2012. There is also another goal to bridge social, regional and gender gaps, with the active participation of the community in the management of schools. All programmes related to SSA are running in these districts, but major shortcomings of the programme rated between students’ attendance and achievement level. In addition, the programme needs better monitoring system.
II. OBJECTIVEOFTHESTUDY
1. To find out the factors effecting quality of education with the use of key indicators.
2. To examine and analyze these factors in goal achievement.
Positive and Negative Factors in Basic Education:
A study of Uttar Pradesh
214 3. To suggest few scales to improve the quality in Basic
Education. 4.
III. METHODOLOGY
A. Research Design:
The present study is descriptive, analytical and comparative in nature. It aims to explain the situation with regard to various aspects of universalisation of basic education. It analyzes both primary and secondary data, with a view to find out the actual constraints in the universalisation of basic education. Also it compares the situation and impact of universalisation of basic education in three districts namely Barabanki, Hardoi and Sitapur of Uttar Pradesh. All these districts are situated in central U.P. and are having a total number of 10,802 schools. Out of these 7099 are primary schools, 1961 upper primary schools, 357 Education Guarantee Scheme (EGS), 156 Alternative and Innovative Education (AIE), 26 Maktab Madarsa (MM), 45 Residential Bridge Course (RBC), 461 Non-residential Bridge Course (NRBC), 690 are National Programme for Girls Education at Elementary Level (NPEGEL) and 6 Kasturba Gandhi Balika Vidyalaya (KGBV).
B. Sample Selection:
After the selection ofthree districts, 5 per cent of schools from each category (schools and alternate schooling centers) were selected through proportionate sampling with the use of proportionate number table. Thus the total numbers of 547 schools / alternate schooling centers were selected for the study. The list of existing alternate schooling centers in the district was obtained from Basic Shiksha Adhikari of these districts and 5 per cent schools from eachdistrict were chosen randomly for study. The sample primary and upper primary schools were taken from each of the 4 blocks and 1 urban area of the district. The entire sample consists of 355 primary and 99 upper primary schools. Also 35 cluster model schools for NPEGEL, 17 EGS, 9 AIE, 3 Madrasa, 3 KGBV, 3 RBC and 23 NRBC Centers have been covered in the sample. The detail sample size has been shown in Table-1. The primary data were collected through pre-structured schedules. The data tabulation and analysis was done on the computer using SPSS package.
Table-1: Total Number of Schools
Sl.
No. District PS UPS
Alternate Education Girls Education
Total
EGS AIE MM RBC NRBC NPEGEL KGBV
1 Barabanki 2022 604 166 62 10 11 130 158 1 3164
2 Hardoi 2484 654 40 3 10 15 98 313 4 3621
3 Sitapur 2593 703 151 91 6 19 233 219 2 4017
Total 7099 1961 357 156 26 45 461 690 7 10802
Number of Sample
Schools 355 99 17 9 3 3 23 35 3 547
% of Sample Schools 5.00 5.05 4.76 5.77 11.54 6.67 5.00 5.07 42.86 5.06
Source: BSA office, Districts- Barabanki, Hardoi and Sitapur, U.P.
IV. TOOLSUSED
The following tools were prepared to collect the relevant data.
(1) District Information Schedule: this schedule was constructed to assess the actual situation of basic education in the districts.
(2) Interview Schedule for Primary and Upper Primary Schools: The schedule has totally 15 items and also sub-items. The schedule was constructed to collect information on community participation, achievement level of students and infrastructural facility, teachers’ students’ ratio etc.
(3) Interview schedule for Mid Day Meal Scheme (4) Interview schedule for Alternate Schooling. (5) Interview schedule for Residential Schooling. (6) Interview schedule for NPEGEL.
V. SECONDARYDATA
Secondary data have been taken from different reports, research papers, reference books, BSA office and school records etc.
VI. OBSERVATION
Observation method has also been used and the researcher have note down important aspects of basic education process as well as rural social process. The study has been conducted over 8 months.
VII. EFFECTSOFNEGATIVEFACTORSON
QUALITYOFBASICEDUCATION
(4) Students Absenteeism (5) Teachers Absenteeism (6) Teacher Student Ratio (7) Behavior of Parents.
(1)Population
The uncontrolled increase of population is a major constraint in the achievement of universlization of basic education. India is the most populous country in the world after China. Uttar Pradesh is the biggest state in India in population according to Census 2001. The population of India was 1,028,610,328 in which male 532,156,772 and females 496,453,556 and population of Uttar Pradesh was 166,197,921 (M-87,565,369, F-78,632,552). The uncontrolled and continues increase in population has made the issue of quality of basic education more complex in India and particularly in U.P. where more schools and more trained teachers are required to provide a good quality of education to every child.
(2) Poverty
The task of providing education for all is undoubtedly difficult especially in third world countries like India due to their limited resources, exploding population and poverty. Although India has made some progress after independence by running few programme related to education but still there is a long way to go bearing in
mind the size and growth of population. Uttar Pradesh is the biggest state in population and at current-price more than 40 per cent population is below poverty line (State Planning Institute). With many families living below the poverty line are sending their children to work instead of sending them to school, (UNICEF) /India /2010. Due to the reason children are either not going to school at all or are often irregular and are not getting required basic education resulting poor quality and poor foundation of education. To avoid such condition, Sarva Shiksha Abhiyan is having a provision to provide free uniform, free books and free mid day meal to every child.
(3) Literacy Rate
The developing countries of the world are characterized not only by low literacy rate but also a great disparity in the literacy rates between urban and rural population, between male and female and between young and aged. Equally striking are regional disparities in literacy within the states and within the districts (Algeria, 1996, p. 71). There are also variations in the literacy rates amongst the districts within the Uttar Pradesh. This variation is also witnessed in our sampled districts and can be observed in the following Table-2, which shows that the literacy rates of Hardoi district is higher than the Sitapur followed by Barabanki. Although literacy rate has been increased during a decade 1991 to 2001 in all these districts but could not attain literacy rate up to the state level.
Table-2: Literacy Rate of Uttar Pradesh and Sample Districts
Sl. No. State / Districts 1991 2001
People Male Female People Male Female
1 Uttar Pradesh 40.7 54.8 24.4 56.3 68.8 42.2 2 Barabanki District 31.1 43.7 16.0 47.4 58.8 34.3 3 Hardoi District 36.3 49.4 19.8 51.9 64.4 36.8 4 Sitapur District 31.4 43.1 19.9 48.3 60.0 34.6 Source: Census of India, 2001.
(4) Students Absenteeism (Details of absentee’s students)
One of the negative factors for poor quality of education is the absenteeism of students from school. For this perticuler issue, 27 primary and 10 upper primary schools of Barabanki district have been examined. Table-3 shows the number of absentees’ students from different social group categories for more than one third days of the school days of primary as well as upper primary schools. The information regarding the absentee’s students has been gathered from the school attendance register of the concerning school during the period 1st October, 2010 to 31st March 2011.
In class-1, majority of absentees’ boys’ and girls’ students were from OBC category comprising 54.55 and
44.44 percentage, followed by SC and Minority category students. Maximum number of absentees’ boys’ and girls’ students of class- 2 were from Minority, class-3 and class-4 maximum number of absentees’ boys’ and girls’ students were from SC followed by OBC. In class-5, majority of boys and girl students were from OBC category comprising of 52.00 and 59.09 per cent followed by SC category. Minimum, were from Minority category comprising boys and girls percentage of 8.00 and 13.64 of class-5. While taking in to consideration about upper primary schools, maximum number of absentee students were found OBC and SC category. So the issue of quality in basic education is more critical in socially backward classes.
216
Table: 3 Number of Absentee’s students for more than one third days of the School days during last six months (from school register)
Primary Schools
Sl. No. Classes SC ST OBC Minority Total
Boy Girls Boy Girls Boy Girls Boy Girls Boy Girls
1 Class 1 2 (18.18)
7
(38.89) - -
6 (54.55) 8 (44.44) 3 (27.27) 3 (16.67) 11 (100) 18 (100)
2 Class 2 9 (29.03)
15
(42.86) - -
14 (45.16) 9 (25.71) 8 (25.81) 11 (31.43) 31 (100) 35 (100)
3 Class 3 12 (41.38)
8
(44.44) - -
12 (41.38) 7 (38.89) 5 (17.24) 3 (16.67) 29 (100) 18 (100)
4 Class 4 16 (69.56)
5
(26.32) - -
5 (21.74) 10 (52.63) 2 (8.70) 4 (21.05) 23 (100) 19 (100)
5 Class 5 10 (40.00)
6 (27.27)
- - 13
(52.00) 13 (59.09) 2 (8.00) 3 (13.64) 25 (100) 22 (100)
Upper Primary Schools
Sl. No. Classes SC ST OBC Minority Total
Boy Girls Boy Girls Boy Girls Boy Girls Boy Girls
1 Class 6 11 (39.28)
15
(45.45) - -
13 (46.42) 13 (39.39) 4 (14.28) 5 (15.15) 28 (100) 33 (100) 2 Class 7 9
(25.00) 16
(36.36) - -
18 (50.00) 23 (52.27) 9 (25.00) 5 (11.36) 36 (100) 44 (100) 3 Class 8 15
(33.33) 17
(29.82) - -
20 (44.44) 28 (49.12) 10 (22.22) 12 (21.05) 45 (100) 57 (100) Source: Field Survey, SSA Programme, District Barabanki
(5) Teachers Absenteeism
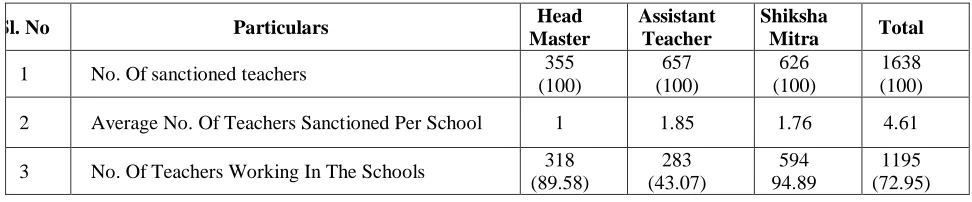
Another negative factors, which is responsible for poor quality of education is the absenteeism of teachers from the school due to multiple reasons. 355 primary and 99 upper primary schools have been selected for the survey to get the information and data regarding the sanctioned number of teacher and actual working teachers, absenteeism and habitual absentees of the teachers out of three districts namely Barabanki, Hardoi and Sitapur. The survey and its result have shown a gap between sanctioned number of teacher and actual working teachers in the sample primary schools in three districts of Uttar Pradesh. The average number of sanctioned teachers turns out to be more than 4 in each primary school. The average number of sanctioned headmaster assistant teachers and shiksha
Mitra was 1, 1.85 and 1.76 respectively in each category but the average number of teachers holding position turns out to be lower than this as shown in Table-4.
[image:4.595.61.547.666.767.2]Average numbers of teachers were found present on the day of our visit in sample primary schools was 0.80, 8.56 and 1.42 teachers in each category respectively. The highest (17.87 per cent) absenteeism of the teachers has been identified as on leave. Apart from this teachers were absent due to training programs (33.33 percent) sickness (12.08 percent) business in receiving salary (4.35 percent) school related extra work (10.63 percent) and due to other reasons (21.74 percent) on the day of our visit. On an average 1.92 percent of the working teachers were found to be the habitual absentees in sample primary schools.
Table 4: Teachers and Their Attendance in Primary Schools
Sl. No Particulars Head
Master
Assistant Teacher
Shiksha
Mitra Total
1 No. Of sanctioned teachers 355
(100) 657 (100) 626 (100) 1638 (100)
2 Average No. Of Teachers Sanctioned Per School 1 1.85 1.76 4.61
4 Average No. Of Teachers Working Per Schools 0.90 0.80 1.67 3.37
5 No. Of Teachers Found Present On The Day Of Visit 285 (89.62)
200 (70.67)
503 (84.68)
988 (82.68)
6 Average No. Of Teachers Found Present On The
Day Of Visit Per Schools 0.80 0.56 1.42 2.78
7
Reason Of Absenteeism
A. Training
5 (15.15)
9 (10.84)
55 (60.44)
69 (33.33)
B. Sickness 9
(27.27)
9 (10.84)
7 (7.69)
25 (12.08)
C. For Salary
-
4 (4.82)
5 (5.49)
9 (4.35)
D. School Related Extra Work 3 (9.09)
9 (10.84)
10 (10.99)
22 (10.63)
E. On Leave 10
(30.30)
18 (21.69)
9 (9.89)
37 (17.87)
F. Others (Working in Board Examinations) 6 (18.18)
34 (40.96)
5 (5.49)
45 (21.74)
Total 33
(100)
83 (100)
91 (100)
27 (100)
8 Habitual Absentee 4
(1.26)
10 (3.53)
5 (0.99)
19 (1.92) Source: Field survey
In Upper primary schools 86.68 percent out of total sanctioned teachers were reported to be in position. 75.20 percent teachers at primary level were found to be present on the day of our visit to these schools. The main reason of absenteeism of the teachers was reported to be the visits for schools related extra work in 11.96 percent cases. The teachers absence for taking, leaves were found in 11.96 percent, teachers were absent for attending
training programs in 16.30 percent cases and 16.30 percent teachers were absent due to sickness. Only 6 teachers were found to be the habitual absentee (Table-5).
Absentees and irregularity of teachers directly affect the quality of education. Measure should be taken by the district authority to control such types of absentees of the teachers’ particularly habitual absentees.
Table-5: Teachers and Their Attendance in Upper Primary Schools
Sl.
No. Particulars
Head Master
Assistant
Teacher Total
1 No. of sanctioned teachers 99
(23.13)
329 (76.87)
428 (100)
2 Average No. of teachers sanctioned per schools 1 3.323 4.323
3 No. of teachers working in schools 93 (93.94)
278 (84.50)
371 (86.68)
4 Average No. of teachers working per schools 0.939 2.808 3.747
5 No. of teachers found present on the day of visit 83 (89.25)
196 (70.50)
279 (75.20)
6 Average No. of teachers found present on the day of
visit per schools 0.838 1.979 2.818
7
Reason of Absenteeism:
a. Training
4 (40)
11 (13.41)
15 (16.30)
b. Sickness 1
(10)
5 (6.10)
218
c. For salary 0
(00)
1 (1.22)
1 (1.09)
d. School related extra work 1 (10)
10 (12.20)
11 (11.96)
e. On leave 3
(30)
8 (9.86)
11 (11.96)
f. Others (Election duty etc.) 1 (10)
47 (57.32)
48 (52.17)
Total 10
(100)
82 (100)
92 (100)
8 Habitual Absentees 1
(1.08)
5 (1.80)
6 (1.62)
Source: Field survey
(6) Teacher Student Ratio
According to norms for interventions under SSA teacher student ratio is 1:40 (Ref:F.2-3/2005-EE.3 dated-22nd Feb.2008). Recently teacher student ratio has been revised and has been fixed 1:30 (Right to Education Bill 2009). One teacher for every 30 children in primary and upper primary school is required. At least two teachers in a primary school and one teacher for every class in the upper primary school must be sanctioned and posted. Three teachers sanctioned under SSA for every new primary school, one each need to be a teacher with mathematics and science specific educational background. However, the teacher recruitment will be as per state Government’s norms. Uttar Pradesh is one of the largest states with high density of uncontrolled-increasing population required a bulk of qualified teachers to improve the quality of education. Although, government has done a lot in this direction by appointing teachers and Para teachers to fill the gap in sanctioned positions of teachers and positions laying vacant in the primary and upper primary schools. The numbers of teachers in primary and upper primary schools of different districts of U P are still less than required according to revised norms, which has been fixed 1:30 (Right to Education Bill 2009). To improve the quality in basic education teachers should be appointed according to teacher student ratio norms which have been fixed in RTE Bill, 2009.
(7) Behavior of Parents
According to census 2001 the literacy rate among male is 68.8 per cent and among female is 42.2 per cent, which is lower than national level. More than 75 per cent of state population is living in rural part of it where education facilities are lesser as compare to urban part of the state. Because of high illiteracy and poverty among parents they are not responding in a healthier manner to send their children to schools. Instead of sending their children to schools parents, especially in rural parts of the districts like to send them to work to earn some money or to take care of siblings at home when they go for work.
This behavior of parents is very erratic and harmful for their children. The reason is that around 50 per cent parents themselves are illiterate and can’t assess the value of education and the future of their children.
VIII. EFFECTSOFPOSITIVEFACTORSON
QUALITYOFBASICEDUCATION
(1) Mid Day Meal (2) Free Text Books
(3) Free School Uniform for Girls (4) TLM
(5) Infrastructural Facilities (6) PTA & VECs.
(1) Mid Day Meal
Table-6:Mid-Day Meal on the Day of Team Visit
Sl. No. Particulars Numbers
1 No. of Schools in which food is given according to the Menu. 258 (79.63)
2 No. of Schools in which food is not given according to the Menu. 66 (20.37)
3 No. of Schools in which students are happy with quality of food 243 (75.00)
4 No. of Schools in which students are not happy with the quality of food 81 (25.00)
5 No. of Schools in which students are happy with the quantity of food 275 (84.88)
6 No. of Schools in which students are not happy with the quantity of food. 49 (15.12)
7 Reasons why students are not happy with Mid Day Meal:
Food is not cooked according to the Menu 24
(24.49)
Lack of Quality 53
(54.08)
Lack of Quantity 18
(18.37)
Others 3
(3.06)
8 No. of Schools in which students bring Utensils from home. 305 (94.14)
9 No. of male cooks in the Schools. 138
(30.67)
10 No. of female cooks in the Schools. 312
(69.33) Source: Field survey, SSA programme.
MDM was cooked in 324 Schools out of a 355 sample schools.
1.1. Supply of Micro-Nutrients:
The supplement of micro-nutrition to the students is available only in the 9.01 percent schools. In most of the cases (93.75 percent), micro- nutrients were provided by the ANM and remaining schools (6.25 percent), provided
by others. The schools, where micro-nutrition supplements are made available, were provided once in a month in 71.88 percent cases. In rest of 28.13 percent schools it was provided twice in a month Table-7.
Table-7: Food Supplements
SI. No. Particulars Numbers/Schools
1 No. of schools in which micro nutrition supplement provided to the student 32 (9.01)
2 No. of schools in which micro nutrition supplement is not provided to the student
323 (90.99)
3 Micro-nutrition supplement providers:
a. ANM 30
(93.75)
b. Others 2
(28.13)
4 Duration/Frequency of micro-nutrition supplement as provided:
220 (71.88)
b. Twice in a month 9
(28.13) Source: Field Survey
(2) Free Text Books
The free text- book distribution is found in all sample primary and upper primary schools. Cent- percent students of primary and upper primary schools have received their text- books. In fact these books were also distributed among drop out students who have left the school after
receiving the books. There were more than 13 percent schools, where book distribution was delayed. In rest of the schools it has been timely. The delay in book distribution has been on account of delayed delivery from district office and less availability of books in the school Table-8.
Table-8: Free Text Book Distribution
SI No. Particulars Primary
School
Upper Primary Schools
Total
1 Students provided free text books of all subjects:
Boys 37278
(49.79)
8586 (50.55)
45864 (49.93)
Girls 37599
(50.21)
8398 (49.45)
45997 (50.07)
Total 74877
(100)
16984 (100)
91861 (100)
2 No. of schools in which book distribution delayed 21 (5.92)
6 (6.06)
27 (5.95)
3 No. of Schools in which book distribution is done timely
334 (94.08)
93 (93.94)
427 (94.05)
4 Total No. of schools in which book distributed 355 (100)
99 (100)
454 (100)
5 Reasons for delay in text book distribution:
a. Delay delivery from district office 6 (28.57)
3 (50)
9 (33.33) b. Less availability of books 7
(33.33)
3 (50)
10 (37.04)
c. others 8
(38.10)
- 8
(29.63)
Total 21
(100)
6 (100)
27 (100) Source: Field Survey
(3) Free School Uniform for Girls
The free uniform for girl students up to class eighth has been introduced in SSA. Distribution of uniforms is found in all sample primary and upper primary schools. Cent- percent students of primary and upper primary schools have received their uniform. In fact these uniforms were also distributed among drop out students who have left the school after receiving the uniforms.
(4) Teaching Learning Material (TLM)
As per data collected from sample schools and presented in the Table-8, there are 950 teachers in sample primary schools and 252 teachers in sample upper primary schools, those received TLM amount in these districts. Training of teachers regarding use of TLM was imparted only in 80.62 percent schools. The display of TLM in class- room was found in 79.07 percent of the sample schools. The use of TLM by the students was found in 76.87 percent schools Table-9.
Table-9: Details of Teachers Training for use of TLM
SI. No. Training for use of TLM Primary Schools Upper Primary Schools Total
1 No. of Teachers/ Shiksha Mitra received TLM
amount 950 252 1202
2 Training of teachers regarding use of TLM 297 (83.66)
69 (69.70)
359 (79.07)
3 Display of TLM in classrooms 292 (82.25)
67 (67.68)
359 (79.07)
4 Use of TLM by student 286
(80.56)
63 (63.63)
349 (76.87)
No. of total school 355 (100)
99 (100)
454 (100) Source: Based on Field Survey
The use of TLM by teachers for teaching has not been observed in 13.87 percent of the total sample schools. In 35.68 percent schools, the teachers often used TLM. Only
in half of the sample schools (50.44 percent) teachers were always using TLM equipment’s to teach students in the schools Table-10.
Table-10: Use of TLM by Teachers
SI. No. Particulars Primary School Upper Primary School Total
1 Always 191
(53.80)
38 (38.38)
229 (50.44)
2 Often 127
(35.77)
35 (35.35)
162 (35.68)
3 Never 37
(10.42)
26 (26.26)
63 (13.87)
Total 355
(100)
99 (100)
454 (100) Source: Based on Field Survey
The use of TLM by teachers in 10.42 per cent of the total sample primary schools. In 35.77 percent primary schools, the teachers often used for teaching has not been observed TLM. More than 53.80 percent teachers were always using TLM equipment’s to teach students in sample primary schools (Graph A & C). It has been found that the use of TLM in upper primary schools was
further deteriorating as compare to primary schools. The use of TLM by teachers for teaching has not been found in 26.26 percent of the total sample upper primary schools. In 35.35 percent upper primary schools, the teachers often used TLM. Only 38.38 percent teachers were always using TLM equipment’s to teach students in upper primary schools (Graph B & C).
Graph-A
Graph-B
Graph-C
Use of TLM in Primary School
53.80% 35.77%
10.42%
Alw ays
Often
Never
Use of TLM in Upper Primary School
38.38%
35.35% 26.26%
Alw ays
Often
222 (5) Infrastructural Facilities
5.1. Establishment and Construction of Schools Out of total sample schools, more than 81 percent have been established before ten years. More than 85 percent primary schools and 66 percent upper primary schools were established ten years back or even before. On an
[image:10.595.88.510.91.263.2]average rest of 18 percent sample schools were established within 10 years. As against this more than 36 percent schools were constructed within ten years. In case of primary and upper primary schools, 33 percent and around 51 percent schools have been constructed during 10 years Table-11.
Table 11: Year of Establishment and Construction
Period of Establishment
and Construction
Primary School Upper Primary School All School
Established Constructed Established Constructed Established Constructed
Less than 2 year (2006-07 to 2004-05)
10 (2.82)
23 (6.5.)
16 (16.16)
25 (25.25)
26 (5.73)
48 (10.60)
2 to 5 years (2003-04 to 2001-02
19 (5.35)
33 (9.32)
6 (6.06)
10 (10.10)
25 (5.51)
43 (9.49)
5 to 10 year (2000-01 to 1996-97)
24 (6.76)
60 (16.95)
11 (11.11)
15 (15.15)
35 (7.71)
75 (16.56)
10 year + (Before 1995-06
302 (85.07)
238 (67.23)
66 (66.67)
49 (49.49)
368 (81.06)
287 (63.36) No. of Total
Schools
355 (100)
354* (100)
99 (100)
99 (100)
454 (100)
453* (100) Source: Field Survey
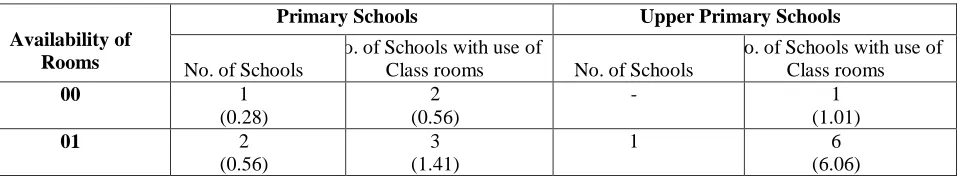
5.2. Availability and utilization of Classrooms
Availability of classrooms and their utilization is presented in Table 12, which shows that maximum 9 rooms available only in 3 primary schools out of 355
sample schools however the use of school rooms as classrooms are recorded to be 7 as maximum only in 1 sample primary school of the districts.
[image:10.595.66.548.668.756.2]
Table 12: Availability and Utilization of Classrooms
Availability of Rooms
Primary Schools Upper Primary Schools
No. of Schools
No. of Schools with use of
Class rooms No. of Schools
No. of Schools with use of Class rooms
00 1
(0.28)
2 (0.56)
- 1
(1.01)
01 2
(0.56)
3 (1.41)
1 6
(6.06)
Use of TLM in Primmary and Uppar Primary Schools
53.8
38.38
35.77 35.35
10.42
26.26
0 10 20 30 40 50 60
Prim ary School Upper Prim ary School
Pe
rc
eta
ge
Always
Often
02 17 (4.79)
128 (36.06)
- 62
(62.63)
03 107
(30.14)
105 (29.58)
4 (4.04)
16 (16.16)
04 106
(29.86)
71 (20.00)
31 (31.31)
7 (7.07)
05 65
(18.31)
41 (11.55)
24 (24.24)
5 (5.05)
06 39
(10.99)
2 (0.56)
13 (15.15)
-
07 10
(2.82)
1 (0.28)
13 (13.13)
-
08 5
(1.41)
- 5
(5.05)
-
09 3
(0.85)
- 2
(2.02)
-
10 - - 2
(2.02)
-
11 - - -
12 - - 1
(1.01)
-
13 - - -
14 - - -
15 - - 1
(1.01)
-
No. of Total Schools 355
(100)
355 (100)
99 (100)
99 (100)
Source: Field Survey
The availability of 3 rooms are found in maximum number (107) of sample primary schools constituting 30.14 percent, However at the same time, the use of 2 rooms for classrooms are recorded to be the maximum as (128) 36.06 percent in 355 samples of primary schools. The availability of 4 rooms in 106 schools, 5 rooms in 65 schools, 6 rooms in 39 schools, 7 rooms in 10 schools and 8 rooms in 5 schools.
In case of sample primary schools, maximum of 15 rooms are recorded to be available in 1 school out of existing 99 sample schools, however the use of rooms as classroom is recorded to be 5 as maximum only in 1 sample upper primary schools of the districts, The 4 rooms are found as maximum in 31 schools of sample however only 7 school use it as classroom. The number of rooms for classrooms teaching ranged from 0to 5. A maximum of 62 (62.63 %) sample school have 2 rooms for teaching. Rests of 1.01, 6.06, 16.16, 7.07 and 5.05 percent have 1, 6,16,7 and 5 rooms, respectively for classroom teaching.
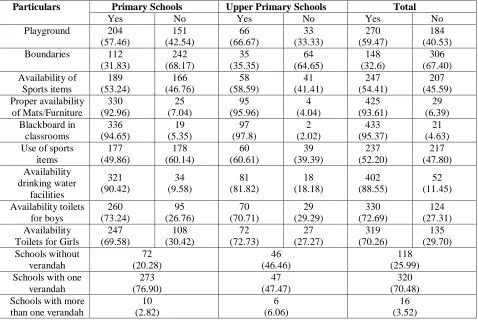
5.3. Availability of Infrastructure in schools
In case of sample primary schools, only 31.83 percent schools have boundaries, however the availability of playground is recorded in 57.46 percent schools. Sports
items are also found in 53.24 percent primary schools. The availability of mats, furniture and blackboard in classrooms is found to quite well, i.e. 92.96 percent and 94.65 percent respectively. Despite the availability of sports items, their use is found only in 49.86 percent schools. Availability of drinking water, toilets for boys and Toilets for girls are found in 90.42, 73.24 and 69.58 percent schools respectively. More than 76 percent primary schools have verandah and 2.82 percent have more than one. Also, 20.28 percent schools are without verandah in the school premises (Table13).
224 Maximum schools are without verandah, which is found
to be 46.46 percent of total sample upper primary
[image:12.595.68.546.175.495.2]schools.
Table 13: Availability of Infrastructure in schools
5.4. Parents Teachers Association (PTA) & Village Education Committee (VEC)
Efforts to improve the student's attendance were made by schools, VECs and parents teachers associations (PTA). In order to improve the attendance about 27.03 percent sample schools have interaction with the parents, notice were given to the parents with other measures. 30.18 per cent VESs have launched awareness campaign and organized meetings for the same the role of the PTA in improving the attendance found to be negligible Table-14.
Particulars Primary Schools Upper Primary Schools Total
Yes No Yes No Yes No
Playground 204 (57.46)
151 (42.54)
66 (66.67)
33 (33.33)
270 (59.47)
184 (40.53) Boundaries 112
(31.83)
242 (68.17)
35 (35.35)
64 (64.65)
148 (32.6)
306 (67.40) Availability of
Sports items
189 (53.24)
166 (46.76)
58 (58.59)
41 (41.41)
247 (54.41)
207 (45.59) Proper availability
of Mats/Furniture
330 (92.96)
25 (7.04)
95 (95.96)
4 (4.04)
425 (93.61)
29 (6.39) Blackboard in
classrooms
336 (94.65)
19 (5.35)
97 (97.8)
2 (2.02)
433 (95.37)
21 (4.63) Use of sports
items
177 (49.86)
178 (60.14)
60 (60.61)
39 (39.39)
237 (52.20)
217 (47.80) Availability
drinking water facilities
321 (90.42)
34 (9.58)
81 (81.82)
18 (18.18)
402 (88.55)
52 (11.45)
Availability toilets for boys
260 (73.24)
95 (26.76)
70 (70.71)
29 (29.29)
330 (72.69)
124 (27.31) Availability
Toilets for Girls
247 (69.58)
108 (30.42)
72 (72.73)
27 (27.27)
319 (70.26)
135 (29.70) Schools without
verandah
72 (20.28)
46 (46.46)
118 (25.99) Schools with one
verandah
273 (76.90)
47 (47.47)
320 (70.48) Schools with more
than one verandah
10 (2.82)
6 (6.06)
Table 14: Efforts for Improving Students’ Attendance
Sl. No.
Particulars Primary
Schools
Upper Primary Schools
Total
1 Efforts made by the schools:
Interactions with parents 84 (26.09)
26 (30.59)
110 (27.03) Through Information Notice 157
(48.76)
39 (45.88)
196 (48.16)
Other 81
(25.75)
20 (23.53)
101 (24.82)
Total 322
(100)
85 (100)
407 (100)
2 Efforts made by V.E.C.:
Awareness in Community 62
(29.24)
18 (33.96)
80 (30.18)
Meeting of VEC 134
(63.21)
31 (58.49)
165 (62.26)
Others 16
(7.55)
4 (7.55)
20 (7.55)
Total 212
(100)
53 (100)
265 (100)
3 Efforts made by P.T.A.:
Interaction with parents 116 (60.10)
29 (60.42)
145 (60.16) Regularly Meeting of P.T.A. 53
(27.46)
12 (25)
65 (27) Distribution of Facilities 18
(9.32)
6 (12.5)
24 (9.96)
Others 6
(3.11)
1 (2.08)
7 (2.90)
Total 193
(100)
48 (100)
241 (100) Source: Field Survey.
IX. CONCLUSIONANDSUGGESTIONS
SSA programme in three districts of Uttar Pradesh has been examined on the basis of positive and negative factors, on quality issue of education, in sample primary and upper primary schools. On the basis of above it has been found that SSA lays a special thrust on making education at the elementary level useful and relevant for children by improving the curriculum, child-centered activities and effective teaching learning strategies. SSA strives to secure the right to quality basic education for all children in the age of 6 to 14 years. Lots of efforts in SSA has been made for enrolment of all children in school, retention for them, bridging of gender and social category gaps and ensuring that there is a significant enhancement in the learning achievement levels. Although, this is a herculean task to achieve the required goal but a lot has been achieved up to a satisfactory level through this programme. Quality of education is the core issue of education, which requires more attention especially in case of Uttar Pradesh. On the basis of field survey, it has been found that few fundamental efforts have been taken to improve the quality of basic education in SSA. More and serious efforts are required to minimize the negative factors those are adversely effecting quality of education by the district education authorities, village education
committee, teachers and parents. Simultaneously it is also required to strengthen the positive factors by the strict monitoring and evaluation of the SSA progremme. Paper concludes and gives some suggestions to improve the quality in basic education:
All existing rooms in schools should be use for teaching and academic purposes.
Construction of school boundaries should be taken up on priority basis as per norms because parents should carry the feeling of security and safety of their children.
Playground should be available in all schools for the proper physical & mental development of students so that they may perform and improve themselves for their co-curricular activities.
Provision of mats and furniture for sitting of students in class- room should be in each school.
Books distribution was found delayed in the schools and should be timely in all the schools.
226
Proper coordination between State Project Office, District Project Office and School Authorities is required.
It has been found that there is a huge gap between number of sanctioned and in-position teachers in schools. Around 20 percent of the sanctioned teachers were not posted or appointed against sanctioned positions. All these vacant positions of the teachers should be filled without any further delay.
Teachers’ attendance was also not found up to the mark. Efforts should be made to appoint all sanctioned teachers and proper monitoring is required to ensure teachers attendance in primary and upper primary schools.
Efforts made by School Teachers, Village Education Committees and Parent Teacher Associations for improving the student’s attendance were not sufficient. More efforts are required in this direction.
The use of TLM by teachers for teaching has not been found in 35.77 percent primary schools and in 26.26 percent of the total sample upper primary schools. To maintain the quality of education, teachers should always use teaching learning materials during the teaching time in both primary and upper primary schools.
Role of parents teachers meeting were minimum in this respect. There should be more concerted efforts in each primary school is required to improve student’s attendance.
There should be more efficient and regular monitoring system to check student’s attendance.
The girls’ drop out in primary schools is higher than upper primary schools. The overall drop out rate is higher among boys at primary and upper primary levels. This is a matter of great concern and requires more efforts to retain students in schools by the teachers and parents.
Introduction of new programme by the education authority to control the drop out of students from education system at any level is required.
Syllabus should be universalized in such a way that to reduce the curriculum load and make learning more enjoyable for children.
Emphasis is required not only on the establishment of new schools but also their subsequent construction.
REFERENCES
[1] Mahatma Gandhi, Harijan 1st December, (1933). [2] R. C. Tyagi “Monitoring and Evaluation of Sarva
Shiksha Abhiyan, District Sitapur, Uttar Pradesh” A study Report, Conducted at GIDS, Lucknow, Submitted to the Ministry of Human Resource Development, New Delhi (2007).
[3] R. C. Tyagi “Monitoring and Evaluation of Sarva Shiksha Abhiyan, District Hardoi, Uttar Pradesh” A study Report, Conducted at GIDS, Lucknow, Submitted to the Ministry of Human Resource Development, New Delhi (2007).
[4] R. C. Tyagi “Monitoring and Evaluation of Sarva Shiksha Abhiyan, District Barabanki, Uttar Pradesh” A study Report, Conducted at GIDS, Lucknow, Submitted to the Ministry of Human Resource Development, New Delhi (2007).
[5] A Report of MHRD, Department of School Education & Literacy “A Programme for Universal Elementary Education: Framework for Implementation” Government of India, New Delhi, (2008).
[6] R. C. Tyagi “Monitoring and Evaluation of Sarva Shiksha Abhiyan, District Sitapur, Uttar Pradesh” Second Half Yearly Monitoring Report, Conducted at GIDS, Lucknow, Submitted to the Ministry of Human Resource Development, New Delhi (2011).