2730
A Reassessment of Reference-Based
Grammatical Error Correction Metrics
Shamil Chollampatt1 and Hwee Tou Ng1,2
1NUS Graduate School for Integrative Sciences and Engineering
2Department of Computer Science, School of Computing
National University of Singapore
[email protected],[email protected]
Abstract
Several metrics have been proposed for evaluating grammatical error correction (GEC) systems based on grammaticality, fluency, and adequacy of the output sentences. Previous studies of the correlation of these metrics with human quality judgments were inconclusive, due to the lack of appropriate significance tests, discrepancies in the methods, and choice of datasets used. In this paper, we re-evaluate reference-based GEC metrics by measuring the system-level correlations with humans on a large dataset of human judgments of GEC outputs, and by properly conducting statistical significance tests. Our results show no significant advantage of GLEU over MaxMatch (M2), contradicting previous studies that claim GLEU to be superior. For a finer-grained analysis, we additionally evaluate these metrics for their agreement with human judgments at the sentence level. Our sentence-level analysis indicates that comparing GLEU and M2, one metric may be more useful than the other depending on the scenario. We further qualitatively analyze these metrics and our findings show that apart from being less interpretable and non-deterministic, GLEU also produces counter-intuitive scores in commonly occurring test examples.
1 Introduction
Grammatical error correction (GEC) refers to the task of automatically detecting and correcting gram-matical, spelling, and word choice errors in written text. As newer approaches are being developed for this task, it becomes essential to have reliable means to compare them. In the related field of machine translation (MT), human judgments are used as ground truth to rank systems in the evaluation campaigns as part of the Workshop on Machine Translation (WMT) (Bojar et al., 2016a) held annually. In the absence of annual evaluations and periodic human-judged shared tasks for GEC, robust automatic eval-uation metrics are necessary to reliably assess improvements. Automatic evaleval-uation methods can also help in system development and validation.
Previous shared tasks on GEC relied on automatic evaluation metrics to evaluate the performance of participating systems (Dale and Kilgarriff, 2011; Dale et al., 2012; Ng et al., 2013; Ng et al., 2014; Rozovskaya et al., 2015). The CoNLL-2014 shared task test set and evaluation metric, M2 (Dahlmeier and Ng, 2012), have been used as the primary benchmark for evaluating English GEC. After the CoNLL-2014 shared task, two reference-based evaluation metrics, namely I-measure (Felice and Briscoe, 2015) and GLEU (Napoles et al., 2015; Napoles et al., 2016a), were proposed for GEC. More recently, some reference-less metrics were also proposed (Napoles et al., 2016b; Asano et al., 2017). A standard way to identify the best metric among them is to compare their correlation to human judgments. In the case of MT, WMT organizes a metrics shared task each year, where the correlation of system-level rankings generated by metrics and humans is measured. There is also a segment-level evaluation subtask where the agreement of metrics is measured at the sentence level. Prior work in GEC has followed the system-level evaluation approach to compare metrics (Grundkiewicz et al., 2015; Napoles et al., 2015; Sakaguchi et al., 2016). However, there has been no prior work on sentence-level evaluation. From prior studies,
it may appear that GLEU performs better than the de-facto M2metric. However, previous system-level correlation studies turn out to be inadequate, primarily due to the absence of significance tests and the choice of datasets and methods used. In this paper, we re-evaluate reference-based GEC metrics using appropriate significance tests to measure if previous conclusions can be trusted. We find that there is no evidence to suggest that GLEU is significantly better than M2. Contrary to system-level evaluation, I-measure is found to be a reasonably useful metric at the sentence level and has a positive correlation with human judgments at the sentence level. In our sentence-level evaluation, we find scenarios where M2outperforms GLEU and vice versa. Our qualitative assessment of these metrics on example sentences reveals the shortcomings of GLEU in comparison to the other metrics.
2 Evaluation Metrics
We study three popular reference-based evaluation measures that have been proposed for GEC, namely, MaxMatch (M2), I-measure, and GLEU.
2.1 MaxMatch (M2)
The M2 metric (Dahlmeier and Ng, 2012) computes precision, recall, and F-measure by maximally matching phrase-level edits made by a system to standard edits annotated by humans. A gold-standard edit used by M2 includes the location of the error within the tokenized input sentence and the proposed correction. Although annotations about the type of errors can be included in the gold standard, they are not used while scoring. For computing scores for specific error types, a variant of M2has been proposed (Bryant et al., 2017).
The standard M2computation is defined as follows. Consider a set of input sentencesS ={s1, ..., sn} and their corresponding system corrected hypothesesH ={h1, ..., hn}. The set of gold-standard edits for each input sentencesiis denoted bygiand the set of edits made by the system to transformsi tohi is denoted byei. Precision, recall, and F-measure are given by:
precision = No. of correct edits made by the system
Total no. of edits made by the system =
Pn
i=1|ei∩gi|
Pn
i=1|ei|
recall = No. of correct edits made by the system
Total no. of gold-standard edits =
Pn
i=1|ei∩gi|
Pn
i=1|gi|
Fβ = (1 +β2)·
precision·recall (β2·precision) + recall.
Aβ value of 0.5 is used in standard M2 (since CoNLL-2014 shared task), in order to weight precision twice as much as recall. This penalizes incorrect feedback more severely, which is especially important in the context of language learning, where we would like to minimize giving incorrect feedback to language learners. When several sets of annotations (by different annotators) are available for an input sentence
si, the set that maximizes the F-measure is chosen asgi.
The set of system editseifor theith sentence is obtained by first constructing a token-level edit lattice from the Levenshtein distance matrix. Additional edges are added to the lattice to represent phrase-level edits by combining adjacent edges, subject to a constraint on the maximum number of unchanged words (set to 2 in standard M2). Edges of the lattice are appropriately weighted such that a minimum distance path computation yields the set of editseithat maximally overlaps with the gold-standard edits.
2.2 I-measure
POSITIONS 1 2 3 4 5 6 7 8 9 10 11 12 13
INPUT: Thus , advice from hospital plays the important role for this .
HYPOTHESIS: Thus , advice from hospital plays an important role for this .
REFERENCE: Thus , advice from the hospital plays an important role in this .
Table 1: An example of three-way token-level alignments produced by I-measure.
positionj be denoted bywinpj , whypj , andwrefj , respectively. True positives (TP), true negatives (TN), false positives (FP), and false negatives (FN) are defined as follows:
TP :winpj 6=wrefj andwhypj =wrefj FP :wjinp6=wjhypandwhypj 6=wjref
TN :winpj =wrefj =whypj FN :winpj 6=wrefj andwhypj 6=wjref
An additional class FPN is defined to balance cases that can be classified as both FP and FN (FPN : winpj 6=wrefj 6=whypj ). A weighted accuracy is computed using TP, FP, TN, and FN counts:
WAcc = λ·TP + TN
λ·TP + TN +λ· FP− FPN 2
+ FN− FPN
2
The weight λ, which is set to 2, rewards correct changes and penalizes incorrect changes more than preserving erroneous input tokens. When multiple references are used, similar to M2, the gold-standard reference that maximizes theWAccis chosen. Then, the weighted accuracy of the input (WAccinp) is
computed by considering the input sentences as the hypothesis, with the same set of references chosen to computeWAcc. I-measure is given by,
I =
bWAccc, ifWAcc = WAccinp
WAcc−WAccinp
1−WAccinp
, ifWAcc>WAccinp
WAcc WAccinp
−1, otherwise.
I-measure denotes the relative improvement or degradation with respect to the input text. I-measure falls in the range1[−1,1], a negative value indicates degradation and a positive value indicates improve-ment. Unlike M2, I measure can mix and match annotations from different annotators to produce more alternative references2.
2.3 GLEU
Unlike M2 and I-measure, GLEU (Napoles et al., 2015; Napoles et al., 2016a) only requires human an-notators to correct by re-writing the source sentence without requiring annotations for individual errors. GLEU computes the precision of n-grams in the hypothesis that match part of the reference sentence, similar to the MT metric BLEU (Papineni et al., 2002). Additionally, GLEU penalizes n-grams in the hypotheses that match part of the input but not the reference. The original formulation (Napoles et al., 2015) included a weight parameter that had to be re-tuned according to the number of reference cor-rections used. Following the recommendation of Napoles et al. (2016a), we use the new formulation of GLEU3which does not include this weight parameter and can work for any number of references.
The computation of GLEU is done as follows. Consider a set of input sentencesS = {s1, ..., sn}, their corresponding corrected hypothesesH ={h1, ..., hn}, and reference sentences,R={r1, ..., rn}.
1
I-measure may also be represented as a percentage (%) with a range[−100,100]as used in the rest of the paper. 2
To use this ability of mixing annotations, alternative corrections for the same underlying error must be grouped together during annotation. However, since the data we use was not annotated in this manner, we disable the mixing ability of I-measure by using-nomixto prevent generating invalid references.
Here, we assume that there is a single reference sentence for each input sentence. First, a precision term
pkis computed for n-grams of sizek(k= 1,2, ..., N andN = 4for standard GLEU):
pk=
P
hi∈H
P
k-gram in
hiandri
counthi,ri(k-gram)−
P
k-gram in
hiandsi
max [0,counthi,si(k-gram)−counthi,ri(k-gram)]
P
hi∈H
P
k-gram inhi
counthi(k-gram)
counta(n-gram) = #occurrences of n-gram ina
counta,b(n-gram) = min(#occurrences of n-gram ina,#occurrences of n-gram inb)
Similar to BLEU, a brevity penalty (BP) is computed to penalize short hypotheses:
BP =
(
1, iflh> lr
exp(1−lr/lh), iflh≤lr
wherelr is the reference corpus length (sum of the number of tokens of the reference sentences) andlh is the total hypothesis corpus length (sum of the number of tokens of all hypotheses). GLEU is given by:
GLEU(S,H,R) = BP·exp 1 N
N
X
k=1
logpk
!
When multiple references are available, GLEU does not include reference n-grams from all references to compute n-gram precision like BLEU, nor picks the best like M2and I-measure. Instead, for each input sentence, a random reference correction is chosen from the set of reference corrections to compute the GLEU score. This makes GLEU non-deterministic, unlike M2and I-measure. The average GLEU score overmGLEU score computations is reported as the final score (m= 500in standard GLEU).
3 Quantitative Evaluation
The three GEC metrics are evaluated by measuring their correlation with human quality judgments treated as the ground truth. Following the experimental methodology in WMT metrics shared tasks (Mach´aˇcek and Bojar, 2014; Stanojevi´c et al., 2015; Bojar et al., 2016b; Bojar et al., 2017), we evaluate system-level correlation as well as sentence-level agreement of metrics with human judgments.
We utilize the collection of human judgments of GEC outputs released in (Grundkiewicz et al., 2015). The dataset is annotated similar to the relative-ranking method adopted in the WMT metrics shared tasks in (Mach´aˇcek and Bojar, 2014; Stanojevi´c et al., 2015). Human judgments are obtained for the system outputs of the 12 participating systems from the CoNLL-2014 shared task (Ng et al., 2014) and the input text as the thirteenth system (referred to as INPUT). Each human judgment consists of a 5-way ranking of hypotheses corrections from randomly chosen systems for an input sentence. Systems that produce the same hypothesis for an input sentence are grouped together. The 5-way rankings are then converted to pairwise rankings that include ties. A total of 109,098 pairwise rankings can be obtained if systems with the same hypothesis that were grouped together in the 5-way rankings are included (henceforth, referred to asexpanded set). Grundkiewicz et al. (2015) observed that there were a large number of ties due to the high overlap in system outputs. Trivial ties of systems that produce the same hypothesis can be removed by including only one randomly chosen system among grouped systems. This results in 20,516 pairwise rankings (henceforth, referred to asunexpanded set).
3.1 Measuring System-Level Correlation
two methods are employed in (Grundkiewicz et al., 2015)4, namelyExpected Wins(Bojar et al., 2013)
andTrueskill(Sakaguchi et al., 2014).
The Expected Wins model computes an intuitive score for a system based on the probability that a sys-tem wins (ranks higher according to human judgments) over a randomly chosen syssys-tem on a randomly chosen input sentence. This model ignores ties. The Trueskill model computes a score representing the average relative ability of the system compared to other systems, accounting for the uncertainty sur-rounding the system’s ability as well. In the context of GEC, on this dataset, Grundkiewicz et al. (2015) empirically found that Expected Wins performs better than Trueskill. However, almost all subsequent work ignored this finding and used the Trueskill model instead. We compute correlations using both methods in order to ensure comparability to prior work.
We measure both Pearson and Spearman correlation coefficients between metric rankings and human rankings. Pearson correlation (r) compares the system-level scores produced by a metric against human, under the assumption that the two measured variables have a linear relationship:
r=
q
P
i=1
(xi−x)(y¯ i−y)¯
pPq
i=1(xi−x)¯ 2
pPq
i=1(yi−y)¯2
wherex1, ..., xq are metric scores forqsystems for a particular metric withx¯as the mean metric score, and y1, ..., yq are human scores computed by Trueskill or Expected Wins with y¯as the mean human score. On the other hand, Spearman correlation (ρ) computes a correlation coefficient based on ranks instead of scores:
ρ= 1− 6
q
P
i=1
(di)2
q(q2−1)
where di represents the difference in the human rank and metric rank of the ith system. Spearman correlation is more relaxed compared to Pearson correlation in terms of the assumptions made about variables and also less sensitive to outliers in the sample.
In order to determine if a metric outperforms another, it is inadequate to measure differences in correla-tion alone. Following the recommendacorrela-tions in (Graham and Baldwin, 2014), we evaluate for significance of differences of correlation between metrics using William’s test (Williams, 1959). Note that prior work in human evaluation of GEC systems has not reported significance tests that account for the dependence between two metrics and hence the derived conclusions are not justified.
3.2 Measuring Sentence-Level Agreement
Since system-level evaluation is done on a few systems (13 in our case), we also compute a fine-grained sentence-level agreement of metrics to human pairwise rankings. For this, sentence-level metric scores are computed5. Agreement to humans is computed in a similar manner as segment-level evaluation in the WMT metrics shared task and variants of the Kendall’s Tau (τ) are used:
τ = |Concordant| − |Discordant|
Total # Pairwise Comparisons (1)
where|Concordant|refers to the number of times a metric agrees with the sentence-level human pairwise comparisons, and|Discordant|refers to the number of times they disagree. The variants ofτ are related to the way in which human ties are handled. In the variant used in the WMT metrics shared task from WMT14 (Mach´aˇcek and Bojar, 2014) onwards (henceforth referred to asNoTies), human ties are ignored completely and metric ties are added to the denominator alone, without contributing to Concordant or Discordant sets. For GEC, since there is a large number of ties, particularly in the expanded set, we include another variant that incorporates human ties as well (henceforth, referred to asHTies). In this
4
We use the scripts released by Grundkiewicz et al. (2015) to compute human ranking of systems.
Metric Expected Wins Trueskill
r ρ r ρ
GLEU 0.691 0.407 0.733 0.478
I-MEASURE –0.250 –0.385 –0.316 –0.423
M2 0.623 0.687 0.672 0.720
Table 2: Results of system-level Pearson (r) and Spearman (ρ) correlations of GEC metrics using the Expected Wins model and Trueskill model of human rankings.
0.3 0.4 0.5 0.6
Figure 1: Scatter plots showing the metric scores and human scores of CoNLL-2014 shared task systems.
variant, when a human judges a tie and metric predicts a tie as well for a given pair of hypotheses, it is treated as a concordant pair. However, when a human predicts a tie and a metric does not, or vice versa, it contributes only to the denominator and not to the Discordant set. We test for significance similar to (Bojar et al., 2017), by employing bootstrap resampling over 1,000 samples and those metrics with non-overlapping 95% confidence intervals are treated as having statistically significant improvements compared to the lower performing metrics.
3.3 Results
3.3.1 System-Level Evaluation
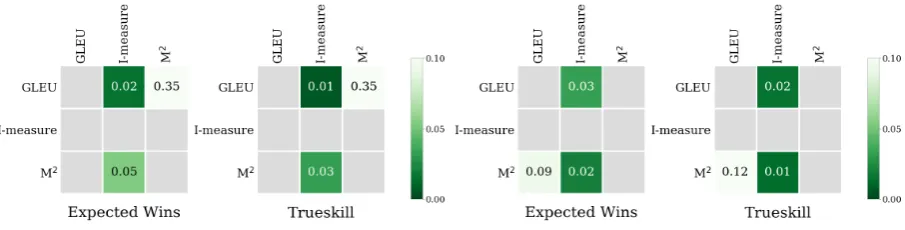
(a)p-values for Pearson correlation. (b)p-values for Spearman correlation
Figure 2: Results of William’s significance tests for correlations between metrics. A green non-empty cell denotes that the row metric has a higher correlation coefficient compared to the column metric with the specified p-value. A gray empty cell indicates that the row metric has equal or lower correlation coefficient compared to the column metric.
0.584 for GLEU vs 0.638 for M2using Trueskill). The relative performance under Spearman correlation, however, remains the same (0.245 for GLEU vs 0.643 for M2using Expected Wins and 0.336 for GLEU vs 0.692 for M2using Trueskill). The high Spearman correlation for M2indicates that it is a good metric for ranking systems, which is the primary goal of automatic evaluation metrics.
To understand if one metric significantly outperforms another, we perform William’s significance tests (Figure 2). As expected, we find that GLEU is not significantly better than M2 in terms of Pearson correlation (p-value of 0.35 for both Expected Wins and Trueskill). In the case of Spearman correlation for Expected Wins, M2 is significantly better than GLEU at the level of significance 0.10, but does not significantly outperform GLEU for the Trueskill model. The significance test results show that neither GLEU nor M2can be conclusively shown to be better than the other.
3.3.2 Sentence-Level Evaluation
Table 3 shows the results of sentence-level agreement of metrics to human pairwise rankings when human ties are considered (HTies) or ignored (NoTies). We also consider the unexpanded set where systems that produce the same hypothesis for an input sentence are grouped together. This removes the trivial ties (two identical hypotheses judged to be a tie) from the pairwise rankings. In the HTies variant, M2 achieves statistically significant improvements compared to the other two metrics in both expanded and unexpanded sets. However, for NoTies variant, GLEU achieves the best result. The results show that M2 may be better at judging ties and performs well overall when complete pairwise rankings are considered. On the other hand, GLEU does a better job at discriminating hypotheses, likely due to its ability to judge fluency like humans do (Sakaguchi et al., 2016). This difference in behavior of GLEU and M2 between the two variants, HTies and NoTies, is expected given a large number of ties for GEC (Grundkiewicz et al., 2015) as indicated by the difference in the number of pairwise comparisons (Table 3) and that M2 generally assigns more ties compared to GLEU. Surprisingly, I-measure achieves a positive correlation at the sentence level as opposed to a negative correlation at the system level, suggesting that it can be a useful metric at the sentence level.
4 Qualitative Assessment
We illustrate the strengths and weaknesses of the three metrics with the help of two examples (Table 4). We compare the metrics based on two criteria, interpretability and intuitiveness, which we believe are necessary for good GEC metrics.
Metric Expanded Unexpanded HTies NoTies HTies NoTies (109098) (49981) (20516) (14584)
GLEU 0.567 0.388∗ 0.237 0.321
I-MEASURE 0.564 0.368 0.242 0.293
M2 0.617∗ 0.300 0.348∗ 0.266
Table 3: Results of sentence-level agreement in terms of two variations of Kendall’s τ (HTies and NoTies) on expanded and unexpanded sets. The number of human pairwise comparisons used is given in parentheses. ∗ indicates that the 95% confidence interval of the metric does not overlap with those of the other metrics.
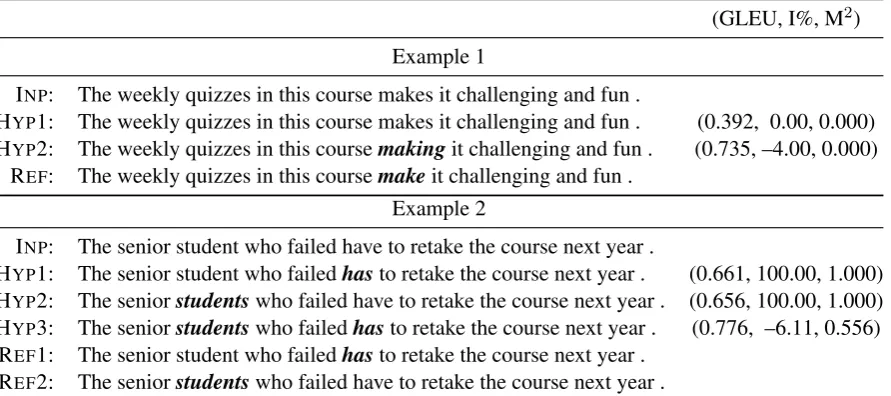
(GLEU, I%, M2)
Example 1
INP: The weekly quizzes in this course makes it challenging and fun .
HYP1: The weekly quizzes in this course makes it challenging and fun . (0.392, 0.00, 0.000) HYP2: The weekly quizzes in this coursemakingit challenging and fun . (0.735, –4.00, 0.000)
REF: The weekly quizzes in this coursemakeit challenging and fun .
Example 2
INP: The senior student who failed have to retake the course next year .
HYP1: The senior student who failedhasto retake the course next year . (0.661, 100.00, 1.000) HYP2: The seniorstudentswho failed have to retake the course next year . (0.656, 100.00, 1.000) HYP3: The seniorstudentswho failedhasto retake the course next year . (0.776, –6.11, 0.556)
REF1: The senior student who failedhasto retake the course next year . REF2: The seniorstudentswho failed have to retake the course next year .
Table 4: Illustrating examples and scores produced by the metrics.
baseline. In contrast, GLEU measures the precision of n-grams of the output text similar to BLEU. The scores that it produces have no clear relation to the system’s ability to correct or improve a text. For example, in Example 1, Hypothesis 1 (Table 4), when the system hypothesis is exactly the input sentence itself, there is no evidence about the system’s ability to correct errors. WhileIand M2give a zero score, GLEU gives a non-zero score (GLEU = 0.392). In the case of its counterpart BLEU, if some n-grams of the hypothesis and reference match, it rightly assigns a non-zero score as the system shows some ability to perform translation. However, for GEC, simply copying the input can result in matching several n-grams from the reference despite the system showing zero ability to perform correction. Moreover, the GLEU score will vary with the length of the input sentence without the system having to fix any error or even modify the input. Similarly, for Example 2, Hypothesis 1 and 2 (Table 4), despite being grammatical and matching one of the reference corrections exactly, GLEU gives a non-perfect score for both hypotheses, whereas I and M2correctly gives perfect scores. This is an artefact of GLEU randomly selecting one among the two references for scoring and averaging over multiple iterations. Also, due to its non-deterministic behavior, the scores for Hypothesis 1 and 2 differ despite having the same n-gram statistics compared to the references.
input sentence that were supposed to be changed according to the reference. It can be argued that GLEU intends to reward GEC systems for detecting errors by assigning a partial credit to systems that make spurious changes at locations where corrections are deemed necessary by human annotators. However, this will encourage building GEC systems that provide inaccurate feedback and potentially mislead the end users (primarily language learners). Hence, it is better to build and evaluate grammatical error detection systems separately (Rei and Yannakoudakis, 2016). I-measure, on the other hand, assigns a negative score for Hypothesis 2 as it is considered to ‘degrade’ the input, although it is arguable that both hypotheses 1 and 2 are equally ungrammatical. In Example 2, when multiple references are used, GLEU gives a higher score to Hypothesis 3 (ungrammatical) than Hypothesis 1 and 2, both of which are grammatical and each matches one of the two references exactly. On the other hand, both M2 and I-measure assign a lower score to Hypothesis 3 and conform to our intuition.
5 Related Work
5.1 GEC Evaluation
When GEC was restricted to specific error types, measures such as accuracy, precision, recall, and F-score were employed (Chodorow et al., 2012) as done in the earlier shared tasks (Dale and Kilgarriff, 2011; Dale et al., 2012). Dahlmeier and Ng (2012) identified weaknesses in evaluation methods used in these shared tasks in extracting phrase-level edits that correctly match the reference and proposed MaxMatch scoring (Dahlmeier and Ng, 2012), which can also work for sentence correction over all error types. M2does not distinguish between a do-nothing baseline and a system that changes the input incor-rectly, and hence I-measure (Felice and Briscoe, 2015) was proposed. Later, GLEU (Napoles et al., 2015) was proposed. It relied on whole sentence rewrites instead of span-based error annotations. However, our analysis shows that GLEU has several weaknesses in its formulation and has a non-deterministic behav-ior that makes it an unreliable alternative to prbehav-ior metrics. A few reference-less evaluation methods have been proposed of which (Napoles et al., 2016b) considers the grammaticality of the output sentences alone to evaluate GEC systems. Recently, Asano et al. (2017) proposed improvements to (Napoles et al., 2016b) by additionally accounting for fluency and meaning preservation. Sakaguchi et al. (2017) suggested future directions of improving GEC evaluation such as considering whole document rewrites.
5.2 Human Judgments and Metric Quality
Inspired from WMT, two collections of human judgments of GEC system outputs were released (Grund-kiewicz et al., 2015; Napoles et al., 2015). We use the former in our study as it has a much higher number of human pairwise comparisons (109,098) compared to the latter (28,146). Also, (Napoles et al., 2015) includes references as one of the compared systems in order to act as a control measure to ensure quality of human judgments. However, this is unfair to systems that compare more often against the reference as noted by Callison-Burch et al. (2012), since human raters may prefer the reference corrections more of-ten. This bias is further worsened by explicitly displaying the reference corrections to the human judges in (Napoles et al., 2015). Reference translations are neither included in rankings nor shown to judges in (Grundkiewicz et al., 2015). Also, all subsequent studies used the judgments released by Grundkiewicz et al. (2015) for comparing GEC metrics. Grundkiewicz et al. (2015), however, did not compare to GLEU as it was not available at the time. Later work which measured system-level correlation using GLEU failed for a number of reasons which motivate this paper. Apart from using different variations of GLEU, there was a mistake6in GLEU computation that produced different results and incorrect conclu-sions in earlier studies. Moreover, no proper significance tests to compare the differences in correlations between metrics were done. Significance tests that reject the null hypothesis of having no correlation to humans is not adequate for comparing differences in correlations between metrics (Graham and Baldwin, 2014). Also, (Napoles et al., 2016b; Asano et al., 2017) use 18 references for CoNLL-2014 sentences for generating metric rankings, of which 2 are the references used in the shared task, 8 are from (Bryant and Ng, 2015), and another 8 are annotated by both experts and non-experts as sentence-rewrites (Sakaguchi
6The brevity penalty was incorrectly implemented asexp(1−l
et al., 2016). Automatically constructing M2 and I-measure annotations from sentence rewrites will be sub-optimal. Also, we observed that the non-determinism of GLEU scores is more pronounced when more number of references are used, resulting in large differences in correlation values. In the end, we decided to use the standard two references for CoNLL-2014 as used in the original shared task and con-tinues to be the standard benchmark used to evaluate GEC systems to date. Also, prior studies had not conducted sentence-level agreement with human judgments, which we did in this paper. Sakaguchi et al. (2017) qualitatively compared metrics using contrived, gamed examples, which are rather irrelevant in practice (such as a system that outputs a dummy hypothesis “a”, “a a”, or “a a a” for any input sentence) and showed that M2under-penalized such systems. On the contrary, our qualitative assessment is based on naturally occurring examples and highlights the practical strengths and weaknesses of current GEC metrics.
6 Conclusion
Through carefully designed experiments and significance tests, we find no evidence of GLEU being a better metric than M2for ranking systems as claimed in prior work (Napoles et al., 2015; Sakaguchi et al., 2016; Napoles et al., 2016b). In fact, at the sentence level, when correctly predicting human ties are rewarded, M2 works better than GLEU. We believe that GEC metrics should be interpretable and must provide intuitive scores. In our qualitative assessment, we find that GLEU is less interpretable and produces absurd scores in common scenarios. Our analysis suggests that GLEU cannot be considered as a replacement of existing GEC metrics. The code to replicate the evaluations in this paper is available at https://github.com/nusnlp/gecmetrics.
Acknowledgements
We thank the three anonymous reviewers for their useful feedback.
References
Hiroki Asano, Tomoya Mizumoto, and Kentaro Inui. 2017. Reference-based metrics can be replaced with
reference-less metrics in evaluating grammatical error correction systems. In Proceedings of the Eighth
In-ternational Joint Conference on Natural Language Processing (Volume 2: Short Papers).
Ondˇrej Bojar, Christian Buck, Chris Callison-Burch, Christian Federmann, Barry Haddow, Philipp Koehn, Christof Monz, Matt Post, Radu Soricut, and Lucia Specia. 2013. Findings of the 2013 Workshop on Statistical Machine
Translation. InProceedings of the Eighth Workshop on Statistical Machine Translation.
Ondˇrej Bojar, Christian Federmann, Barry Haddow, Philipp Koehn, Matt Post, and Lucia Specia. 2016a. Ten years
of WMT evaluation campaigns: Lessons learnt. In Proceedings of LREC Workshop Translation Evaluation:
From Fragmented Tools and Data Sets to an Integrated Ecosystem.
Ondˇrej Bojar, Yvette Graham, Amir Kamran, and Miloˇs Stanojevi´c. 2016b. Results of the WMT16 metrics shared
task. InProceedings of the First Conference on Machine Translation.
Ondˇrej Bojar, Yvette Graham, and Amir Kamran. 2017. Results of the WMT17 metrics shared task. In
Proceed-ings of the Second Conference on Machine Translation.
Christopher Bryant and Hwee Tou Ng. 2015. How far are we from fully automatic high quality grammatical error
correction? InProceedings of the 53rd Annual Meeting of the Association for Computational Linguistics and
the 7th International Joint Conference on Natural Language Processing (Volume 1: Long Papers).
Christopher Bryant, Mariano Felice, and Ted Briscoe. 2017. Automatic annotation and evaluation of error types
for grammatical error correction. InProceedings of the 55th Annual Meeting of the Association for
Computa-tional Linguistics (Volume 1: Long Papers).
Chris Callison-Burch, Philipp Koehn, Christof Monz, Matt Post, Radu Soricut, and Lucia Specia. 2012. Findings
of the 2012 Workshop on Statistical Machine Translation. InProceedings of the Seventh Workshop on Statistical
Machine Translation.
Martin Chodorow, Markus Dickinson, Ross Israel, and Joel Tetreault. 2012. Problems in evaluating grammatical
Daniel Dahlmeier and Hwee Tou Ng. 2012. Better evaluation for grammatical error correction. InProceedings of the 2012 Conference of the North American Chapter of the Association for Computational Linguistics: Human Language Technologies.
Robert Dale and Adam Kilgarriff. 2011. Helping our own: The HOO 2011 pilot shared task. InProceedings of
the 13th European Workshop on Natural Language Generation.
Robert Dale, Ilya Anisimoff, and George Narroway. 2012. HOO 2012: A report on the preposition and determiner
error correction shared task. InProceedings of the Seventh Workshop on Building Educational Applications
Using NLP.
Mariano Felice and Ted Briscoe. 2015. Towards a standard evaluation method for grammatical error detection
and correction. InProceedings of the 2015 Conference of the North American Chapter of the Association for
Computational Linguistics: Human Language Technologies.
Yvette Graham and Timothy Baldwin. 2014. Testing for significance of increased correlation with human
judg-ment. InProceedings of the 2014 Conference on Empirical Methods in Natural Language Processing.
Roman Grundkiewicz, Marcin Junczys-Dowmunt, and Edward Gillian. 2015. Human evaluation of grammatical
error correction systems. InProceedings of the 2015 Conference on Empirical Methods in Natural Language
Processing.
Matouˇs Mach´aˇcek and Ondˇrej Bojar. 2014. Results of the WMT14 metrics shared task. InProceedings of the
Ninth Workshop on Statistical Machine Translation.
Courtney Napoles, Keisuke Sakaguchi, Matt Post, and Joel Tetreault. 2015. Ground truth for grammatical error
correction metrics. InProceedings of the 53rd Annual Meeting of the Association for Computational Linguistics
and the 7th International Joint Conference on Natural Language Processing (Volume 2: Short Papers).
Courtney Napoles, Keisuke Sakaguchi, Matt Post, and Joel Tetreault. 2016a. GLEU without tuning. arXiv
preprint arXiv:1605.02592.
Courtney Napoles, Keisuke Sakaguchi, and Joel Tetreault. 2016b. There’s no comparison: Reference-less
evalua-tion metrics in grammatical error correcevalua-tion. InProceedings of the 2016 Conference on Empirical Methods in
Natural Language Processing.
Hwee Tou Ng, Siew Mei Wu, Yuanbin Wu, Christian Hadiwinoto, and Joel Tetreault. 2013. The CoNLL-2013
shared task on grammatical error correction. InProceedings of the Seventeenth Conference on Computational
Natural Language Learning: Shared Task.
Hwee Tou Ng, Siew Mei Wu, Ted Briscoe, Christian Hadiwinoto, Raymond Hendy Susanto, and Christopher
Bryant. 2014. The CoNLL-2014 shared task on grammatical error correction. InProceedings of the Eighteenth
Conference on Computational Natural Language Learning: Shared Task.
Kishore Papineni, Salim Roukos, Todd Ward, and Wei-Jing Zhu. 2002. BLEU: a method for automatic
eval-uation of machine translation. InProceedings of 40th Annual Meeting of the Association for Computational
Linguistics.
Marek Rei and Helen Yannakoudakis. 2016. Compositional sequence labeling models for error detection in learner
writing. InProceedings of the 54th Annual Meeting of the Association for Computational Linguistics (Volume
1: Long Papers).
Alla Rozovskaya, Houda Bouamor, Nizar Habash, Wajdi Zaghouani, Ossama Obeid, and Behrang Mohit. 2015.
The second QALB shared task on automatic text correction for Arabic. InProceedings of the Second Workshop
on Arabic Natural Language Processing.
Keisuke Sakaguchi, Matt Post, and Benjamin Van Durme. 2014. Efficient elicitation of annotations for human
evaluation of machine translation. InProceedings of the Ninth Workshop on Statistical Machine Translation.
Keisuke Sakaguchi, Courtney Napoles, Matt Post, and Joel Tetreault. 2016. Reassessing the goals of
grammat-ical error correction: Fluency instead of grammatgrammat-icality. Transactions of the Association for Computational
Linguistics, 4:169–182.
Keisuke Sakaguchi, Courtney Napoles, and Joel Tetreault. 2017. GEC into the future: Where are we going and
how do we get there? InProceedings of the 12th Workshop on Innovative Use of NLP for Building Educational
Miloˇs Stanojevi´c, Amir Kamran, Philipp Koehn, and Ondˇrej Bojar. 2015. Results of the WMT15 metrics shared
task. InProceedings of the Tenth Workshop on Statistical Machine Translation.