Open Access
Proceedings
A comparison of founder-only and all-pedigree-members
genotype-expression association by regression analysis
Young Ju Suh
1, Hye-Soon Lee
2,3, Franak Batliwalla
2and Wentian Li*
2Address: 1BK21 Research Division of Medicine and Department of Preventive Medicine, School of Medicine, Ewha Womans University, Seoul
158-710, Korea, 2The Robert S. Boas Center for Genomics and Human Genetics, Feinstein Institute for Medical Research, North Shore LIJ Health
System, 350 Community Drive, Manhasset, New York 11030 USA and 3Division of Rheumatology, Department of Internal Medicine, Hanyang
University Medical College, Seoul 133-792, Korea
Email: Young Ju Suh - [email protected]; Hye-Soon Lee - [email protected]; Franak Batliwalla - [email protected]; Wentian Li* - [email protected]
* Corresponding author
Abstract
Genotype-expression association analysis using linear regression may produce different test results depending on whether founders only or all pedigreed members are used. This difference is not due to the correlation of samples within a pedigree, because linear mixed models have been applied to account for that correlation. We investigated the possibility that the difference is due to a dependence of expression levels on, among other things, the generation number in the pedigree. Indeed, of the 30 or so studied expression quantitative traits, several of them show significant dependence on the generation number. We propose to use all pedigree members in genotype-expression association analyses whenever the complete genotyping information is available.
Background
The genotype-expression association analyses were per-formed by Morley et al. [1] and Cheung et al. [2] in unre-lated CEPH founders only to avoid the issue of correunre-lated samples. On the other hand, the problem of correlated samples has been dealt with using the mixed model approach in many fields [3], including animal and plant genetics [4,5]. The mixed model with random effects accounts for the correlation by assuming a particular form of covariance structure [6]. The parameters in the mixed model are estimated by the maximum likelihood (or restricted maximum likelihood) approach with iterative algorithms. The correlation among pedigree members
apparently can be handled by the mixed model. In fact, a recent paper used the genotype-expression data in Morley et al. [1] as an example to illustrate their version of linear mixed model [7].
In linear regression models (y ~ ax+b), the x variable in dif-ferent samples is allowed to be correlated as long as the y variable is independent conditional on x. Using pedigree members might be a potential problem in genotype-expression association by regression analysis if genotype-expression levels in some pedigrees are systematically higher or lower than other pedigrees, thus the parameter b, for example, can vary from one pedigree to another in a random fash-from Genetic Analysis Workshop 15
St. Pete Beach, Florida, USA. 11–15 November 2006
Published: 18 December 2007
BMC Proceedings 2007, 1(Suppl 1):S8
<supplement> <title> <p>Genetic Analysis Workshop 15: Gene Expression Analysis and Approaches to Detecting Multiple Functional Loci</p> </title> <editor>Heather J Cordell, Mariza de Andrade, Marie-Claude Babron, Christopher W Bartlett, Joseph Beyene, Heike Bickeböller, Robert Culverhouse, Adrienne Cupples, E Warwick Daw, Josée Dupuis, Catherine T Falk, Saurabh Ghosh, Katrina A Goddard, Ellen L Goode, Elizabeth R Hauser, Lisa J Martin, Maria Martinez, Kari E North, Nancy L Saccone, Silke Schmidt, William Tapper, Duncan Thomas, David Tritchler, Veronica J Vieland, Ellen M Wijsman, Marsha A Wilcox, John S Witte, Qiong Yang, Andreas Ziegler, Laura Almasy and Jean W MacCluer</editor> <note>Proceedings</note> <url>http://www.biomedcentral.com/content/pdf/1753-6561-1-S1-info.pdf</url> </supplement>
This article is available from: http://www.biomedcentral.com/1753-6561/1/S1/S8
© 2007 Suh et al; licensee BioMed Central Ltd.
ion. Note that this is a different issue from the correlated samples for allele frequency estimation in case-control analysis [8-10]. In allele frequency estimation, correlation among pedigree members increases the variance of the estimation, while keeping the estimator unbiased [10].
Morley et al. found 27 genes that exhibit strong cis-acting genotype-expression (or SNP-eQT) association signal [2]. These signals are believed to be true positives not only because cis action makes much biological sense, but also because these genes are under linkage peaks. We used these genes in our study, but relaxed the cis-acting require-ment: the SNP that shows the strongest association signal will be checked for our comparative study between using founders only and using all pedigree members. This pro-cedure usually selects trans-acting SNPs, and thus the chance for false-positive SNP-eQT association is higher.
A comparison of using founders and using all pedigree members might detect something else: consistency between gene expression in founders and in non-found-ers. If pedigree founders are not a representative subset of samples of a pedigree, using founders only will lead to biased selection. Recent studies have shown that many eQTs may be age-dependent [11], which may provide a biological basis for a possible founder bias. If an eQT is more closely associated with age than with a SNP's geno-type, the genotype only partially explains the expression level. We will examine this issue here.
Methods
Selection of the SNP-eQT pairs
We selected 28 eQTs: 26 of the 27 gene expressions (there is no probe set in GAW data that matches ICAP-1A) listed in Table 1 of Cheung et al. [2], which show both cis link-age signal and strong association signals, and 2 eQTs that are of great interests for our investigation of rheumatoid arthritis, HLA-DRB1 [12] and PTPN22 [13]. After using a filtering procedure, we selected the SNP (out of 2263) that has the strongest association signal with the given eQT by the linear regression of eQT over three genotypes (coded as 0, 1, 2) using the 56 founder samples. Three eQTs (CSTB, DDX17, and HLA-DRB1) contribute two SNP-eQT pairs either because of the second SNP strongly associated with the eQT, or because of the multiple probe sets corre-sponding to the same eQT, leading to total 31 SNP-eQT pairs. Note that given an eQT, our procedure usually selects the SNP not located in the same region as the gene of that eQT (tran-acting); and SNP-eQT pairs used here are mostly different from those in Cheung et al. [2], even though the list of eQTs is the same. For the last subsection of Results section, we also examined all possible SNP-eQT pairs, for 2263 SNPs and 3554 eQTs.
Linear regression with mixed effects and linear regression of covariates
When all pedigree members are used (194 samples), we considered two models to account for possible pedigree-specific effects on eQT: a random effect on the intercept a (MM1 for mixed model 1):yij = a + εi + bxij + εij, where i is the pedigree index and j is the person index; and random effects on both a and the slope b (MM2 for mixed model 2): yij + a + εi + (b + δi)xij + εij. As for the age effect, we sim-plified the issue by examining the effect of generation number (1, 2, 3) on expression level, disregarding pedi-grees (labeled as "GC model" for generation as a covari-ate): yij = a + bxij + c2g2,ij + c3g3,ij + εij. Note that the generation covariate is coded as a factor with two dummy variables, g2 (1 for generation 2; 0 otherwise) and g3 (1 for
generation 3; 0 otherwise).
t-Test assuming dominant or recessive model
To check the robustness of linear regression in which an additive model is assumed, we also carried out two t-tests for the expression levels by either combining genotypes 0 and 1 as one group (and genotype 2 as the second group), or combining genotype 1 and 2 as a group (and genotype 0 as another group). The best p-value of the two tests was selected.
Averaged percentile of founders
To examine whether founders tend to have higher or lower expression levels with respect to the non-founders, we determined the percentile value for each founder in a pedigree, for a specific eQT. For that eQT, this percentile value was averaged over all pedigrees. If the averaged founder percentile was close to 50%, there was no founder selection bias; and if it was close to 100% or 0%, founders were considered as a biased subset.
Programs used
Both SAS and R statistical packages were used.
Results & discussion
Using founders only and using all pedigree members may lead to different association results
all samples are independent), despite a tripling of the sam-ple size.
Checking robustness of result by t-tests using dominant and recessive models
Because the linear regression used here implies an additive model, we also carry out two t-tests by grouping samples with the heterozygous genotype to those with one of the homozygous genotypes. For founders, the only SNP-eQT pair with p-value smaller than 4.4 × 10⁻⁶(0.01/2263) is
CSTB-rs157334 (p-value = 1.4 × 10⁻⁶). When all pedigree
members are used, CSTB-rs157334 is still the only pair that is significant at this level (p-value = 1.6 × 10⁻¹⁰).
Correcting for sample relatedness by random mixed models
When the MM1 mixed model is applied to the 194-sam-ple data, only two SNP-eQT pairs remain significant at the 4.4 × 10⁻⁶ level: CSTB-rs157334 and
HSD17B12-rs1334334. When MM2 mixed model is applied, only CSTB-rs157334 exhibits a p-value close to that level (5.3 ×
10-6). Interestingly, this is the only cis-acting pair among
those listed in Additional file 1. If an eQT has stronger dependence on a SNP genotype and a lower variation from pedigree to pedigree, we expect the significant SNP-eQT association to survive the application of a mixed model, at least with the random effect on the intercept. However, some SNP-eQT pairs lose the test significance in both MM1 and MM2. The MM2 model describes a situa-tion in which not only the eQT varies among pedigrees, but also its degree of dependence on SNP genotype changes with pedigrees. MM2 is a less realistic model than MM1.
Age/generation effect on eQT
To investigate why all-pedigree-member data set may exhibit a different regression result from the founders-only data set, we examined whether eQT changes from generation to generation. This is a simplified version of examining the age effect, as generation 1 (founders) are older than the second and the third generations. Under the GC regression model described in the Methods
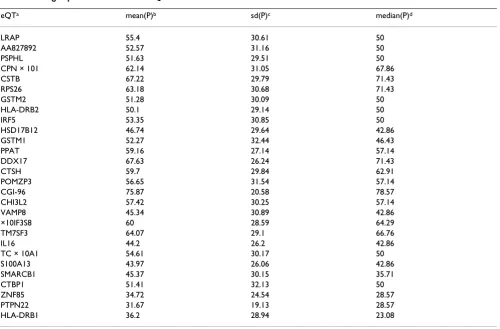
sec-Table 1: Averaged percentile value of 28 eQTs
eQTa mean(P)b sd(P)c median(P)d
LRAP 55.4 30.61 50
AA827892 52.57 31.16 50
PSPHL 51.63 29.51 50
CPN × 101 62.14 31.05 67.86
CSTB 67.22 29.79 71.43
RPS26 63.18 30.68 71.43
GSTM2 51.28 30.09 50
HLA-DRB2 50.1 29.14 50
IRF5 53.35 30.85 50
HSD17B12 46.74 29.64 42.86
GSTM1 52.27 32.44 46.43
PPAT 59.16 27.14 57.14
DDX17 67.63 26.24 71.43
CTSH 59.7 29.84 62.91
POMZP3 56.65 31.54 57.14
CGI-96 75.87 20.58 78.57
CHI3L2 57.42 30.25 57.14
VAMP8 45.34 30.89 42.86
×10IF3S8 60 28.59 64.29
TM7SF3 64.07 29.1 66.76
IL16 44.2 26.2 42.86
TC × 10A1 54.61 30.17 50
S100A13 43.97 26.06 42.86
SMARCB1 45.37 30.15 35.71
CTBP1 51.41 32.13 50
ZNF85 34.72 24.54 28.57
PTPN22 31.67 19.13 28.57
HLA-DRB1 36.2 28.94 23.08
aeQT, name of expression quantitative trait.
tion, three p-values are listed in Additional file 1: these are for testing zero coefficients for the genotype (b), genera-tion 2 (c2), and generation 3 (c3). Note that in this regres-sion, pedigree member information is discarded.
Five SNP-eQT pairs in Additional file 1 show significant genotype association at the 4.4 × 10⁻⁶ level after
account-ing for the generation effect: the two pairs mentioned above as well as RPS26-rs720428, CTSH-rs1021639, and GSTM1-rs1039337. On the other hand, significant associ-ation with the generassoci-ation variable has been observed for these eQTs: DDX17 (4.8 × 10⁻¹⁵) on generation 2; PTPN22
(2.8 × 10⁻²⁰), CGI-96 (8.4 × 10⁻¹⁵), HLA-DRB1 (1.7 × 10 -8), ZNF85 (3.5 × 10⁻⁸), IL16 (2.2 × 10⁻⁶), and CSTB (6.6 ×
10-6) on generation 3. Interestingly, even though CSTB
has a significant association with generation 3, it has an even stronger association with the genotype of rs157334.
A very simple check on whether founders tend to have dif-ferent expression levels from non-founders is to calculate their percentile value with respect to other samples in the pedigree. For example, for a 14-member pedigree, each member has a percentile value ranging from 1/14 to 1, in an increment of 1/14, and is determined by their expres-sion level of a particular eQT. For 28 eQTs (the probe sets that represent the "consensus sequence" of DDX17 and HLA-DRB1 are selected, whereas those that are "example sequences" are discarded), their average, standard devia-tion, and median percentile values are listed in Table 1. It is clear that for some eQTs, founders are indeed a biased subset of the pedigree. Most of the examples mentioned above for having a significant generation dependence is regression model also show up in Additional file 1 for having higher or lower averaged founder percentiles: DDX17 (68%), PTPN22 (32%), CGI-96 (76%), HLA-DRB1 (36%), ZNF85 (35%), and CSTB (67%).
To view more directly the relative location of founders' expression with respect to other pedigree members, Figure 1 shows the box-and-whisker plot of the 28 eQTs, with the founders marked by crosses.
Yet another simple check for the founder effect on expres-sion is the two-way ANOVA with pedigree as one factor and founder/non-founder as the second factor. Our result shows that 1) pedigree-dependence of the expression is significant for most eQTs (with the exception of four to five eQTs); 2) founder-dependence of expression is signif-icant for nine eQTs at the p-value = 0.001 level. These nine eQTs are CSTB, RPS26, DDX17, CGI96, TM7SF3, IL16, ZNF85, PTPN22, and HLA-DRB1, consistent with the result from the percentile value calculation; 3) for the founder-pedigree interaction term, four eQTs are signifi-cant at the p-value = 0.001 level.
One-stage versus two-stage analysis
Although it does not apply to the GAW data, in a practical setting, genome-wide genotyping information may only be available for the first stage of a study. In this situation, one may select SNPs that show promising association sig-nals, and only type these SNPs for the rest of the pedigree (second stage) in order to save cost. It is also suggested by Van Steen et al. that two-stage design also helps to ease the multiple testing problem [14]. If the whole genome geno-typing information is available for all pedigree members, one should use all samples in the analysis, while correct-ing the sample correlation by appropriate procedures (such as the mixed model procedure discussed here).
To test where a two-stage design would lead us, we imag-ine a hypothetical situation in which we do not have the genotyping information for non-founders. Then we would first exhaustively perform all possible genotype-expression linear regression analyses for the 56 founders. There are more than 8 millions possible SNP-eQT pairs, leading to an equal number of p-values. From these results, for each eQT, the minimum p-values of all 2263 SNPs can be recorded. There are 47 eQTs that have a min-imum p-value lower than 4.4 × 10⁻⁶. Now we assume in
the second-stage that these selective SNPs are typed for non-founders. For the corresponding eQT-SNP pair, another linear regression analysis on all 194 members can be carried out, as well as a linear regression analysis with the generation variable as covariates. If we do that, among these 47 eQT-SNP pairs, only two remain significant at the 4.4 × 10⁻⁶ level for the 194-sample data set:
CSTB-rs157334 and HSD17B12-rs1334334. Interestingly, these two pairs are the only overlap between the 47-pair set and the 31-pair set listed in Additional file 1. Furthermore, the two pairs are also the only ones showing significant asso-ciation with genotype after the generation effect has been removed.
Because the eQTs listed in Table 1 of Cheung et al. [2] (and Additional file 1 here) are selected based on a larger data set and, more importantly, extra information (e.g., linkage signal), they stand at a better chance to be true positives. The fact that the only two eQTs whose signifi-cant association with a SNP survive the test using all ped-igree members cautions us on the practice of not using all available data, but only relying on a subset of the data set.
Conclusion
Box-and-whisker plot of 28 eQTs for 14 pedigrees
Figure 1
Publish with BioMed Central and every scientist can read your work free of charge
"BioMed Central will be the most significant development for disseminating the results of biomedical researc h in our lifetime."
Sir Paul Nurse, Cancer Research UK
Your research papers will be:
available free of charge to the entire biomedical community
peer reviewed and published immediately upon acceptance
cited in PubMed and archived on PubMed Central
yours — you keep the copyright
Submit your manuscript here:
http://www.biomedcentral.com/info/publishing_adv.asp
BioMedcentral consistency among samples, and detecting possible age
dependence in expression levels.
List of Abbreviations
CEPH: Centre d'Etude du Polymorphisme Human
GAW: Genetic Analysis Workshop 15
GC: generation as a covariate (linear regression model)
eQT: expression quantitative trait
MM: mixed model (with 1 or 2 random effects)
SNP: single-nucleotide polymorphism
Competing interests
The author(s) declare that they have no competing inter-ests.
Additional material
Acknowledgements
We thank Yaning Yang and Peter Gregersen for discussions, Jianxin Shi and Harald Goring for discussing their results prior to publication, and Houman Khalili for reading the manuscript.
This article has been published as part of BMC Proceedings Volume 1 Sup-plement 1, 2007: Genetic Analysis Workshop 15: Gene Expression Analysis and Approaches to Detecting Multiple Functional Loci. The full contents of the supplement are available online at http://www.biomedcentral.com/ 1753-6561/1?issue=S1.
References
1. Morley M, Molony CM, Weber TM, Devlin JL, Ewens KG, Spielman RS, Cheung VG: Genetic analysis of genome-wide variation in human gene expression. Nat Genet 2004, 430:743-747. 2. Cheung VG, Spielman RS, Ewens KG, Weber TM, Morley M, Burdick
JT: Mapping determinants of human gene expression by regional and genome-wide association. Nature 2005,
437:1365-1369.
3. Pinheiro JC, Pinheiro J, Bates DM: Mixed-Effects Models in S and S-Plus New York: Springer-Verlag; 2002.
4. Kennedy BW, Quinton M, van Arendonk JA: Estimation of effects of single genes on quantitative traits. J Anim Sci 1992,
70:2000-2012.
5. Xu S, Yi N: Mixed model analysis of quantitative trait loci. Proc Natl Acad Sci USA 2000, 97:14542-14547.
6. Laird NM, Ware JH: Random-effects models for longitudinal data. Biometrics 1982, 38:963-974.
7. Yu J, Pressoir G, Briggs WH, Bi IV, Yamasaki M, Doebley JF, McMullen MD, Gaut BS, Nielsen DM, Holland JB, Kresovich S, Buckler ES: A unified mixed-model method for association mapping that
accounts for multiple levels of relatedness. Nat Genet 2006,
38:203-208.
8. Broman KW: Estimation of allele frequencies with data on sib-ships. Genet Epidemiol 2000, 20:307-315.
9. Slager SL, Schaid DJ: Evaluation of candidate genes in case-con-trol studies: a statistical method to account for related sub-jects. Am J Hum Genet 2001, 68:1457-1462.
10. Li W, Yang Y, Remmers E, Ogunwole C, Kastner D, Gregersen P:
Effective sample size: quick estimation of the effect of related samples in genetic case-control association analyses.
Nature Precedings 2007 [http://hdl.nature.com/10101/ npre.2007.400.1].
11. Rangrej J, Beyene J, Hu P, Paterson AD: Sex and age effects on genome-wide linkage analysis of gene expression in trans-formed lymphoblasts. BMC Proc 2007, 1(Suppl 1):S92. 12. Lee HS, Li W, Lee A, Rodine P, Graham RR, Ortman WA, Batliwalla
F, Lee KW, Bae SC, Behrens TW, Gregersen PK: Microsatellite typing for DRB1 alleles: application to the analysis of HLA associations with rheumatoid arthritis. Gene Immun 2006,
7:533-543.
13. Gregersen PK, Lee HS, Batliwalla F, Begovich AB: PTPN22 : setting thresholds for autoimmunity. Semin Immunol 2006, 18:214-223. 14. Van Steen K, McQueen MB, Herbert A, Raby B, Lyon H, Demeo DL, Murphy A, Su J, Datta S, Rosenow C, Christman M, Silverman EK, Laird NM, Weiss ST, Lange C: Genomic screening and replica-tion using the same data set in family-based associareplica-tion test-ing. Nat Genet 2005, 37:683-691.
Additional file 1
Comparison of p-values in regression analyses for 31 selected SNP-eQT pairs
Click here for file