Article
1
Effects of initial water content on microstructure and
2
mechanical properties of lean clay soil stabilized by
3
compound calcium-based stabilizer
4
Cheng-long Yin, Wei Zhang, Xun-li Jiang and Zhi-yi Huang*
5
College of Civil Engineering and Architecture, Zhejiang University, 866 Yuhangtang Road, Hangzhou
6
310058, China; [email protected] (C.L.Y.); [email protected] (W.Z.); [email protected]
7
(X.L.J)
8
* Correspondence: [email protected]; Tel.: +86-0571-88208702
9
10
Abstract: Initial water content significantly affects the efficiency of soil stabilization. In this study,
11
the effects of initial water content on the compressibility, strength, microstructure and composition
12
of a lean clay soil stabilized by compound calcium-based stabilizer were investigated by static
13
compaction test, unconfined compression test, optical microscope observations, environment
14
scanning electron microscopy, energy dispersive X-ray spectroscopy and X-ray diffraction
15
spectroscopy. The results indicate that as the initial water content increases in the range studied,
16
both the compaction energy and the maximum compaction force decrease linearly and there are less
17
soil aggregates or agglomerations, and smaller proportion of large pores in the compacted mixture
18
structure. In addition, for specimens cured with or without external water supply and under
19
different compaction degrees, the variation law of the unconfined compressive strength with initial
20
water content is different and the highest strength value is obtained at various initial water contents.
21
With the increase of initial water content, the percentage of oxygen element tends to increase in the
22
reaction products of the calcium-based stabilizer, whereas the crystalline mineral of the soil did not
23
change obviously.
24
Keywords: initial water content; lean clay soil; compound calcium-based stabilizer; compressibility;
25
strength; microstructure and composition
26
27
1. Introduction
28
From a historical perspective, clayey soil, derived from rock weathering process of geological
29
cycle[1, 2], already exists long before humankind come up. When people decide to use this kind of
30
material, they were amazed at its volume changing property with seasonal moisture variation[3-7].
31
In order to control or constrain the deflections and movement of clayey soils and enhance its
32
compressibility, strength, stiffness, the resistance to water and crack and other engineering
33
properties, a variety of inorganic, organic, and biological materials such as lime[8-11], Portland
34
cement[12-15], fly ash[16, 17], granulated blast furnace slag[18-20], cement kiln dust[21, 22], rice husk
35
ash[23, 24], polyacrylamide copolymers[25, 26], bioenergy coproduct[27, 28] and so on, in the form
36
of powder or liquid, was mixed with this problematic material with or without extra water before
37
compaction. This operation is usually referred as soil stabilization. Soil stabilization is traditional but
38
cost-effective technique in civil engineering, and finds its prevailing applications in pavement base,
39
subbase or embankment, canal or reservoir lining, shallow building foundations, stabilized rammed
40
earth constructions among others, especially for locations where relatively high-cost materials such
41
as gravel and crushed stone are unavailable or have a long transportation distance while the budget
42
of the construction project is probably limited[6, 29, 30].
43
Lime, Portland cement and fly ash are the most commonly used binding materials in soil
44
stabilization and they all comprise of calcium element, which can compose two main kinds of binding
45
gels in soil stabilization: calcium silicate hydrates (CSH) and calcium aluminate hydrates (CAH),
46
because of which they are called calcium-based stabilizer. These calcium-based stabilizers are usually
47
in the form of grinded powder. During soil stabilization practice, they are combined with soil and a
48
certain amount of water to form the soil-water-binder reaction system. It is the chemical and/or
49
physico-chemical reactions in the system that essentially transform the properties of the soils.
50
There are many factors affecting the efficiency of soil stabilization. Terashi [31] has categorized
51
them into four groups: a) characteristics of soils (soil structure, clay minerals, particle size
52
distribution, plasticity index, cation exchange capacity, pH, contents of sulphate and organic matter,
53
and so on), b) characteristics of binders (binder types, dosage methodology, corresponding reaction
54
processes such as dissolution, diffusion and precipitation, products of chemical or physico-chemical
55
reactions and so on), c) mixing and compaction procedures (pulverization, mixing uniformity, initial
56
water content (IWC), dry density and the like) d) curing procedures (temperature, air moisture,
57
curing time and the like).
58
Among all the influential factors of soil stabilization, initial water content is of first-level
59
importance. Firstly, the reaction process of soil-water- stabilizer reaction system can be simplified as
60
dissolution-precipitation[32-34], in which calcium-based binding materials and reactive minerals of
61
soil first dissolve into water and then precipitate on the surfaces of soil particles to fill the soil pores
62
(macropores and micropores[35]). Therefore, without water the reaction in the soil-water-stabilizer
63
system will not occur. Secondly, water is a strong polar molecule and has a very strong affinity to soil
64
minerals. Once water goes into the soil structure, a diffused double-layer (DDL) microstructure[36,
65
37] is formed around soil particles and influences the pore size distribution, matric suction,
66
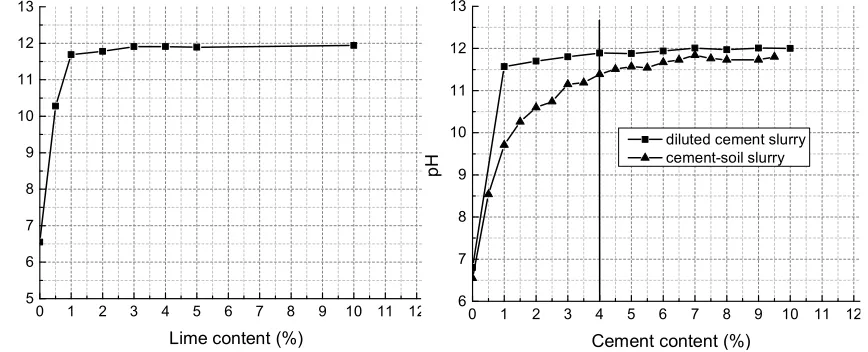
compressibility and shear strength of the soils.
67
Initial water content as the first-considered and quality-controlled factor in soil stabilization, has
68
been studied by other researchers. Most of the research focus on the effects of IWC on the strength
69
property of the soil treated by stabilizers, but different studies report different results and
70
conclusions. For example, Ramesh and Sivapullaia[38] compared the development of strength of a
71
black cotton soil stabilized by lime under different IWCs and found that the strength of
lime-72
stabilized black cotton soil increases rapidly when the specimens are compacted at a water content
73
slightly lower than the optimum moisture content. However, Guo et al. [39] analyzed the influence
74
of IWC on the strength of lime-modified expansive soil, and considered that the optimum IWC in the
75
construction of lime-modified expansive soil should be about 3 percentage points higher than the
76
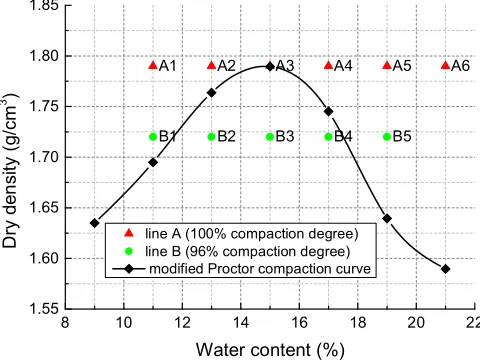
optimum water content. Consoli et al.[40] studied the effects of IWC on the strength of a lime-treated
77
sandy lean clay and draw the conclusion that at the same curing age, the strength was not affected
78
by the IWC. Besides, Consoli et al.[41] also investigated the effects of IWC on the strength of
cement-79
stabilized clayey sand and found that the unconfined compressive strength (UCS) first increased then
80
followed by decrease with the increase of IWC. He speculated that this was attributed to the different
81
structure formed during compaction where IWC played a fundamental role. Arora and Aydilek[42]
82
investigated the relation between UCS and IWC of a cement-treated sandy soil- fly ash mixture and
83
concluded that after the same curing period, the increase of IWC generally resulted in the decrease
84
of the UCS. And they ascribed this to the cementitious reactions, in which higher water/cement ratio
85
impaired the strength development. As a result, these contradictory results could not lead to a
86
defined recognition on the determination of optimum IWC in soil stabilization and there was not
87
enough information in the existing research to explain the reason why the IWC affect the strength
88
evolution of the stabilized soils.
89
Herein, the objective of this study is to investigate the effects of IWC on the machinal properties
90
(compressibility and strength), microstructure and composition of a lean clay soil stabilized by
91
compound calcium-based stabilizer comprised of cement, lime and fly ash, and explain how the
92
microstructure and composition variation of the soil-stabilizer mixture with different IWCs affect the
93
mechanical properties. To achieve this objective, a series of static compaction test, unconfined
94
compression test, optical microscope observations, Environment Scanning Electron Microscope
95
(ESEM) scanning, Environment Scanning Electron Microscope combined with Energy Dispersive
X-96
Hopefully, the results of this manuscript can help in the determination of optimum initial water
98
content of soil stabilization practice.
99
2. Materials and Methods
100
2.1. Material Properties
101
2.1.1. Soil
102
The soil used in the tests is a natural yellowish-brown muddy soft soil taken from the bottom of
103
a 1.5m deep borrow pit near Hangzhou, China, which does not contain large particles of sand or
104
gravel. After drying in the oven at the temperature of 105 ℃ for 3 days, the soil is pulverized to pass
105
No. 4 (4.75mm) sieve and deposited in a sealed plastic drum for the tests. The particle size distribution
106
of the dried soil is shown in Figure 1. Table 1 shows the physical properties of the soil. According to
107
the Unified Soil Classification System (ASTM D2487-2017[43]), the soil is classified as lean clay (CL)
108
type. The XRD pattern shown in Figure 2 indicates that the soil mainly contains clay minerals of
109
clinochlore, montmorillonite, and illite; and other minerals such as quartz and muscovite.
110
Figure 1. Soil particle size distribution. Figure 2. Mineral composition of the soil.
Table 1. Physical properties of soil sample.
111
Natural dry density (g/cm3)
Dried moisture content (%) Specific gravity Liquid limit (%) Plastic limit (%) Plasticity index (%) Activity of clay pH
1.64 2.94 2.69 37.8 19.3 18.5 2.02 6.55
2.1.2. Compound Calcium-based Stabilizer
112
The calcium-based stabilizer used in the study is composed of cement, lime and fly ash. The
113
cement is Type 325 Ordinary Portland cement, which is produced by local Qianchao Portland Cement
114
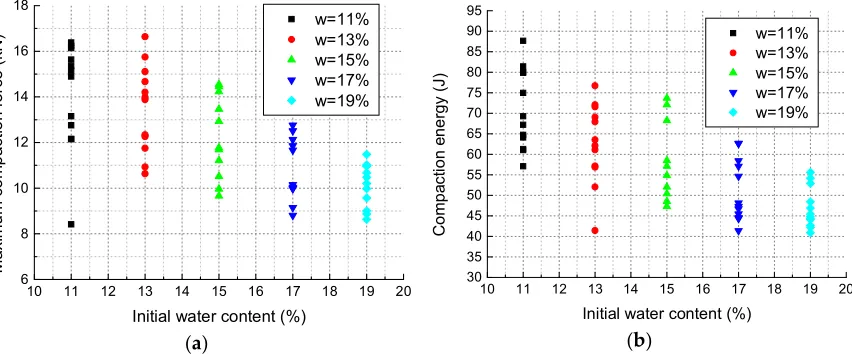
Company (Hangzhou, China). The lime used in the research is provided by Hangzhou Tuohai
115
Corporation (Hangzhou, China), which is a finely grounded lime powder with 85% total content of
116
CaO and MgO. The fly ash is high calcium Class C fly ash obtained from Shaoxing Shangyu
117
Hangzhou-union cogeneration Co., Ltd (Shaoxing, China). Table 2 presents the chemical composition
118
of the three additives. The particle size distribution of the mixed calcium-based stabilizer is shown in
119
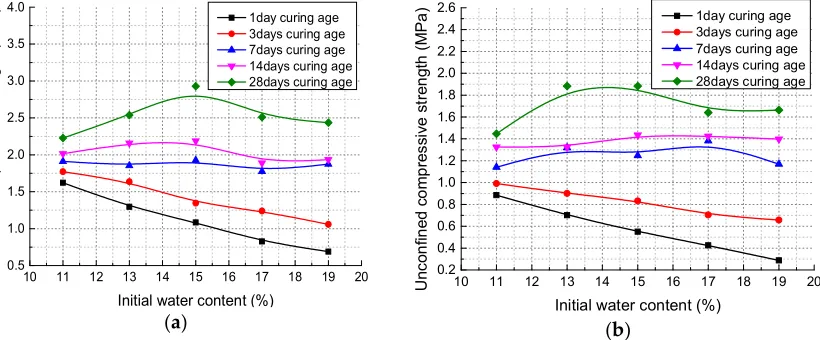
Figure 3.
120
Table 2. Chemical composition of the calcium-based stabilizers.
121
Materials Chemical Compositions (Mass Fraction, %)
0.0010 0.01 0.1 1
10 20 30 40 50 60 70 80 90 100
Particle size (mm)
P e rc e n ta g e f in e r b y w e ig h t (% )
SiO2 Al2O3 Fe2O3 CaO Na2O K2O MgO TiO2 SO3
PC
18.04 8.79 4.96 54.14 0.12 0.32 3.56 - 1.77
L - - - 86.26 - - 0.68 - -
FA 11.61 21.73 1.75 40.28 0.95 1.36 0.49 1.66 0.61
122
123
Figure 3. Particle size distribution of compound calcium-based stabilizer.
124
2.2. Experimental Program
125
The experimental program includes two parts. First the effects of IWC on the compaction
126
properties and UCS of the soil calcium-based stabilizer mixture were investigated by static
127
compaction tests and unconfined compression tests. Then, the variation of microstructure and
128
composition of the mixture with different IWCs were studied by optical microscope observation,
129
ESEM scanning, ESEM-EDAX analysis, and XRD spectra analysis.
130
Figure 4. pH variation with lime content. Figure 5. pH variation with cement content.
131
2.2.1. Mixture Design
132
As is shown in Table 1, the soil is slightly acidic with a pH of 6.55. According to former studies
133
[44, 45], cement cannot fully hydrate and harden to form CSH and CAH gels until the pH arrived at
134
a certain value. Therefore, we conducted a series of pH tests using the method presented by Eades
135
and Grim[46] to determine reasonable initial lime and cement content. Figure 4 shows that lime at
136
0.1 1 10 100
0 1 2 3 4 5
V
o
lu
m
e
p
e
rce
n
ta
g
e
(
%
)
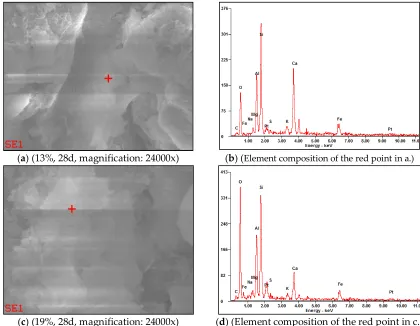
Particle size (μm)
0 1 2 3 4 5 6 7 8 9 10 11 12
5 6 7 8 9 10 11 12 13
p
H
Lime content (%)
0 1 2 3 4 5 6 7 8 9 10 11 12
6 7 8 9 10 11 12 13
p
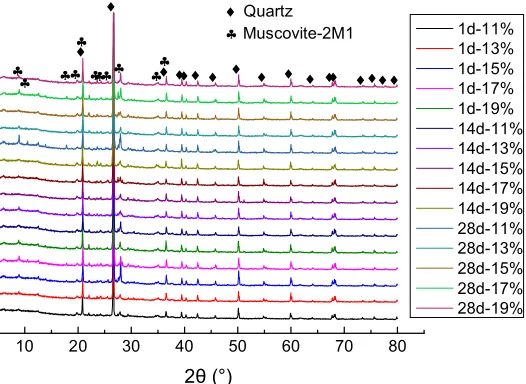
H
Cement content (%)
the weight of 1% dry soil can promote the pH of soil slurry up to 12.3 and after that the increase of
137
lime content cannot change pH significantly, so the initial lime content was 1% weight of dry soil.
138
Figure 5 indicates that in the cement content range studied, when cement content reaches 4%, the pH
139
value of diluted cement slurry is stable and the soil slurry curve is not far from that of
cement-140
soil slurry. Thus 4% weight of dry soil was chosen to be the initial cement content. The content of fly
141
ash which aims to provide pozzolans was set to be 1% weight of dry weight. Considering that fly ash
142
can consume a certain amount of lime by pozzolanic reaction, the lime content was accordingly
143
adjusted to 2% weight of dry soil. Consequently, the mixture was designed to be cement: lime: fly
144
ash: dry soil equal to 4: 2: 1: 100. Afterwards, we conducted a series of unconfined compressive tests
145
with four different combinations of cement, lime, fly ash, and dry soil (4:1:1:100;4: 2: 1: 100; 3: 3: 1:
146
100; 2: 4: 1: 100). The results show that the combination with cement: lime: fly ash: dry soil equal to 4:
147
2: 1: 100 has the highest unconfined compressive strength, thereby adopted as the final mixture
148
proportion for the tests.
149
2.2.1. Molding Points Design
150
As the reference point, the maximum dry density and optimum moisture content of the mixture
151
were tested to be 1.79g/cm3 and 15 %, respectively, by modified Proctor compaction test (Figure 6).
152
Specimens with different IWCs (11%, 13%, 15%, 17%, 19%, 21%) and two dry densities,
153
1.79g/cm3(100% compaction degree) and 1.72 g/cm3 (96% compaction degree), were made for the
154
tests. The molding points (line A and B) are shown in Figure 6. For each dry density and water
155
content, there are 30 parallel specimens.
156
Figure 6. Modified Proctor compaction curve and the molding points.
157
2.2.2. Specimens Molding Procedures
158
The specimens made in the study were cylindrical, 50mm high and 50mm in diameter. During
159
the molding process, each specimen was strictly made according to the following molding
160
procedures:
161
First, the water contents of the oven-dried soil and the calcium-based stabilizer were measured.
162
Then, the amount of dry soil and stabilizer needed for 6 specimens (controlled by the blender
163
used) was calculated, weighed and mixed by the blender for about 5 minutes until the dry
164
mixture is uniformly consistent.
165
Next, the calculated volume of water was added and mixed for another 5 minutes until a
166
homogenous soil-stabilizer mixture formed. After that, the mixture was carefully covered with
167
a sealing film to prevent moisture loss.
168
Finally, the quantity of the mixture for one specimen was weighed and put in the mold that had
169
two cylindrical compaction blocks.
170
8 10 12 14 16 18 20 22
1.55 1.60 1.65 1.70 1.75 1.80 1.85
B1 B2 B3 B4 B5
A1 A2 A3 A4 A5 A6
D
ry
d
e
n
s
it
y
(
g
/c
m
3 )
Water content (%)
2.2.3. Static Compaction Test
171
The compaction test was performed on a 30kN hydraulic pressing machine. After being filled
172
up, the mold was rapidly moved on the pressing machine to be statically compacted. The compaction
173
process was displacement-controlled with a displacement rate of 1mm/min. During the compaction
174
process, the compaction data of all specimens were recorded in detail by the sensors (sampling
175
frequency of 50Hz) installed on the pressing machine. When the specimens were compacted to the
176
designated dimension of 50mm high and 50mm in diameter, the load was kept stable for two minutes
177
before unloading. Then, the specimens were demolded and the mass, height and diameter of each
178
specimen was measured and documented.
179
2.2.4. Specimens Curing Process
180
To make comparisons, after compaction half of the specimens were placed in plastic sealing bags
181
to avoid external moisture intrusion and the other half were not treated. Then all the specimens were
182
transferred to the curing room with temperature at 20±1℃and humidity at 95±5%. Each 6 specimens
183
(3 in bags and the other 3 without bags) were marked as a group. Thus, specimens with the same
184
IWC and dry density were divided into five groups which were respectively cured to 1, 3, 7, 14 and
185
28 days. In order to only investigate the effects of IWC, all the specimens were kept as what they were
186
after different curing ages and did not submerge into water to saturate.
187
2.2.5. Unconfined Compression Test
188
The unconfined compression tests were conducted on the 30kN hydraulic pressing machine at
189
a displacement rate of 1mm/min according to ASTM D2166[47]. Before the unconfined compression
190
test, the mass, height and diameter of each specimen were measured again.
191
2.3. Microstructure and Composition Research
192
After the compression test, all the tested specimens were submerged into anhydrous ethyl
193
alcohol for 1 days and oven-dried at 70 ℃ for another day to terminate the hydration process. Small
194
parts from the unbroken district of the specimens were carefully taken out for microstructure and
195
composition research.
196
2.3.1. Optical microscope observation
197
To quickly and simply investigate the structure change of the dried soil, calcium-based stabilizer,
198
and soil-stabilizer mixture with the variation of IWC in real time, the optical microscope observation
199
was performed. The optical microscope used in the study is Lecia DM750 equipped with Leica ICC50
200
digital camera module, which can readily take photos and preserve the images. During observation,
201
the soil, stabilizer, and the mixture were evenly placed on an object slide as a thin layer and there was
202
not a coverslip on them. To protect the microscope, the object lens cannot be pushed too close and
203
thus the magnification times was limited to 40.
204
2.3.2. ESEM scanning and ESEM-EDAX analysis
205
The morphological structure of the specimens cured in plastic bags, in a much smaller scale than
206
that of optical microscope, was obtained by ESEM scanning. The ESEM used here was FEI Quanta
207
650 FEG with an acceleration voltage range of 200V - 30kV and maximum beam current of 200nA.
208
The ESEM was also equipped with an EDAX detector, by which the element composition of the
209
designated points of the specimens was acquired.
210
2.3.3. XRD analysis
211
The mineral change of the specimens with different IWC at different curing ages was analyzed
212
diffractometer with Cu-Kα radiation (λ=1.5418 Å); exploration range 5° to 80° 2θ; steps of 0.026 °2θ;
214
and goniometer speed of 0.001 °2θs−1.
215
3. Results
216
3.1. Static Compaction Test Results
217
Although there are some differences among each curve even in the same IWC group, typical
218
compaction curves of specimens with different IWCs are shown in Figure 7. The small horizontal
219
arrows on the curves mark the points where the specimens are compacted to the designated
220
dimension. The curve for IWC at 21% doesn’t have an arrow because the specimens were saturated
221
during compaction and couldn’t be fully compacted. Figure 8 shows that as the IWC increases from
222
11% to 19%, the maximum compaction force decreases from around 17kN to 12kN, while the total
223
axial deformation increases from about 29mm to 34mm. The slope of each curve, which reflects the
224
soil stiffness under different stress states, also varies slightly with different IWCs. Figure 8 shows the
225
secant slopes from original point to points of half maximum compaction force. It indicates that the
226
mean stiffness of the soil decreases in the form of cubic function as IWC increases from 11% to 19%.
227
Figure 7. Typical compaction curves. Figure 8. The effect of IWC on secant slope.
(a) (b)
Figure 9. Results of static compaction test: (a) maximum compaction force; (b) compaction energy.
228
To better understanding the effects of IWCs on the compaction properties of the mixture, the
229
maximum compaction force (Figure 9 (a)) and compaction energy (Figure 9 (b)) of two groups of
230
specimens at 100% compaction degree are further analyzed. The compaction energy is computed by
231
the integral of the compaction curve with the equation:
232
= ∑ 0.5( + )( − ), (1)
0 5 10 15 20 25 30 35
0.0 2.5 5.0 7.5 10.0 12.5 15.0 17.5 20.0 22.5 25.0 C o m p a c ti o n f o rc e ( k N ) Deformation (mm) w=11% w=13% w=15% w=17% w=19% w=21%
10 11 12 13 14 15 16 17 18 19 20
150 175 200 225 250 275 300 325 s e c a n t s lo p e (N/ m m )
Initial water comtent (%)
10 11 12 13 14 15 16 17 18 19 20
6 8 10 12 14 16 18 w=11% w=13% w=15% w=17% w=19% M a x im u m c o m p a c ti o n f o rc e ( k N)
Initial water content (%)
10 11 12 13 14 15 16 17 18 19 20
30 35 40 45 50 55 60 65 70 75 80 85 90 95 w=11% w=13% w=15% w=17% w=19% C o m p a c ti o n e n e rg y ( J )
where the is the compaction energy; and are the number
i
and
i-
1
compaction force,233
respectively; and
are the number
i
and
i-
1 displacement recorded by sensors.
234
It is observed that both the maximum compaction force and compaction energy decrease linearly
235
with the increase of IWC. The largest decline percentages for the maximum compaction force and
236
compaction energy are calculated to be 45.9% and 53.4%, respectively.
237
3.2. Unconfined Compression Test Results
238
Figure 10 presents the relationship between UCS and IWC at different curing ages (1d, 3d, 7d,
239
14d and 28d) under two curing conditions (with and without external water) and two degrees of
240
compaction (100% and 96%). The test results for specimens cured without external water supply are
241
shown in Figure 10(a) (100% compaction degree) and Figure 10(b) (96% compaction degree). Both of
242
the two figures show the same variation trend of UCS regardless of the compaction degree:
243
a) At early curing age (1 day and 3 days) the UCS decreases linearly as IWC increases from 11% to
244
19%;
245
b) After curing for 7 days and 14 days, the UCS value does not change significantly with the
246
variation of IWC;
247
c) Through a curing time of 28 days, a parabolic relationship between UCS and IWC can be
248
observed: the UCS first increases and then decreases with the increase of IWC, reaching peak
249
value at 15% IWC, which is equal to the optimum water content derived from the modified
250
Proctor compaction test.
251
(a) (b)
Figure 10. Effects of initial water content on unconfined compressive strength of specimens cured in
252
plastic bags: (a) dry density 1.79 g/cm3; (b)dry density 1.72 g/cm3.
253
Figure 11. Effects of initial water content on unconfined compressive strength of specimens cured in
254
moist air.
255
10 11 12 13 14 15 16 17 18 19 20 0.5 1.0 1.5 2.0 2.5 3.0 3.5 4.0 U n c o n fi n e d c o m p re s s iv e s tr e n g th ( M P a )
Initial water content (%)
1day curing age 3days curing age 7days curing age 14days curing age 28days curing age
10 11 12 13 14 15 16 17 18 19 20
0.2 0.4 0.6 0.8 1.0 1.2 1.4 1.6 1.8 2.0 2.2 2.4 2.6 U n c o n fi n e d c o m p re s s iv e s tre n g th (M P a )
Initial water content (%)
1day curing age 3days curing age 7days curing age 14days curing age 28days curing age
10 11 12 13 14 15 16 17 18 19 20 0.6 0.8 1.0 1.2 1.4 1.6 1.8 Un c o n fi n e d c o m p re s s iv e s tr e n g th ( M P a )
Initial water content (%)
Additionally, it can be found that in the first 7 days the UCS develops fast and the increase rate
256
of UCS accelerates with higher IWC; but afterwards the strength development gets slow and the
257
increase rate first enlarges then reduces in the variation range of IWC, reaching maximum at 15%
258
IWC.
259
As a comparison, Figure 11 presents the unconfined compression test results for specimens
260
cured in moist air. It can be clearly found that after a curing time of 14 and 28 days, for specimens
261
with 96% degree of compaction, the highest UCS value is obtained when the IWC is 15%, which
262
equals the optimum water content of modified Proctor compaction test; whereas under 100% degree
263
of compaction, the specimens compacted at lower IWCs (11% and 13%) tend to have higher UCSs.
264
Figure 12. Structure of wet soil (left) and dry soil (right). Figure 13. Stabilizer on the surface of water.
265
3.3. Optical Microscope Observations
266
Figure 12 shows the comparison of the structure of wet soil and dry soil. When the soil is
oven-267
dried to the water content about 3%, smaller particles and aggregates are generally attracted to the
268
surfaces of larger ones by attractive forces (mainly electrostatic forces according to former research[1,
269
48]), forming a spatial and porous structure. However, after water intrusion into the dry soil, the
270
original structure immediately breaks down to a dispersed fabric with clearer particle boundaries
271
and better transparency. When part of the wet soil is moved with the tip of toothpick, the adjacent
272
soil particles do not move. However, when the dry soil is moved in the same way, the adjacent soil
273
matric particles and aggregates in a certain distance move together. This optical microscope
274
observation indicates that water can decrease the attractive force between soil particles and make the
275
soil structure easier to change.
276
(a) (b)
Figure 14. Reaction products of calcium-based stabilizer (the red arrows pointing); (a) reaction time
277
Another interesting phenomenon from . Figure 13 is that when the water boundary gets close to
279
the dry soil, the whole aggregate will be fast pulled into the water, while when the water boundary
280
is approached to the stabilizer in the same way, the stabilizer particles are difficult to be attracted into
281
the water and some of them are even just absorbed on the water surface. According to the theory of
282
surface thermodynamics[49-51], this phenomenon indicates that the soil particles have higher surface
283
energy than the stabilizer particles and can be more easily wetted by water.
284
Figure 14 exhibits some reaction products of the stabilizer and it seems that the reaction products
285
tend to mainly formed on the boundary of the water.
286
3.4. ESEM Scanning and ESEM-EDAX Analysis
287
The microstructure of the specimens was investigated by ESEM scanning (Figure 15). The results
288
show that as the IWC increases, the number of large aggregates and agglomerations reduces while
289
the quantity of individual particles increases; and in turn the number of large inter-aggregate pores
290
decreases, leading to the soil structure getting fine and dense (Figure 15(a)~(d)). In addition, it is
291
observed that in 1day- and 3 day-specimens, the hydration products are too few to be easily found.
292
Only in specimens curing for 7 days will the hydration products of the calcium-based compound
293
stabilizer start to obviously come up. Furthermore, owing to the hydration products mainly
294
generating in the pores of soil matric particles, specimens with higher IWCs which have a more
295
dispersed pore structure seem to have a much more homogeneous structure (Figure 15(b), (d)).
296
(a) (11%, 14d, magnification: 200x) (b) (15%, 14d, magnification: 200x)
(e)
(
11%, 7d, magnification: 6000x) (f)(
17%, 7d, magnification: 6000x) Figure 15. Effects of initial water content on microstructure.297
During the ESEM scanning process, we also used EDAX to identify the element composition of
298
the hydration products in different areas of the specimens (Figure 16(b), (d)). It is found that though
299
the hydration products (which are already known as CSH and CAH) mainly compose of oxygen,
300
silicon, aluminum, and calcium, the percentage of each element in different scanning spots varies a
301
lot even in the same specimen. However, generally, it seems that for the hydration products of
302
specimens with higher IWC, the percentage of oxygen element tends to be a little higher, probably
303
because more free water transforms into structural water during the hydration process.
304
(a) (13%, 28d, magnification: 24000x) (b) (Element composition of the red point in a.)
(c) (19%, 28d, magnification: 24000x) (d) (Element composition of the red point in c.)
3.5. XRD Spectra Analysis
306
Figure 17 presents the results of XRD analysis. It can be found that with different IWCs at various
307
curing ages, the crystalline minerals (principally quartz and muscovite) in the specimens do not
308
change obviously, whereas the characteristic peaks of clay minerals get smaller or even disappear.
309
The expected dispersed characteristic peaks of amorphous hydration products, CSH and CAH, are
310
not obvious, which maybe attribute to the relatively small addition of calcium-based compound
311
stabilizer and insufficient crystallization time.
312
Figure 17. Effects of initial water content on mineral composition.
313
4. Discussions
314
Combining the mechanical property study with the microstructure and composition research,
315
the effects of initial water content on the soil-stabilizer mixture studied can be revealed as follows.
316
4.1. The effects of initial water content on the compaction process
317
The results of optical microscope observation identify the foundational effect of the molding
318
water: it breaks down the soil aggregates and agglomerations into individual particles and make the
319
soil structure more easily to be changed. This is also confirmed by other researches[52-54] and can be
320
explained by the diffused double layer (DDL) theory. More water enlarges the thickness of the DDL
321
of the soil particles and even free water will come up, lessening the shear resistance of the soil. As a
322
result, on the scale level of the whole mixture, the stiffness of the mixture declines (Figure 8) and if
323
there is no excess pore water pressure, it will need less force and energy to densify the mixture, which
324
is testified by the static compaction test (Figure 9). In the meanwhile, more water in the mixture means
325
more individual soil particles exists and thus during densification process, small particles can more
326
easily move to the pores between larger particles or aggregates to minify the pores, which was
327
identified by the ESEM scanning (Figure 15) and other relevant researches[52, 55-57]. Therefore, right
328
after compaction, the specimens with different IWCs have different original structures: specimens
329
with higher initial water content have less aggregates and agglomerations, and smaller proportion of
330
large pores.
331
4.2. The effects of initial water content on the strength development
332
During curing process, the water reacts with the calcium-based stabilizer to produce the bonding
333
gels. Specimens with different IWCs have different reaction rates (Figure 10 and Figure 11). The
334
produced gels change the mixture structure to yield different UCS at different curing ages for
335
different specimens. The UCS is just the reflection of the structural properties of the mixture at a
336
certain time.
337
10 20 30 40 50 60 70 80
§
§ §§§§ §
§
§§ ¨¨¨¨¨ ¨ ¨ ¨ ¨ ¨¨ ¨¨¨¨
¨
2θ (°)
1d-11% 1d-13% 1d-15% 1d-17% 1d-19% 14d-11% 14d-13% 14d-15% 14d-17% 14d-19% 28d-11% 28d-13% 28d-15% 28d-17% 28d-19%
¨ Quartz
§Muscovite-2M1
For the specimens cured without external water, in the earlier days (1 day and 3 days) of curing
338
process, the stabilizer has not fully reacted and the mixture structure mainly maintained what they
339
were after compaction, which is confirmed by the ESEM scanning. Thus, the strength of the mixture
340
is principally dependent on the strength of the soil structure, which is controlled by the average
341
thickness of the water membrane (DDL and free water). As initial water content increases, the average
342
water membrane is thicker. Consequently, the UCS decreases linearly with the increase of IWC as
343
shown in Figure 10 and Figure 11. However, as water content increases, there is a bigger probability
344
to form continuous water passage, which facilitates the cation exchange, dissolution and diffusion
345
process of the soil-water-stabilizer reaction system and thus, the increase rate of UCS in the first 7
346
days is higher for the specimens with higher IWC. The UCS value does not change significantly with
347
the variation of IWC at the curing age of 7 days. After that, as the pores are gradually filled by reaction
348
products and free water is lacking, the increase rate for all the specimens decreases.
349
At 28 days curing age, for specimens with lower IWC, there are more large pores and some of
350
them cannot be fully filled and bonded (Figure 15(a), (c)); while in the specimens with higher IWC,
351
though a more homogeneous structure is observed (Figure 15(b), (d)), higher IWC excessively destroy
352
the soil structure and more free water remain in the water membrane of the soil particles. These may
353
be why the UCS first increases and then decreases with the increase of IWC at 28 days curing age.
354
For the specimens cured in moist air, the water is continuously supplied by external water source
355
until the specimens were saturated. Therefore, the inherent aggregates and agglomerations of the soil
356
can be totally wetted during the curing process and the strength contribution of soil structure are
357
weakened. As a result, at the same compaction degree, the UCS of specimens cured in moist air
358
significantly reduced compared to that of specimens cured without external water. Under different
359
compaction degrees at the same curing age, the UCS variation with IWC is different (Figure 11) and
360
this may be attributed to the different original structures after compaction. It can be speculated that
361
there must be an optimum original mixture structure corresponding to certain initial water content
362
under different compaction degrees that is beneficial to the strength development, which needs
363
further investigation.
364
From the discussions above, it can be concluded that the determination of IWC in soil
365
stabilization practice should consider three issues: compaction, curing environment, and the targeted
366
value of specific engineering properties; rather than only compaction. It is recommended that when
367
a soil is stabilized by a stabilizer that can react with water, for a given dry density and a given curing
368
environment, a series of IWCs should be tested to find the appropriate compaction energy and the
369
optimum IWC.
370
5. Conclusions
371
Initial water content is an important factor affecting the engineering properties such as strength,
372
stiffness and compressibility of the soil stabilized by the calcium-based stabilizer in the research. The
373
following conclusions can be drawn from the study:
374
In the range of initial water content studied, both the compaction energy and the maximum
375
compaction force decrease linearly with the increase of initial water content, and the largest reduction
376
is 53.4% and 45.9%, respectively.
377
As the initial water content increases from 11% to 19%, there are less soil aggregates or
378
agglomerations, and smaller proportion of large pores in the mixture structure after compaction.
379
For specimens cured without external water supply, regardless of the compaction degree, after a
380
curing age of 28 days, the highest unconfined compressive strengths were acquired at initial water
381
content of 15%, which equals to the optimum water content derived from the modified Proctor
382
compaction test. Higher initial water content enlarges the increase rate of the unconfined compressive
383
strength in the first 7 days; after that, the increase rate first increases then decreases, and acquires
384
maximum at initial water content of 15%.
385
degree, and 15% under 96% compaction degree, respectively.
387
As the initial water content increases, the percentage of oxygen element tends to increase in the
388
reaction products of the calcium-based stabilizer.
389
The crystalline mineral of the soil did not change obviously with the variation of initial water content.
390
Author Contributions: The background research for this publication was carried out by all authors. C.Y., W.Z.
391
and Z.H. conceived and designed the experiments and wrote this manuscript. C.Y., W.Z., and X. J. performed
392
the experiments. All the authors participated in the analysis of experiments results.
393
Funding: This research was funded by the Shaoxing (Zhejiang, China) Science and Technology Planning Project
394
with Grant No. 2017702.
395
Conflicts of Interest: The authors declare no conflict of interest.
396
References
397
1. Mitchell, J. K.; Soga, K., Fundamentals of Soil Behavior. 3rd ed.; Publisher: Wiley, New Jersey, America, 2005;
398
pp. 5-7, 978-0-471-46302-3.
399
2. Grim, R. E., Applied clay Mineralogy. 1st ed.; Publisher: McGraw-Hill, New York, America, 1962; pp.
39-400
39(1).
401
3. Chang; R., K.; Warkentin; B., P., Volume Change of Compacted Clay Soil Aggregates. Soil Sci. 1968, 105,
402
(105), 106-111.
403
4. Barbour, S. L.; Fredlund, D. G., Mechanisms of osmotic flow and volume change in clay soils. Can. Geotech.
404
J 1989, 26, (4), 551-562.
405
5. Lytton, R. L., Prediction of movement in expansive clays. Geotech. Spe. Pub. 1994, 2, (40), 1827-1845.
406
6. Petry, T. M.; Little, D. N., Review of Stabilization of Clays and Expansive Soils in Pavements and Lightly
407
Loaded Structures—History, Practice, and Future. J. Mater. Civ. Eng. 2002, 14, (6), 447-460.
408
7. Escolano, F.; Sánchez, J.; Pacheco-Torres, R.; Cerro-Prada, E., Strategies on Reuse of Clayey Expansive Soils
409
as Embankment Material in Urban Development Areas: A Case Study in New Urbanized Zones. Appl. Sci.
410
2018, 8, (5).
411
8. Hilt, G. H.; Davidson, D. T., Lime fixation in clayey soils. Highw. Res. Boa. Bull. 1960.
412
9. Glenn, G. R.; Handy, R. L., Lime-clay mineral reaction products. Highw. Res. Rec. 1963.
413
10. Mitchell, J. K.; Hooper, D. R., Influence of time between mixing and compaction on properties of lime
414
stabilized expansive clay. Highw. Res. Boa. Bull. 1961.
415
11. Bateman, J.; Hutchison, R.; Dijkstra, T.; Beetham, P.; Dixon, N.; Fleming, P., Lime stabilisation for
416
earthworks: a UK perspective. Proceedings of the Institution of Civil Engineers Ground Improvement 2015, 168,
417
1-15.
418
12. Bulletin, H. B., Cement-soil stabilization. Highw. Res. Boa. Bull. 1958.
419
13. Mills, W. H.; Levison, A. A., CEMENT-SOIL STABILIZATION. Highway Research Board Proceedings 1938,
420
17.
421
14. Zhang, T.; Yue, X.; Deng, Y.; Zhang, D.; Liu, S., Mechanical behaviour and micro-structure of
cement-422
stabilised marine clay with a metakaolin agent. Constr. Build. Mater. 2014, 73, 51-57.
423
15. Horpibulsuk, S.; Rachan, R.; Chinkulkijniwat, A.; Raksachon, Y.; Suddeepong, A., Analysis of strength
424
development in cement-stabilized silty clay from microstructural considerations. Constr. Build. Mater. 2010,
425
24, (10), 2011-2021.
426
17. Thornton, S. I.; Parker, D. G.; White, D. N. In SOIL STABILIZATION USING A WESTERN COAL HIGH
428
CALCIUM FLY ASH, Proceedings of 4th International Ash Utilization Symposium, St. Louis, Missouri,
429
March 24-25, 1976., 1976.
430
18. Wild, S.; Kinuthia, J. M.; Robinson, R. B.; Humphreys, I., Effects of Ground Granulated Blast Furnace Slag
431
(GGBS) on the Strength and Swelling Properties of Lime-Stabilized Kaolinite in the Presence of Sulphates.
432
Clay Mine. 1996, 31, (3), 423-433.
433
19. Higgins, D. D.; Kinuthia, J. M.; Wild, S. In SOIL STABILIZATION USING LIME-ACTIVATED GROUND
434
GRANULATED BLAST FURNACE SLAG, Fly Ash, Silica Fume, Slag and Natural Pozzolans in Concrete,
435
1998; pp 1057-1074.
436
20. Goodarzi, A. R.; Salimi, M., Stabilization treatment of a dispersive clayey soil using granulated blast furnace
437
slag and basic oxygen furnace slag. Appl. Clay Sci. 2015, 108, 61-69.
438
21. Miller, G. A.; Azad, S., Influence of soil type on stabilization with cement kiln dust. Constr. Build. Mater.
439
2000, 14, (2), 89-97.
440
22. Bandara, N.; Grazioli, M. J., Cement Kiln Dust Stabilized Test Section on I-96/I-75 in Wayne County –
441
Construction Report. Soil Stabilization 2009.
442
23. Choobbasti, A. J.; Ghodrat, H.; Vahdatirad, M. J.; Firouzian, S.; Barari, A.; Torabi, M.; Bagherian, A.,
443
Influence of using rice husk ash in soil stabilization method with lime. Front. Earth Sci. China 2010, 4, (4),
444
471-480.
445
24. Qasim, M.; Bashir, A.; Tanvir, M.; Anees, M. M., Effect of Rice Husk Ash on Soil Stabilization. Bull. Ener.
446
Econo. 2015, 3, 10-17.
447
25. Ferruzzi, G. G.; Pan, N.; Casey, W. H., Mechanical properties of gellan and polyacrylamide gels with
448
implications for soil stabilization. Soil Sci. 2000, 165, (10), 778-792.
449
26. Orts, W. J.; Roa-Espinosa, A.; Sojka, R. E.; Glenn, G. M.; Imam, S. H.; Kurt; Skov, J., Use of Synthetic
450
Polymers and Biopolymers for Soil Stabilization in Agricultural, Construction, and Military Applications.
451
J. Mater. Civ. Eng. 2007, 19, (1), 58-66.
452
27. Ceylan, H.; Gopalakrishnan, K.; Kim, S. H., Soil stabilization with bioenergy coproduct. J. Transpor. Res.
453
Boar. 2010, 2186, (-1), 130-137.
454
28. Zhang, T.; Cai, G.; Liu, S.; Puppala, A. J. In Stabilization of silt using a lignin-based bioenergy coproduct,
455
Transportation Research Board 93rd Annual Meeting, 2014.
456
29. Reddy, B. V. V.; Kumar, P. P., Cement stabilised rammed earth. Part A: compaction characteristics and
457
physical properties of compacted cement stabilised soils. Mater. Struct. 2011, 44, (3), 681-693.
458
30. Puppala, A. J., Advances in Ground Modification with Chemical Additives: From Theory to Practice.
459
Transpor. Geotech. 2016, 9, 123-138.
460
31. Terashi, M. In DEEP MIXING METHOD - BRIEF STATE OF THE ART, Fourteenth International Conference
461
on Soil Mechanics and Foundation Engineering. Proceedings, 1999.
462
32. Richardson, I. G., The nature of the hydration products in hardened cement pastes. Cem. Concr. Compos.
463
2000, 22, (2), 97-113.
464
33. Bullard, J. W.; Jennings, H. M.; Livingston, R. A.; Nonat, A.; Scherer, G. W.; Schweitzer, J. S.; Scrivener, K.
465
L.; Thomas, J. J., Mechanisms of cement hydration. Cem. Concr. Res. 2011, 41, (12), 1208-1223.
466
34. Scrivener, K. L.; Juilland, P.; Monteiro, P. J. M., Advances in understanding hydration of Portland cement.
467
Cem. Concr. Res. 2015, 78, 38-56.
468
35. Thom, R.; Sivakumar, R.; Sivakumar, V.; Murray, E. J.; Mackinnon, P., Pore size distribution of unsaturated
469
36. DavidLeonardChapman, LI. A contribution to the theory of electrocapillarity. Philos. Mag. 1913, 25, (148),
471
475-481.
472
37. Gouy, G., Sur la constitution de la charge electrique a la surface d’ un electrolyte. Journal De Physique
473
Théorique Et Appliquée 1910, 9, 457-468.
474
38. Ramesh, H. N. G.; Sivapullaiah, P. V., Role of moulding water content in lime stabilisation of soil.
475
Proceedings of the Institution of Civil Engineers Ground Improvement 2011, 164, (1), 15-19.
476
39. Guo, A. G.; Kong, L. W.; Ming-Jian, H. U.; Gang, G.; Wang, Q., On determination of optimum water content
477
of lime-treated expansive soil. Rock Soil Mech. 2007, 28, (3), 517-521.
478
40. Consoli, N. C.; Lopes, L. D. S.; Heineck, K. S., Key Parameters for the Strength Control of Lime Stabilized
479
Soils. J. Mater. Civ. Eng. 2009, 21, (5), 210-216.
480
41. Consoli, N. C.; Foppa, D.; Festugato, L.; Heineck, K. S., Key Parameters for Strength Control of Artificially
481
Cemented Soils. J. Geotech. Geoenvir. Eng. 2007, 133, (2), 197-205.
482
42. Arora, S.; Aydilek, A. H., Class F Fly-Ash-Amended Soils as Highway Base Materials. J. Mater. Civ. Eng.
483
2005, 17, (6), 640-649.
484
43. Standard Practice for Classification of Soils for Engineering Purposes (Unified Soil Classification
485
System),ASTM International,West Conshohocken,PA,2017,doi.org/10.1520/D2487-17.
486
44. Croft, J. B., The Influence of Soil Mineralogical Composition on Cement Stabilization. Géotech. 1967, 17, (2),
487
119-135.
488
45. Cherian, C.; Arnepalli, D. N., A Critical Appraisal of the Role of Clay Mineralogy in Lime Stabilization. Int.
489
J. Geosyn. Groun. Eng. 2015, 1, (1), 8.
490
46. Eades, J., A quick test to determine lime requirements for lime stabilization. H.r.r 1966, 39.
491
47. Standard Test Method for Unconfined Compressive Strength of Cohesive Soil,ASTM International,West
492
Conshohocken,PA,2016,doi.org/10.1520/D2166_D2166M-16.
493
48. Shainberg, I.; Kemper, W. D. In ELECTROSTATIC FORCES BETWEEN CLAY AND CATIONS AS
494
CALCULATED AND INFERRED FROM ELECTRICAL CONDUCTIVITY, Clays & Clay Minerals
495
Conference Proc, 1966; pp 117–132.
496
49. Defay, R.; Prigogine, I.; Sanfeld, A., Surface thermodynamics. J. Colloid Interface Sci. 1977, 58, (3), 498-510.
497
50. Mutaftschiev, B., Surface Thermodynamics. Publisher: Springer Netherlands, 1982.
498
51. Neumann, A. W.; David, R.; Zuo, Y., Applied surface thermodynamics. Focus Surf. 2011, 2011, (3), 6.
499
52. Romero, E.; Vecchia, G. D.; Jommi, C., An insight into the water retention properties of compacted clayey
500
soils. Géotech. 2011, 61, (4), 313-328.
501
53. Musso, G.; Romero, E.; VECCHIA, G. D., Double-structure effects on the chemo-hydro-mechanical
502
behaviour of a compacted active clay. Géotech. 2013, 63, (3), 206-220.
503
54. BeckettChristopher; CiancioDaniela, Effect of compaction water content on the strength of cement-stabilize.
504
Can. Geotech. J 2014, 51, (51), 583--590.
505
55. Casini, F., Consequences on water retention properties of double-porosity features in a compacted silt. Acta
506
Geotechnica 2012, 7, (2), 139-150.
507
56. Delage, P.; Lefebvre, G., Study of the structure of a sensitive Champlain clay and of its evolution during
508
consolidation. Can. Geotech. J 1984, 21, (1), 21-35.
509
57. Lapierre, C.; Leroueil, S.; Locat, J., Mercury intrusion and permeability of Louiseville clay. Can.geotech.j
510
1990, 27, (6), 761-773.