Available Online atwww.ijcsmc.com
International Journal of Computer Science and Mobile Computing
A Monthly Journal of Computer Science and Information Technology
ISSN 2320–088X
IMPACT FACTOR: 6.017
IJCSMC, Vol. 6, Issue. 6, June 2017, pg.297 – 301
B
IG
D
ATA
A
NALYSIS OF
A
IRLINE
D
ATA
S
ET USING
H
IVE
P. Swathi
1, J. Kumari
2[email protected], [email protected]
CSE Dept, Assistant Professor12 VBIT12
ABSTRACT
In this paper, the analysis of the airline data set is performed using Microsoft Azure HDInsight which runs Hadoop in the cloud. Hive and Hive QL statements have been used for querying the data. Data visualization has been done by extracting the output of the HIVE query in excel and plotting the data using line and scatter plot charts. The visualization of the data shows some patterns that exist between flight diversions and flight distance, flight cancellation and flight distance and so forth.
Keywords: Hadoop, HDInsight, Big Data, Hive, Data Visualization, Data Analysis
1. INTRODUCTION
mechanism by which the data set is analyzed. Section 4 describes the experimental observations from the data set. Section 5 is the conclusion of this paper.
2. AIRLINE DATA, HIVE AND HDINSIGHT
This section briefly describes the characteristics of the Airline Data set, introduces HIVE and HDINSIGHT.
2.1 Characteristics of the Airline Data Total number of files: 36.
File type: csv (comma separated values) Total file size: 3.65 GB.
Total number of records: 18.2 Million (18,286,090) 2.2 Hive
Hive, allows SQL developers to write Hive Query Language (HQL) statements that are similar to standard SQL statements. HQL statements are broken down into MapReduce jobs and executed across a Hadoop cluster. Even though, HQL statements are similar to SQL statements, there are several key differences because Hive is based on Hadoop and MapReduce Operations. The first is that Hadoop is intended for long sequential scans, and because Hive is based on Hadoop, queries tend to have a very high latency (many minutes). This means that Hive would not be appropriate for applications that need very fast response times. Hive is read-based and therefore not appropriate for transaction processing that typically involves a high percentage of write operations [2].
2.3 HD Insight
Azure HDInsight deploys and provisions Apache Hadoop clusters in the cloud, providing a software framework designed to manage, analyze, and report on big data with high reliability and availability. HDInsight uses the Hortonworks Data Platform (HDP) Hadoop distribution. Hadoop often refers to the entire Hadoop ecosystem of components, which includes Storm and HBase clusters, as well as other technologies under the Hadoop umbrella. Azure HD Insight deploys and provisions Hadoop clusters in the cloud, by using either Linux or Windows as the underlying Operating System [3].
3. ANALYSIS OF AIRLINE DATA USING HDINSIGHT
In order to analyze the Airline Data, the data needs to be first saved to the Azure Blob
Storage [4], which is a cloud data storage service provided by Microsoft Azure. For transferring the Airline Data to the Azure Blob storage, a client utility program “CloudBerry Explorer for Azure Blob Storage” was used [5]. Azure Blob storage is a robust, general-purpose storage solution that integrates seamlessly with HDInsight. Through a Hadoop
distributed file system (HDFS) interface, the full set of components in HDInsight can operate
directly on structured or unstructured data in Blob storage. Storing data in Blob storage
provides the ability to safely delete the HDInsight clusters that are used for computation
without losing user data. Azure HDInsight provides a full-featured Hadoop distributed file
system (HDFS) over Azure Blob storage. It enables the full set of components in the Hadoop
ecosystem to operate directly on the data it manages. Azure Blob storage and HDFS are
Once the Azure Blob storage account is created and the data is transferred, the HDInsight
cluster can be launched from Microsoft Azure Portal. The overall structure of the system is as
shown in the Fig 1 below.
4. EXPERIMENTAL RESULTS
For analyzing the Airline Data, a cluster of 4 data nodes (4 compute machines) running Microsoft Windows Server 2012 R2 Datacenter operating system was launched. Hive runs on the cluster by default when the cluster is up and running. Using the Hive query console, the data is analyzed as follows:
4.1 Total Number of Flights Cancelled Each Month for 2012-2014
The Hive QL for querying the total number of flights that were cancelled every month from 2012 to 2014 is:
SELECT YEAR, MONTH, COUNT (CANCELLED) AS TOTAL_CANCELLED FROM Airline
WHERE CANCELLED = 1 GROUP BY YEAR, MONTH ORDER BY YEAR, MONTH
LIMIT 50;
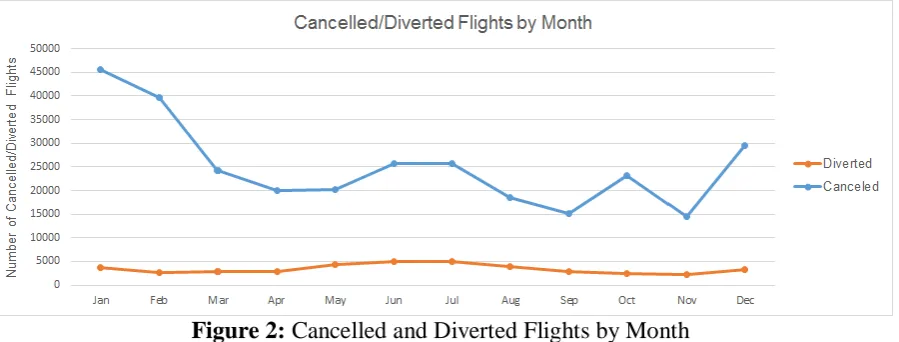
4.2 Total Number of Flights Diverted Each Month for 2012-2014
The Hive QL for querying the total number of flights that were diverted every month fro m 2012 to 2014 is:
SELECT YEAR, MONTH, COUNT (DIVERTED) AS TOTAL_DIVERTED FROM Airline
Figure 2: Cancelled and Diverted Flights by Month
4.3 Total Number of Flights Cancelled Each Year for 2012-2014
The Hive QL for querying the total number of flights that were cancelled every year from 2012 to 2014 is:
SELECT YEAR, COUNT (CANCELLED) AS TOTAL_CANCELLED FROM Airline
WHERE CANCELLED = 1 GROUP BY YEAR
ORDER BY YEAR LIMIT 50;
The total time that
5. CONCLUSION
From the above experimental results, we can see that interesting sets of trends and patterns exists in large data sets which help us to get a better understanding of the data. Recent advancement in cloud technologies helps us to harness the power of parallel processing of a cluster of computers with little investment and almost no maintenance of the underlying computer hardware. From the experimental results we also see the following observations: a. Average flight departure delay is at peak during the months of June and July every year and there is a sharp increase in the average delay from November to December.
c. Highest average departure delay for flights has been observed for flight distance of less than 500 miles.
d. Highest numbers of flights which are cancelled have a flight distance of less than 1000 miles.
e. There is a trend of increasing flights which are cancelled every year from 2012 to 2014. f. There is a sharp rise in the number of flights which are cancelled from the month of November to January every year for 2012 to 2014.
REFERENCES
[1] Airline Data Set, United States Department of Transportation, Office of the Assistant
Secretary for Research and Technology, Bureau of Transportation Statistics,
http://www.transtats.bts.gov/DL_SelectFields.asp?Table_ID=236
[2] What is Hive? http://www-01.ibm.com/software/data/infosphere/hadoop/hive/.
[3] Introduction to Hadoop in HDInsight: Big-data analysis and processing in the cloud, https://azure.microsoft.com/en-us/documentation/articles/hdinsight-hadoop-introduction/ [4] An Introduction to Windows Azure BLOB Storage, https://www.simple-talk.com/cloud/cloud-data/an-introduction-to-windows-azure-blob-storage-/
[5] Explorer for Microsoft Azure Storage: Freeware
Client,http://www.cloudberrylab.com/free-microsoft-azure-explorer.aspx
[6] Upload data for Hadoop jobs in HDInsight, https://azure.microsoft.com/en-us/documentation/articles/hdinsight-upload-data/
[7] “Market Basket Analysis Algorithms with MapReduce”, Jongwook Woo, DMKD-00150, Wiley Interdisciplinary Reviews Data Mining and Knowledge Discovery, Oct 28 2013,