The Use of Regression Models to Predict Spa-
tial Patterns of Cattle Behavior
R.L. SENFT, L.R. RITTENHOUSE, AND R.G. WOODMANSEE
Predictive models of cattle behavior were developed by applying multiple regression analysis to a body of behavior observations. Seven independent variables were required to describe the spatial patterns of three modes of behavior on an annual basis. Coeffi- cients of determination were 0.50,0.34,0.25, and 0.20 for grazing + travel, summer resting, winter resting, and bedding, respectively.
Spatial patterns of each mode were predicted for a 125ha pasture, upon which a separate set of behavior observations had been made. Comparisons of observed and predicted patterns varied from a close fit for grazing to marginal for resting. Validation using the spatial pattern of fecal deposition, however, yielded a close flt. It was concluded that multiple regression models can be useful in predicting spatial patterns of livestock behavior and may have unexploited potential as both management and research tools.
There is a virtual absence of truly predictive knowledge about the environmental factors which determine or influence spatial patterns of landscape use by domestic animals. This is unfortunate, because spatial behavior of free-roaming animals, such as cattle, potentially affects diet selection, nutrient intake, efficiency of for- age utilization, as well as the impact of management strategies as the landscape or ecosystem level. The capacity to understand and predict livestock spatial behavior, then, would be a potent tool for the management or study of extensive grazing systems.
Attempts to develop models of cattle spatial use have encoun- tered the problem that many factors influence behavior at any given time and place. Some of these factors are permanent site features such as topography (Mueggler 1965, Cook 1966), water development (Valentine 1947, Lange 1969, Squires 1978), or plant community composition (Cook 1966, Clary et al. 1978). Other factors may be relatively shortlived climatic or seasonal events (Malechek and Smith 1976, Low et al. 1981). The existence of several simultaneously acting influences, which may vary from site to site, has made the sorting and documentation of individual factors difficult; the occurrence of ephemeral but powerful forces such as weather events has complicated the problem.
Multiple regression analysis has been employed in the analysis of spatial patterns with mixed success (Mueggler 1965, Cook 1966, Lange 1969, Lange and Willcocks 1978, Clary et al. 1978). A variety of dependent variables have been studied, including extent of forage utilization (Cook 1966), density of sheep tracks (Lange 1969), and density of animal excreta (Mueggler 1965). Independent variables have generally included such salient environmental ele- ments as slope, elevation, distance upslope, tree or shrub density, density of palatable plants or distance from water or salt (Cook 1966, Clary et al. 1978, Mueggler 1965). The purpose of these studies was primarily descriptive, that is, to identify factors which contributed to the observed patterns. However, multiple regres- sion not only has the power to isolate sets of predictors from a field of variables but it can also derive quantitative relationships. This
Authors are graduate student and professors, Department of Range Science, Colo- rado State Universitv. Fort Collins 80523.
This research was kpported by NSF Grant No. DEB 7906009 and Colorado State University Experiment Station No. 2797. Data for plant community surveys were supplied by the Natural Resources Ecology Laboratory, Colorado State University, Fort Collins.
Manuscript received July 9, 1982.
JOURNAL OF RANGE MANAGEMENT 36(5). September 1483
suggests that the resulting models can be used as predictive tools, to predict patterns of animal behavior on areas other than those from which equations were derived. To our knowledge this has never been done.
It was our objective to (I) derive a series of predictive models of cattle spatial behavior, (2) use those models to predict behavior on a different site within the same vegetation type, and (3) evaluate the success of our predictions.
Methods
All data were collected on the USDA-ARS Central Plains Experimental Range in northeastern Colorado. Vegetation on this site (Jameson 1968) is dominated by blue grama [Bourelouugruci- lis (H.B.K.) Lag.] and buffalograss [Buchloe ducryloides (Nutt.) Engelm.]. Other important species include western wheatgrass (Agropyron smithii Rydb.),pricklypearcactus(Opuntiapolyacan- rho Haw.), and fringed sagewort (Artemesiufrigidu Willd.).
Observations of cattle movements were made on two small paddocks, I1 ha and 22 ha, respectively, as part of the US/ IBP Grassland Biome Study during 1970-1973 (Dean and Rice 1974). In that study, cattle were followed on foot for one 24hour period each month. Two animals were maintained on the larger pasture and 3 to 6 were maintained on the smaller pasture. Locations of each herd were recorded on pasture maps every 30 minutes. Paths of travel between points were also recorded. The pasture maps were divided into 24 m by 24 m grid cells. Total observed time was recorded in each cell for three modes of behavior: (1) grazing -I- travel, (2) daytime resting, and (3) bedding (nighttime resting). Resting time was measured directly as the length of time that the herd remained stationary for more than one observation point. Grazing + travel time was measured indirectly as the length of all paths of movement through a grid cell. We used these data as a base for deriving predictive models of cattle spatial behavior. Data were analyzed using stepwise multiple regression. Data for independent variables were obtained from USGS topographic maps and plant community surveys conducted as part of the Grassland Biome Study.
A 125-ha pasture adjacent to the small paddocks was designated for validation of the behavior models (Figure 1). As part of the validation process, fecal pat densities were mapped. In the late summer of 1979, a series of 34 north-south transects were run. Each transect was 3 m wide. The total number of fecal pats in 24-m segments of the transects were recorded. All fecal pats, regardless of age, were counted. A model of fecal deposition was developed to predict the spatial pattern of fecal pat densities on the validation pasture. It was assumed that fecal pat density on a given area would be proportional to time spent in that area (Lange and Willcocks 1978). The three behavior models were weighted by the average amount of time spent per day in each activity. The sum of the weighted behavior models constituted the fecal deposition model.
Results Structure of the Models
Fig. 1. Topography of the 12.5&a validation pasture (IO-f1 contour inter- vaisj. .rhe stock watering point is indicated by an asterisk ci) ?%e square in the ten ter of the pasture is a permanent grazing exclosure. i’his area has a history of light to moderate stocking on a year-round basis.
by the following criteria:
(1) Correlation with the dependent behavior variable had to be statistically significant at the 0.001 level of probability. (2) Correlation with another independent variable in the model had to be at least one order of magnitude less than correlation with the dependent behavior variable.
(3) Two-way and higher order interactions were not consi- dered. Thus, the effects of environmental factors had to be additive.
(4) The predictor had to be interpretable in some biological, ecological or ethological sense.
Nonlinear transformations (logarithmic, inverse, square) of poten- tial predictors were screened, as well as untransformed variables. Of over 60 independent variables screened, 7 were incorporated into the spatial behavior models(Table I). Patterns ofcattle behav- ior at the annual time-scale were largely determined by topogra- phic factors. With the exception of pricklypear cactus frequency, none of the vegetation variables tested entered the models. Coeffi- cients of determination were relatively low, but within the range of values found in previous studies (Cook 1966).
Mathematical relationships among behavior and pasture char- acteristic variables were nonlinear (Table 1). Aspect, an important component of the resting models, appeared as the cosine of degrees deviation from northeast, the cooiest exposure. Preference for north- or south-facing slopes were controlled by the sign of the coefficient. The remaining pasture characteristic variablesappear- ed as simple hyperbolic or inverse terms:
behavior time per grid = f (pasture characteristic variable)
Or
y=b.fb$+<+..+bx.
where y is a behavior variable, xi is a pasture characteristic varia- ble, and bi is the regression coefficient and b, is a constant.
Table 1. Significant predictors of behavior on the small pasturcs.
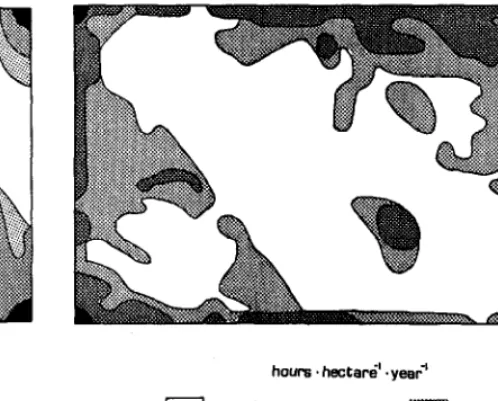
Fig. 2. Pattern of grazing and travelpredicted by the regression model. l?te spatial distribution of grazing and travel lime is shown. Grazing and travel were combined because they could not be separated in the original data.
Cactus frequency was linearly related to grazing +,travel and bedding.,The relationship in both cases was negative, implying avoidance or interference with those activities (Bement 1968) or perhaps a correlation with some other unmeasured site variable.
Predicted Patterns of Behavior
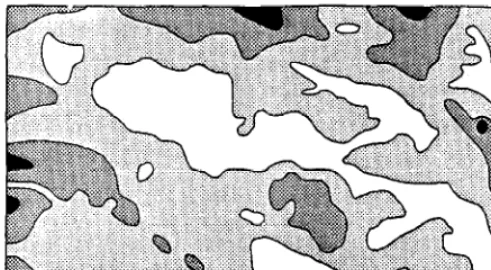
Figures 2 through 4 show spatial patterns of cattle behavior predicted by the regression models. Predicted grazing i- travel on the 12%ha validation pasture (Fig. 2) was concentrated in drain- ages, near fencelines, and around the watering area. Predicted summer and winter resting (Fig. 3) had complimentary patterns, with summer daytime resting occurring on cooi north-facing siopes and winter daytime resting occurring on warm south-facing slopes. Significant amounts of resting were predicted for fence corners year-round. Predicted bedding or nighttime resting (Figure 4) was concentrated along fencelines and in drainage bottoms. The pat- tern of predicted bedding resembled that of grazing + travel, but with less utilization of slopes.
Validation
The regression models were validated by two methods: (1) com- parison of breakdowns of predicted behavior with past observa- tions of cattle activities on the validation pastures, and (2) comparison of predicted fecal deposition against the observed pattern of fecal deposition on the validation pasture.
For comparison with past observed behavior, the validation pasture was divided into four distinct terrain types (Table 2). Predicted grazing + travel closely approximated observed patterns (Schwartz 1977). Predicted resting, however, compared less favor- ably with observed. Both the summer and winter resting models underestimated use of the lowlands and overestimated use of
Pasture characteristic
Behavior
Grazing + travel Summer resting Winter resting Beddine
Distance from CWhlS
Water Fence Corner Elev. Aspect freq. Slope f
s* S s s 0.50
s s S S 0.34
s S S 0.25
S S S S 0.20
Functi&ral form in models I I I I
Cos (X + k) X 1
-
- - - - -
X X X X
l S denotes a pasture variable statistically significant in predicting the distribution of a given behavior at the 0.001 level.
X
a
hours. hectare’. yea?
I <’ 5- 15
>$!S:‘$
:ii$;:;:;.;$;: 1-5 m ‘15
Fig. 3. Seasonal parterns of daytime resting predicted by the regression model. (A) Resting was concentrated on north-facing slopes during the warmer months (May-October). (B) Cool season (November-April) rest- ing was concentrated on south-facing slopes. Since resting occurs on dis- crete sites, these maps are actually probability distributions of resting activity.
south-facing slopes (Table 2). It was difficult to know if this was the fault of the models, the sparseness of the original derivation data, or the incompleteness of validation data. The seasonal resting models were derived fromdata sets containing 20 to 30 points each. The validation data on the other hand are incomplete in that observations for the coldest months, when use of the south-facing slopes should be maximal, were lacking. The validity of the
Table 2. Comparisons of observed and predicted behavior.
hoa . he&at-a“. year’
0 <’ 25-100
%;$;<py
j&E& l-25 m 100-150
Fig. 4. Pattern of bedding (nighttime resting) predicted by the regression model. Nighttime resting was correlated with a dtflerent set offactors than akytime resting and thus had a dinerent distribution in space. No season- ality was detected for nighttime resting.
bedding model could not be tested because observations of nighttime behavior were not available.
Since the record of cattle activities on the validation pasture was complete, a second means of testing the behavior models was needed. The spatial pattern of fecal deposition (Figure 5) was chosen because it is a summation of the patterns of excretion associated with each of the separate behavior modes (Lange and Willcocks 1978). A simple model of fecal deposition was con- structed by weighting each of the behavior models according to the annual mean time spent per day in each activity. Cattle spent approximately 12,4, and 8 hours daily in grazing -I- travel, resting, and bedding, respectively. In order to weight the models, the coefficients in each had to be normalized so that the total number of hours summed over all grid cells for each behavior mode equalled an arbitrary number such a 100. The normalized predic- tion for each cell for each behavior mode was multiplied by the mean daily time expenditure for that mode. The predicted fecal deposition for a given cell was the sum of the weighted, normalized behavior predictions. The resulting expected pattern offecal depo- sition is shown in Figure Sb. Comparison of observed and pre- dicted fecal deposition in each terrain type on the validation pasture (Table 3) revealed a very close fit.
Discussion
The foregoing described an exercise in which a series of regres- sion models constructed, each model describing the spatial pattern
Percent of activity
Grazing + travel Summer resting Winter resting Bedding
Terrain Ohs’ EXP Ohs’ Exp Ob? Rxp Obs’ Exp
Ridgetop 7 7 9 13 5 5 - 5
North-facing slope 14 16 46 41 0 4 - 9
South-facing slope 13 15 3 13 21 51 - 4
Lowland 66 63 42 33 74 40 - 82
Chi-square) 0.8261 11.99 54.55 -
lObserved behavior from Schwartz (1977). 2Data for September-October only.
Tabular value, 3 d.f., 0.01 level of probability = Il.34
a
b
count per hectare
Fig. 5. Validation of the spatial behavior models. (A) Distribution offecal pat densities measured on the validation pasture. (B) Pattern offecalpat densities predicted by the regression models. Each of the the behavior models was weighted by the average time spent doily in each activity. 7he sum of the time- weighted equations constituted thefecal excretion model.
of a mode of cattle behavior of an annual or roughly seasonal time scale. When these models were used to extrapolate behavior to another pasture, the predictions closely corresponded to past observation of cattle activities or with artifacts (fecal pats) of past animal distribution. A question which arises from this exercise is how applicable are these models to a wider range of situations?
One important mathematical property of the behavior models is boundlessness. Because of the mathematical form of each term, the models are theoretically independent of scale. The hyperbolic terms describing animal response. to certain topographic variables are asymptotic to a background level of activity represented by the
Table 3. Comparison of observed and predicted fecal deposition.
Fecal deposition (%)
Terrain Obs ExP
Ridgetop 4 6
North-facing slope 20 16
South-facing slope 17 16
Lowland 59 62
Chi-square’ 1.78
ITabular value, 3 d.f., 0.01 level of probability = 1 I.34
constant “b” in equation 1. The sinusoidal term describing animal utilization of different aspects necessarily varies within a narrow range. The linear term describing response to cactus frequency is constrained by the domain of the independent variable, which must lie between zero and 100%. Mathematically then, these mod- els can be applied to pastures of any size.
It should be noted, however, that the effects of herd structure and social interactions upon spatial behavior are lacking in both the derivation data and the models. This allowed us to predict the interactions of a small group of cattle with the environment, but the models may lack realism for large herds, where social influen- ces on dispersion may be as important as environmental influences. Thus the introduction of a complex herd structure may require altered or more complicated mathematical descriptions of spatial use. Radical changes in stocking rate may alter spatial patterns of use, particularly for grazing, and would also require an altered model. It is not clear whether modifications would merely entail changing coefficients of predictors already in the model or if predictors would have to be added or subtracted.
Since our models have been demonstrated to have some predic- tive value on a pasture other than the one used for their derivation, they are not bound by site. They probably are, however, vegetation type-specific and are perhaps even terrain-specific. Since regres- sion models tend to incorporate (and cattle seem to respond to) the most salient features of the local environment, a new set of equa- tions would have to be derived for a new vegetation type or an area with radically different topography. Similarly, if useful models are to be constructed, the area used to derive them must be representa- tive of the areas for which predictions are to be made.
A limitation of the behavior models presented here is that, while they are fine-grained in space, they are coarse-grained in time. The broad time scale undoubtedly had an impact upon which descrip- tors entered the models. The influences of daily, monthly, and seasonal fluctuations in climate and vegetation dynamics may have cancelled, leaving only topographic variables. It is quite possible that on a monthly or seasonal time scale plant species variables would emerge as important descriptors of grazing. On a finer time frame, daily or weekly temperature variations could have an effect upon the selection of resting or bedding sites, as well.
The broad time frame used in this exercise obscures another property of the regression models. Although they yield quantita- tive predictions of animal use of various locations, the models are best thought of as generating probability maps of animal use or location. This probabilistic property is seen more easily at a tine time frame, where animals would not be able to utilize the entire pasture in one time unit. A behavior map would then indicate areas most likely to be used. On an annual scale, however, reasonably accurate predictions of utilization can be obtained.
One of the most exciting potential applications of regression models of livestock behavior is the mapping of expected patterns of utilization on a large scale. Behavior modeling might be used as a tool in assessing the availability of forage resources or their usabil- ity. Effects of range improvements on extensive areas could be predicted before they are implemented. Data requirements for such projects would be large, but much of it would be readily available in the form of topographic maps and vegetation surveys. Another potential application is the assessment of carrying capacity of lands to be managed. Figure 2 suggests that as little as 3% of the pasture area received over 60% of cattle grazing use. If this is typical, then concepts of carrying capacity and utilization need to be defined around those areas that are actually utilized. Our regression models can identify those areas and provide esti- mates of extent of utilization, providing that intake and standing crop of the vegetation are known. However, since there may be an interaction between available herbage and degree of dispersion of cattle (Peterson and Woolfolk 1955, Dudzinski et al. 1982), grazing models would have to be derived at several stocking rates. It is probable that coefficients of some variables in the grazing model would change with animal density; at the highest densities, availa-
bility of forage would certainly be an important predictor of animal distribution.
The pronounced differences in grazing preference for different areas suggest another application: the investigation of foraging strategies. Regression models of grazing behavior can implicate environmental factors by which animals select preferred feeding areas. At a finer time scale than that used here, vegetation variables would probabaly be included in the grazing model. This informa- tion, coupled with information about diets, could lead to insights about the way in which animais seiect piants species for consump- tion, and perhaps, about strategies of nutrient ingestion in a limit- ing environment.
Literature Cited
Bement, R.E. 1968. Plains pricklypear: Relation to grazing intensity and blue srarna vield nn the Qn&x! ___- ~_____ ,____ _.. ____ Great Plains_ J; &xnne Manage, 21:83-86.
Clary, W.P., P.F. Ffolliott, and F.R. Lerson. 1978. Factors affecting for- aging consumption by cattle in Arizona ponderosa pine forests. J. Range Manage. 31:9-13.
Cook, C.W. 1966. Factors affecting utilization of mountain slopes by cattle. J. Range Manage. 19:200-204.
Dean, R.E., and R.W. Rice. 1974. Effects of fences and corrals on grazing behavior. Proc. West. Sec. Amer. Sot. Anim. Sci. 2556-57.
Jnmeson, D.A. 1969. General description of the Pawnee Site. US/IBP Grassland Biome Tech. Rep. 1. Colorado State Univ., Fort Collins. Lange, R.T. 1969. The piosphere: Sheep tractsand dung patterns. J. Range
Manage. 22:396-400.
Lange, R.T., and M.C. Willcocks. 1978. The relation between sheep-time spent and egesta accumulated with an arid zone paddock. Aust. J. Exp. Agr. Anim. Husb. 181764-767.
Low, W.A., M.L. Duddnski, and MJ. Muller. 1981. The influence of &?_-_.._ forage and ciimatic conditions on range ~ommurury prelcrcuoe of short- horn cattle in central Australia. J. Applied Ecol. 18: 1 l-26.
Malechek, J.C., and B.M. Smith. 1976. Behavior of range cows in response to winter weather. J. Range Manage. 299-12.
Mueggler, W.F. 1%5. Cattle distribution on steep slopes. J. Range Manage. 18:255-257.
Schwartz, C.C. 1977. Pronghom grazing strategies on the shortgrass prairie, Colorado. Ph.D. Diss. Colorado State Univ., Fort Collins.
0-.:___ -7 n *n-O C&Y,._.. _c -^._^--_... . . ..A *I.~~....:-^“~..* ^” ,.“:...,l iq”rrL%, . .n. “110. ~:I,~,> “1 ,l,a,la~~“lS1LL Ll,Ll L&IS CI,“II”LLLLILIII “11 _LLIIIlaI
dispersion under free range conditions. Proc. 1st. World Congr. Ethol. Appl. Zootech., Madrid.
Valentine, K.A. 1947. Distance from water as a factor in grazing capacity of rangeland. J. Forestry 45:749-754.
Membership in the Society for Range Management.
. .l is open
to those engcxpd
in or interested in the study. management,orus8ofr~ecosystemsandmintelligent use of all rmge mources
l includes research scienM. ran&m govmmentol --_a_. . --l-*-LLA~ ~A&_Am.*u,m.A.mur.rt
cJQullr;y uuTIIIIllsIIuI~s UN ,_"II_I poIau"lm, teochen.s~~andpeopletfomthe~
commurih/
l
provides membefswithtwo~mons-oneott-entsdtoresearch(Joumd
ofRmgeMmegement1
and fhe othm oriented
to pmctical resows mmagemd (Rmge/8ndS]
n offm oppodmities for face-to-face exchange d icJeclsatlocal.~l,andlntenratlonalmeetln9,
of the socie~.
Duesvoryoccordingtotypeofmembenhipand
-rmhiml -am FN dim(tn f- & rvc -‘upI IIVU. _“I._ . . . - -..vu.-. .-.m.u -- - diional infofmation, contact the:
ExeaJtbesecfe~ SocietvfaRangeV 2760 Wert Fifth A- Dmver.cdoiujO80206 (303]571-0174
DUES SCHEDULE Rcndar Studcnc Sustainina
Family
First +h
Emeritus Institutional Mcmbrl Additional ARlZONA ... .: s 43.00 s 22.00 s 64.00
CALIFORNIA ... 45.00 23.00 68.00
COLORADO ... 42.00 22.00 62.00
IDAHO ... 42.00 22.00 62.00
KANSAS-OKLAHOMA ... 43.00 22.00 62.00
MEXICO ... 44.00 24.00 64.cm
NEBRASKA ... 44.00 22.00 64.oll
NEVADA ... 42.00 22.00 62.00
NEW MEXICO ... 42.00 21.00 62.00
NORTHERN GREAT PLAINS. 45.00 25.00 65.00
INTERNATIONAL MNTN .... 43.00 23.00 63.00
PACIFIC NORTHWEST ... 45.00 25.00 65.00
SOUTH DAKOTA ... 44.00 23.00 63.00
SOUTHERN ... 45.00 25.00 65.00
FLORIDA ... 45.00 25.00 65.00 TEXAS ... 43.00 21.50 63.00 UTAH ... 43.00 23.00 63.00 WYOMING ... 43.00 22.00 63.00
NATIONAL CAPITAL ... 42.00 22.00 62.00
NORTH CENTRAL ... 42.00 22.00 62.00
UNSECTIONED ... 40.00 20.00 60.00
LIFE MEMBERSHIP--600.00 (INSTALLMENT PLAN-200 EACH YEAR