A Survey on Contour Mapping in Wireless
Sensor Networks
Umashankar M L, Dr.M.V.Ramakrishna
Assistant Professor, Dept. of CSE., SJBIT, Bangalore, India
Professor, Dept. of ISE., SJBIT, Bangalore, India
ABSTRACT:Contour mapping is one of the critical parts of many wireless sensor network applications. Many efforts have been made to avoid collecting data from all the sensors in the network and producing maps at the sink, which is proven to be inefficient. The existing approaches (often aggregation based), however, suffer from heavy transmission traffic and incur large computational overheads on each sensor node. Considering the challenge mentioned, this paper surveys a classification according to the architecture, approaches and techniques used in previous works. We present a variety of solutions to provide possible improvements to current solutions. This effort is done in order to provide guidelines for choosing the best solution approach to a specific scenario in which Power Optimization is required.
KEYWORDS: Wireless sensor network; Contour mapping; Event Detection; Monitoring; Diagnosis
I. INTRODUCTION
Recent advances in wireless communication and micro system techniques have resulted in significant developments of wireless sensor networks (WSNs). A sensor network consists of a large number of low-power, cost effective sensor nodes that interact with the physical world [1], [2], [3]. The increasing studies of wireless sensor networks aim to enable computers to better serve people by using instrumented sensors to automatically monitor the physical environment. Contour mapping has been widely recognized as one of the comprehensive methods to visualize sensor fields [4], [5], [6]. A contour map of an attribute (e.g., height) shows a topographic map that displays the layered distribution of the attribute value over the field. It often consists of a set of contour regions outlined by isolines of different isolevels.
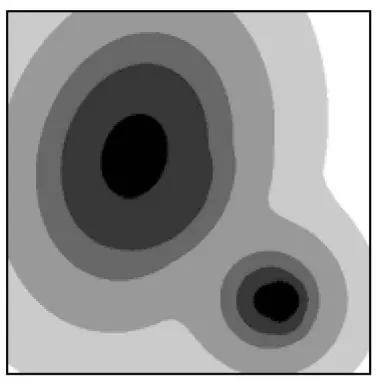
Fig. 1 plots a section of underwater depth measurement and the corresponding isobath contour map.
Fig. 1. Contour mapping.
(a) A section of underwater depth measurement and (b) the isobath contour map of (a).
II. TECHNOLOGIES
A : Iso-Map: Energy-Efficient Contour Mapping in Wireless Sensor Networks
A naive approach for contour mapping is to collect sensory data from all the sensors in the monitored field and then construct the contour map at the sink. Obviously, delivering a huge amount of data back to the sink incurs heavy traffic, which rapidly depletes the energy of sensor nodes. To address this problem, several aggregation based protocols have been proposed [7], [8], [9]. These protocols aggregate data with similar readings at intermediate nodes, reducing the traffic overhead up to 40 percent [8]. In order to address the inherent limitations of aggregation based approaches, an Iso-Map was proposed by Li, Mo, and Yunhao Liu [16]. By intelligently selecting a small portion of the nodes to generate and report data, Iso-Map is able to construct contour maps with comparable accuracy while significantly reducing network traffic and computation overhead. Although the basic idea beyond Iso-Map is comprehensible, several challenges exist in its design. For example, partial utilization of the network information reduces the network traffic, but naturally leads to the degradation of the mapping fidelity. Thus, careful node selection policies and an effective algorithm to recover the contour map from the partial information are necessary. We also need to balance the tradeoff between the traffic savings and the mapping fidelity. In addition, the aim is to avoid heavy computational overhead in the intermediate nodes so that the design is scalable for resource constrained sensor devices. The major contributions of this work are as follows:
A novel algorithm has been designed to construct contour maps from a critical set of nodes, which we call isoline nodes. By restraining the traffic generation within the isoline nodes, Iso-Map significantly reduces the network traffic while still constructing high-quality contour maps that are comparable to the best ones ever achieved through existing protocols. The analysis proves that, Iso-Map reduces the traffic generation from O(n) of existing protocols to O(√n), which substantially suppresses the traffic flows across the network.
A field study was done on a practical Iso-Map application, and based on the collected real world data, a trace-driven simulation was conducted, which confirms the superior performance of Iso-Map compared with existing protocols. Another strength of this design is that Iso-Map is orthogonal with many other designs, enabling further traffic savings to be achieved together with other approaches.
B: Contour Map Matching for Event Detection in Sensor Networks
Xue, Wenwei, et al. proposed a novel event detection mechanism based on matching the contour maps of in-network sensory data distribution[17]. The key observation is that events in sensor networks can be abstracted into spatio-temporal patterns of sensory data and that pattern matching can be done efficiently through contour map matching. Therefore, a simple SQL extensions was proposed to allow users to specify common types of events as patterns in contour maps and study energy-efficient techniques of contour map construction and maintenance for our pattern based event detection. In this method, the contour maps was described which is the building blocks of our pattern-based event specification. The approach to contour mapping is to construct and incrementally update a contour map hop by hop from bottom up in the network as a special kind of data aggregation [10][11][12], rather than collecting all sensor readings and transmitting them to a server (i.e., the base station) to construct the map centrally. The motivation is that, for current generation battery powered sensor nodes, power is the most limited resource and the communication cost on wireless radio channel is the dominating factor of power consumption. For instance, on the widely-used Crossbow MICA2 motes [13], the cost of transmitting a bit is about that of executing 1,000 instructions [14]. As a result, in-network contour mapping is more energy-efficient than a simple, centralized approach.
C: Contour maps: Monitoring and diagnosis in sensor networks
Meng, Xiaoqiao, et al proposed an efficient data-collection scheme that can be used for event monitoring or network-wide diagnosis[18]. This scheme relies on the well-known representation of data—contour maps, which trade off accuracy with the amount of samples. The scheme consists of three novel algorithms to build contour maps: distributed spatial and temporal data suppression, contour reconstruction at the sink via interpolation and smoothing, and an efficient mechanism to convey routing information over multiple hops. By reducing the number of transmissions required to convey relevant information to the sink, the proposed contour mapping scheme saves energy and improves network lifetime. In a sharp contrast to related work in this area, the scheme does not require all nodes to explicitly share information. The contour mapping scheme can be applied for tasks such as:
Presenting a global picture of the network in both temporal and spatial domains,
Being used as a diagnosis tool, e.g., to detect faulty sensors and to scan for residual energy,
Working in concert with in-network aggregation schemes to further reduce the communication overhead of aggregation schemes.
The proposed scheme imposes little processing and storage overhead, allowing for the sensor networking paradigm of ‘dumb sensor, smart sink’ which enables economical deployment of large-scale sensor networks. In this technique, the problem of monitoring and diagnosis for sensor networks is addressed with emphasis on applications that have a good degree of spatial correlation for monitored events. We seek to effectively monitor events covered by the sensor networks. We also examine the network health (e.g., the current energy level of sensors) and fault diagnosis (e.g., when part of the network are compromised by malicious attacks) issue, which is critical for a proper operation of sensor networks. There are four main challenges for an efficient monitoring and diagnosis design. First, an event may trigger widely varying readings at sensors spread over a large area. In many cases, it is desirable to have a global view of the entire sensor field regarding that single event, and to monitor the change on a temporal basis. For example, when fire bursts out in a building, it might be necessary to continuously monitor all the sensors to observe the spread of the fire and track its intensity. The second challenge is that a single digest (e.g., min, max, avg) may not be enough for describing an event. For example, multiple events can cause interference to create various highs and lows at points different from the actual event locations. Third, certain events are time-critical and we do not need readings from every sensor to respond to the event. It is more important for the sink to collect coarse-grained information on a timely fashion than fine-grained information with significant latency. In certain scenarios, it is critical to know approximately how far the fire spreads and react promptly. Lastly, sensor readings are affected by noise, and some sensors could even provide faulty readings. This requires the solution to be robust against faulty or noisy readings.
points with equal values. Neighboring contours have different values, and these values are separated by a pre-determined threshold. Contours can represent various events, such as altitude, temperature, concentrations, velocity, etc. In addition, a single map can represent various contours, where we can have altitude contours overlapping with concentration contours. In this technique, having an event contour of a sensor field can be extremely useful for monitoring and diagnosis tasks in sensor networks, while conveying event information in a reasonably accurate manner. The contributions here are twofold:
Two novel algorithms are proposed: a distributed spatial and temporal data suppression algorithm performed by individual sensor nodes, and a contour reconstruction algorithm performed by the sink,
A novel and efficient algorithm for conveying routing information that enables multi hop local suppression. The algorithm is based on the use of Bloom filter and the knowledge of geographic locations of sensor nodes.
III. CONCLUSION
This survey paper proves that Contour mapping can be widely used in wireless sensor networks and that this research area is in a high activity phase. It surveyed a big set of systems and applications for Contour map, and described the major challenges and evaluating metrics of wireless sensor networks. As the industry provides smaller and feature-rich sensor nodes, to evolve these small bodies, turning their use as natural as cloth wearing. The scalability of Iso-Map is superior, which makes Iso-Map feasible for the large-scale deployed sensor networks. it will be of great benefit to utilize Iso-Map to construct contour maps over the sensor network in order to monitor the siltation instead of hiring boats that constantly cruise over the sea area, as is currently done. A number of energy-efficient techniques were proposed for in-network contour mapping, including a linear regression based criterion for contour region merging, two techniques for size reduction of the partial map transmitted by a node, and an incremental update scheme. It greatly saves the network traffic in comparison with an existing equal-width bucket based approach and a server-side approach with contour map matching. Wireless sensor networks hold great promises for monitoring the environments and providing timely samples of unusual events or the network itself. Moreover, diagnosis of faulty and energy-depleting sensors is critical to the health of the sensor network. Current solutions are unable to simultaneously achieve the goals of adaptive and timely sampling, robust monitoring, at low communication cost. In this survey paper, the contour maps to effectively balance between these different goals was seen. The solution allows for progressive sampling of the field, and efficient local suppression of data. The algorithms to perform in-network data suppression along both spatial and temporal dimensions was devised. Also algorithms on how to using interpolation and smoothing to reconstruct contours at the sink was described. The design can be applied in many scenarios, including spatial–temporal event monitoring, residual energy monitoring and faulty sensor detection. Simulation results confirm the effectiveness of the solution in terms of data reduction, accuracy and energy savings.
REFERENCES
1. B. Gedik, L. Liu, and P.S. Yu, “ASAP: An Adaptive Sampling Approach to Data Collection in Sensor Networks,” IEEE Trans. Parallel and Distributed Systems, vol. 18, no. 12, pp. 1766-1783, Dec.2007.
2. HongT. He, J.A. Stankovic, M. Marley, C. Lu, T. Abdelzaher, S.H. Son, and G. Tao, “Feedback Control-Based Dynamic Resource
Management in Distributed Real-Time Systems,” Proc. IEEE Real-Time Systems Symp. (RTSS), 2001.
3. M. Li and Y. Liu, “Underground Coal Mine Monitoring withWireless Sensor Networks,” ACM Trans. Sensor Networks, vol. 5, no. 2,
article 10, Mar. 2009.
4. J.M. Hellerstein, W. Hong, S. Madden, and K. Stanek, “Beyond Average: Toward Sophisticated Sensing with Queries,” Proc.IEEE/ACM
Information Processing in Sensor Networks (IPSN), 2003.
5. M. Li, Y. Liu, and L. Chen, “Non-Threshold Based Event Detection for 3D Environment Monitoring in Sensor Networks,” IEEE Trans.
Knowledge and Data Eng., vol. 20, no. 12, pp. 1699-1711, Dec. 2008.
6. A. Mainwaring, J. Polastre, R. Szewczyk, D. Culler, and J.Anderson, “Wireless Sensor Networks for Habitat Monitoring,”Proc. ACM
Int’l Workshop Wireless Sensor Networks and Applications (WSNA), 2002.
7. X. Meng, T. Nandagopal, L. Li, and S. Lu, “Contour Maps: Monitoring and Diagnosis in Sensor Networks,” Proc. Computer Networks,
2006.
8. W. Xue, Q. Luo, L. Chen, and Y. Liu, “Contour Map Matching For Event Detection in Sensor Networks,” Proc. ACM SIGMOD, 2006. 9. Y.J. Zhao, R. Govindan, and D. Estrin, “Residual Energy Scan for Monitoring Sensor Networks,” Proc. Wireless Comm. and Networking
Conf. (WCNC), 2002.
13. Crossbow Inc. www.xbow.com
14. Madden, S., Franklin, M. J., Hellerstein, J. M., and Hong, W.The design of an acquisitional query processor for sensor networks. SIGMOD, 2003.
15. Contour Map. http://en.wikipedia.org/wiki/Contour_map.
16. Li, Mo, and Yunhao Liu. "Iso-map: Energy-efficient contour mapping in wireless sensor networks." Knowledge and Data Engineering, IEEE Transactions on 22.5, 699-710, 2010
17. Xue, Wenwei, et al. "Contour map matching for event detection in sensor networks." Proceedings of the 2006 ACM SIGMOD international conference on Management of data. ACM, 2006.
18. Meng, Xiaoqiao, et al. "Contour maps: Monitoring and diagnosis in sensor networks." Computer Networks 50.15: 2820-2838, 2006
BIOGRAPHY
Umashankar M L is an Assistant Professor and Research Scholar in the Computer Science and Engineering Department, SJBIT, Visvesvaraya Technological University (VTU), Karnataka, India. He received Master of Technology (MTech) degree in 2004 from NIE, Mysore, VTU, Karnataka, India. His research interests are Computer Networks (Wireless Sensor Networks), Algorithms, Databases etc.