PHILLIPS, MAKITA RACHELLE. Effect of Alternative Insulation Materials on Quench Propagation in ReBa2Cu3Oδ-7 Coils. (Under the direction of Dr. John Strenkowski and Dr. Justin Schwartz).
ReBa2Cu3Oδ-7 (REBCO) coils have the potential to impact a variety of magnet
applications but due to slow normal zone propagation velocity (NZPV), quench detection and
protection remain difficult. It is therefore important to understand how quench behavior is
affected by various aspects of coil design, geometric considerations and material properties.
Although past studies have explored the effects of varying the conductor properties, it is
important to investigate the influence of insulation as well.
In this study, the effect of insulation properties on three-dimensional (3D) quench
propagation in REBCO-based coils is investigated. At present, superconducting magnets
primarily use insulators that are electrically and thermally insulating; typically Kapton. Here
the impact of electrically insulating, thermally conducting insulators on quench behavior was
studied. In particular, the behavior of a Kapton insulated coil was compared to doped-TiO2
and ideal Al2O3 insulated coils. A non-insulated coil was also evaluated. Using a
mixed-dimensional model the effect of various insulation materials on multiple quench parameters
in REBCO coated conductor coils was studied. The comparison of the usage alternative
insulation was conducted for a 20 µm and 100 µm case using three models: Concept Model 1,
2 and 3. Concept model 1 studied the effects on 3D propagation behavior, including the 3D
stresses were observed at the cleavage edge, middle height and along the conductor width in
the central conductor. Concept model 3 (CM 3) determined the thermal stresses based upon
the thermal development of CM 1 during a quench.
Concept model 1 found that ideal Al2O3 insulation resulted in the highest MQE,
lowest peak temperature, slowest rate of increase in hotspot temperature, fastest transverse
NZPV and smallest CSV. These results indicated that increasing the thermal conductivity of
coil insulation can significantly improve coil behavior. Concept model 2 found that
doped-TiO2 and ideal Al2O3 had the most desirable effect by having the most compression within
the conductors. The compression present during cool down could lessen the effect of tension
during operation. CM 3 showed that NI has less tensile variation between the REBCO layers
and could be helpful so that stress is distributed evenly to reduce stress concentrations.
Doped -TiO2 had the lower stress values for each insulation thickness. The lower stress is
\
by
Makita R. Phillips
A dissertation submitted to the Graduate Faculty of North Carolina State University
in partial fulfillment of the requirements for the degree of
Doctor of Philosophy
Mechanical Engineering
Raleigh, North Carolina
2014
APPROVED BY:
_______________________________ ______________________________ John Strenkowski Justin Schwartz
Committee Co-Chair Committee Co-Chair
DEDICATION
Thomas, Jelline, Gwen, Extended Family, Friends (LC, DIVAS and others), NSBE Family.
BIOGRAPHY
ACKNOWLEDGMENTS
I would like to thank my committee, Dr. Schwartz, Dr. Strenkowski, Dr. Peters and Dr. Saveliev. Thank you for your support and assistance. I would like to especially thank Dr. Schwartz for believing in me and agreeing to serve on both Masters and Doctoral committee. Thank you for supporting me and providing great mentorship !
I would like to thank my family for pushing me at times when I felt tired. I thank them for trusting me and allowing me to initiate and continue this journey. I couldn’t have done it without you all. I love you so much for letting me be “me”.
Thank you to my friend for letting me go away. I appreciate that you all let me be myself but still push me to greatness.
J-Rock, you are missed. I remember when I prematurely decided to go this route. You were the first to encourage me to go and I know you are looking down on me proud. You are always in my heart, brother. Thank you for being one of my angels.
To my NSBE family: The love, mentorship, role models…I can’t even begin to express how much it means to me. The peer pressure to succeed is strong and I’m glad to feel it. I will continue “to increase the number of culturally responsible Black engineers who excel academically, succeed professionally and positively impact the community”.
TABLE OF CONTENTS
LIST OF TABLES ... vii
LIST OF FIGURES ... viii
Chapter 1 BACKGROUND ... 1
1.1 Critical Values ... 2
1.1.1!Critical!Temperature!...!3!
1.1.2!Critical!Magnetic!Field!...!4!
1.1.3!Critical!Current!...!5!
1.2 Common High Temperature Superconductors ... 6
1.2.1!Bi2Sr2Can<1CunO2n+4+x!(BSCCO)!...!7!
1.2.2!YBa2Cu3O7<d!!(YBCO)!...!7!
1.3 Cooling Methods ... 8
1.4 Quench ... 9
1.5 Applications ... 11
1.5.1!Power!Grid!Components!...!11!
1.5.2!Magnet!Technology!...!12!
1.6 Purpose of Study ... 14
Chapter 2 LITERATURE REVIEW ... 16
2.1 Quench ... 17
2.1.1!Quench!Initiation!and!Propagation!...!17!
2.1.2!Quench!Detection!and!Protection!...!19!
2.2 Mechanical Behavior ... 21
2.3 Insulation Techniques ... 23
2.4 Superconductor Modeling and Simulation ... 25
2.4.1!Analytical!Modeling!...!25!
2.4.2!Finite!Element!Modeling!(FEM)!...!28!
Chapter 3 METHODOLOGY ... 30
3.1 Overview ... 30
3.1.1!Geometry!...!31!
3.2 Governing Equations ... 39
3.2.1!Straight!Hybrid!Coil!Model!...!40!
3.2.2!Pancake!Coil!Model!...!44!
3.3.1!Concept!Model!1:!Quench!Propagation!...!45!
3.3.2!Concept!Model!2<!Thermal!Stress!(Cool!Down)!...!60!
Chapter 4 RESULTS AND DISCUSSION ... 67
4.1 Concept Model 1: Quench Propagation Model ... 67
4.1.1!Minimum!Quench!Energy!(MQE)!...!70!
4.1.2!Hotspot!Temperature!...!70!
4.1.3!Normal!Zone!Propagation!Velocity!(NZPV)!...!74!
4.1.4!Current!Sharing!Volume!(CSV)!...!75!
4.1.5!Temperature!Profiles!...!83!
4.1.6!Discussion!...!86!
4.2 Concept Model 2: Thermal Stress (Cool Down) ... 93
4.2.1!Radial!Stress!...!95!
4.2.2!Hoop!Stress!...!101!
4.2.3!Discussion!...!107!
Chapter 5 CONCLUSION ... 111
BIBLIOGRAPHY ... 114
APPENDICIES ... 122
APPENDIX A-Temperature-Dependent Material Properties ... 123
APPENDIX B-Additional Current Sharing Volumes at t = 0.4 , 1.0 and 2.0 s ... 134
APPENDIX C-Radial Stresses for Conductor Interlayers ... 140
APPENDIX D-Matlab code for Current Sharing Volumes ... 147
APPENDIX E-Concept Model 3- Thermal Stress (Dynamic Quench) ... 151
AE.1!Interlayer!REBCO!layers!for!the!Insulation!Models!...!151!
AE.2!The!REBCO/Buffer!Interface!for!each!Insulation!Model!...!155!
AE.3!Discussion!...!159!
LIST OF TABLES
Table I Straight Hybrid Coil Model Dimensions ... 36
Table II Pancake Coil Model Dimensions ... 39
Table III Model Parameters for Concept Model 1 ... 46
Table IV Concept model 1 Boundary Conditions ... 51
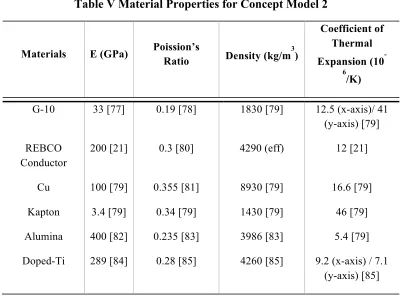
Table V Material Properties for Concept Model 2 ... 60
Table VI Concept Model 2 Boundary Conditions ... 62
Table VII Concept Model 3 Boundary Conditions ... 65
Table VIII MQE (J ) ... 70
Table IX Hotspot Temperature Rate for the 20 µm and 100 µm Insulation Models (K/s) ... 71
Table X Hotspot Temperature for the 20 µm and 100 µm Insulation Models (K) ... 72
Table XI Normal Zone Propagation Velocity for the 20 µm and 100 µm Insulation Models ... 74
Table XII CSV% for the 20 µm and 100 µm Insulation Models at t = 0.4 s ... 75
Table XIII Average CSV% rate for the 20 µm and 100 µm Insulation Models for 2 s . 76 Table XIV Radial Coordinates for Concept Model 2 ... 94
Table XV Maximum Radial Stress at Cleavage Edge ... 97
Table XVI Maximum Radial Stress at Middle Height ... 99
Table XVII Maximum Radial Stress in Central Conductor ... 101
Table XVIII Maximum Hoop Stress in Central Conductor ... 107
Table XXI Maximum Radial Stress on REBCO Layers at t = 2 s ... 155
LIST OF FIGURES
Figure 1.1 Resistivity of Mercury vs. Temperature [1] ... 1
Figure 1.2 Meissner Effect [2] ... 2
Figure 1.3 Critical Surface [3] ... 2
Figure 1.4 Timeline of Tc discovery [4] ... 4
Figure 1.5 HC vs TC for Type I and Type II Superconductors [5] ... 5
Figure 1.6 Damaged REBCO Conductor Tape ... 10
Figure 1.7 Comparison of Copper and Superconducting Wire [5] ... 12
Figure 2.1 Schematic of a SuperPower Inc. 2G HTS REBCO Coated Conductor [21] . 19 Figure 2.2 Quench protection Methods (a) Shunt Resistor Circuit (b) Dump Resistor Circuit (c) Heater Placement ... 21
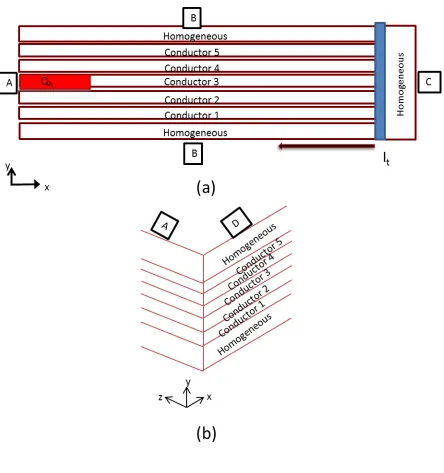
Figure 3.1 (a) Y-Z cross section of the surround stabilizer REBCO coated conductor tape with insulation added. (b) Turn-to-turn configuration schematic of a straight hybrid coil. Conductor 3 is sandwiched between four conductors and the homogeneous sections. Qh represents the heater. V and T represent the locations of the voltage and temperature taps used in the simulations. The subscript for each tap displays the conductor number and its x-axis location (in centimeters). The left boundary represents the center of a full-length tape i.e. axis of symmetry. Cooling is applied to the top, bottom and right boundaries of the homogeneous section with heat transfer coefficients hb and he ,defined in table III . ... 34
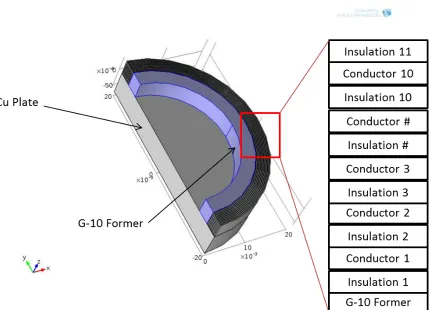
Figure 3.2 Pancake Coil Geometry. This is a half view of cut along the Y-Z plane. The Cu plate is the bottom cylinder, the coil (conductor/insulation) is the outer portion on top of the Cu plate, and the G-10 former is the inner solid portion. The Coil details are listed in the callout, where # is used to represent the insulation and conductors 4-9. .... 38
Figure 3.3 Diagram of Theory Incorporation ... 40
Figure 3.6 Conductor meshing (a) discontinuous mesh (b) continuous mesh ... 52
Figure 3.7 Mesh size sub node window and mesh statistics ... 54
Figure 3.8 Convergence Plot for High Error Model ... 56
Figure 3.9 Segregated Solver Operation Process ... 57
Figure 3.10 Orthogonal View of Pancake Coil Model ... 61
Figure 3.11 Location of Stress Measurement for Concept Model 2 ... 64
Figure 4.1 Effective Thermal Conductivity (a) Longitudinal (along the conductor) (b) Transverse (turn-to-turn). The properties were calculated for the YBCO CC and the insulation model. ... 68
Figure 4.2 Effective Heat Capacity with (a) 20 µm insulation (b) 100 µm insulation ... 69
Figure 4.3 Hotspot temperature vs. time (a) 20 µm insulation (b) 100 µm insulation. The 20 and 100 µm insulation models were evaluated using Q = 0.497 J and Q = 0.551 J, respectively. ... 73
Figure 4.4 CSV% vs. Time for (a) 20 µm insulation (b) 100 µm insulation ... 77
Figure 4.5 Two Dimensional CSV for (a) Kapton (b) Doped-TiO2 at t = 0.4 s, 1.0 s and 2.0 s for 20 µm insulation ... 79
Figure 4.6 3D normal zone for (a) 20 µm insulation. Each volume is observed at t = 0.4 s. The x-coordinate corresponds to the longitudinal length of the tapes and the y-coordinate corresponds to the transverse length across the turns. The z-y-coordinate corresponds to the axial length of the coil. The left boundary (x= 0 mm) for each CSV corresponds to the symmetric end of the model. The 20 µm and 100 µm insulations were evaluated using Q = 0.497 J and Q = 0.551 J, respectively. Note that color bars are different for each set of graphs. ... 81
Chapter 1 BACKGROUND
Since its discovery, superconductivity has evolved into an important aspect of modern science. In 1911, Hennes Kammerlingh Onnes discovered that DC resistance in mercury decreased to zero as the temperature was reduced to 4.2 K.
Figure 1.1Resistivity of Mercury vs. Temperature [1]
Figure 1.2 Meissner Effect [2]
1.1 Critical Values
1.1.1 Critical Temperature
Tc distinguishes between a low temperature superconductor (LTS) and a high temperature superconductor (HTS). Until 1986, the highest !! observed was 23 K. Beginning in 1986, the discovery of oxide superconductors led to a rapid increase in!!!. Many oxide
Figure 1.4 Timeline of Tc discovery [4]
1.1.2 Critical Magnetic Field
Superconductors, when exposed to sufficiently high magnetic fields return to the normal state. The critical magnetic field (Hc) is where the transition to the normal state occurs. Type I superconductors are defined as materials that experience perfect diamagnetism below !! and are typically comprised of mainly one element. Type II superconductors have two critical magnetic fields, a lower critical field!!!, and an upper
!!!!that allows partial magnetic flux penetration. The partial magnetic flux
penetration creates areas that are normal while other areas remain superconducting. Figure 1.5 displays each state for type I and II superconductors.
Figure 1.5 HC vs TC for Type I and Type II Superconductors [5]
1.1.3 Critical Current
foreshadows a high Jc. The mixed state facilitates high Jc but it can also undermine the Jc.
The mixed state is made possible by the ability of magnetic flux to penetrate the superconductor in the form of vortices or fluxoids. As the applied magnetic field increases, the number of fluxoids increases. Without flux pinning, the fluxoids travel within the superconductor and increase the resistance. Fluxoid movement can be reduced or eliminated using flux pinning. Flux pinning allows superconductors to have high Jc because the current is still conducted with penetration compared to type I where any presence of magnetic field will return it to a normal state. Fluxoids are usually pinned by including lattice defects
during material processing. Jc for commercial applications are typically between 107-1010!!!.
Flux pinning allows superconductors to have high Jc
1.2 Common High Temperature Superconductors
superconductors are based upon REBCO materials and have increased benefits with higher
operating temperature and magnetic field and cost [86].
1.2.1 Bi2Sr2Can-1CunO2n+4+x (BSCCO)
BSCCO was discovered by H. Maeda et al. in 1988. BSCCO has various
stoichiometries that exhibit different critical temperatures, with; Bi2212 and Bi2223 being
the most common. Bi2212 has a critical temperature of ~80-90 K and Bi2223 has a critical
temperature of 110 K[6] .
The processing of BSCCO to form wires and tapes is very involved and usually use
the “powder in tube” method. In this approach, the powder-in-tube method, the BSCCO
powder is input into a cylindrical silver or silver alloy billet and drawn. The filaments created
are stacked, combined and rolled into a tape or drawn into a wire. The deformed tape or wire
is heat treated to form the finished product [7, 8]. Bi2223 is a candidate intended power
transmission lines, while Bi2212 is primarily used for low T, High H applications.
1.2.2 YBa2Cu3O7-d (YBCO)
The most popular REBCO material is yttrium barium copper oxide (YBCO). YBCO
was discovered by Wu et al. in 1986. YBCO powder experiences much of the same process
undergoes additional heat treatments to deliver desired superconducting performance [7]. The material properties of YBCO force it to be made into thin films. Attempts have been made to develop YBCO in wire form. However grain boundaries and alignments produce a low Jc and brittleness in all occurrences [9]. Thin films have thicknesses ranging from µm to nm.
1.3 Cooling Methods
In 1908, the development of liquefied helium provided the opportunity for the
discovery of superconductors. Today, superconducting materials are cooled using various
methods. The cryogenic region ranges typically from 4.2 K to 120 K [10]. The main techniques involve immersion or conduction-cooling. Immersion cooling submerges the superconductor in super cooled liquids known as cryogens. The main cryogens used are liquid helium and liquid nitrogen. Liquid helium (LHe) is used for operating temperatures of 4.2 K and Liquid nitrogen (LN2) is used for operating temperatures of 77 K. The conduction-cooled technique uses a device called a cryocooler. A cryocooler contains a cold head where the superconducting configuration is attached and then vacuum pumped down before operation. Optimal cooling methods vary upon desired application.
1.4 Quench
conductor causes a rise in resistance in a small area, forcing this area normal. Then, joule heating, if sufficient, leads to a rise in temperature of this area. If the conductor continues operation and the hotspot continues to grow, thermal runaway can develop. Thermal runaway occurs when the temperature of a normal zone continues to grow. The high temperatures can degrade a conductor if the temperature reaches values that are beyond the safe operating limits.
Figure 1.6 Damaged REBCO Conductor Tape
attributed to flux jumps, AC loss due to current redistribution and heat leakage from current leads and heat conduction from measurement probes. More details on stability and quench are provided in chapter 2.
!
1.5 Applications
1.5.1 Power Grid Components
considerable amount to go before they completely replace copper wires as the standard.
Figure 1.7 Comparison of Copper and Superconducting Wire [5]
Global energy demands continue to increase the importance of energy storage
technology. Superconducting magnetic energy storage (SMES) is mainly used in electric
storage but can be used for other systems. Power grid systems can use it for load leveling,
ensuring power quality and increasing system stability. A SMES system typically consists of
a superconducting magnet, switch and an AC/DC inverter/converter. High magnetic field
strength enables high energy storage. This increases the desire to develop compact magnets
1.5.2 Magnet Technology
Superconducting magnets (SM) serve in many capacities within the energy, medical, transportation and other sectors. Their flexibility has made their adoption in various areas attractive.
Within energy research, SM have allowed researchers to explore previously unattainable areas. High energy physicists utilize magnets to direct and confine particle beams in accelerators. The introduction of SM presented the possibility to obtain higher energy. The most famous accelerator is known as the Large Hadron Collider (LHC) at CERN. The LHC was developed to “generate conditions that existed approximately 20 billionths of a second after the Big Bang” [13] . Fusion reactors are also expanding with the introduction of superconducting magnets. Reactors use magnets to contain the plasma where the energy is generated for power generation. Many types of fusion reactors exist but currently the community focus is on the International Thermal Energy Reactor (ITER). ITER is a fusion reactor designed and under construction using international collaboration. Upon completion it will be the largest in the world. It uses a combination of toroidal, poloidal and solenoid magnets. Assembly is set to begin 2015 and first plasma is set for 2020.
magnetometer known as a superconducting quantum interference device (SQUID). MRI uses
magnetic fields and radiofrequencies to develop images of the body. Once a SM is charged, it
will continue to circulate current and produce a magnetic field. This operation is known as
persistent mode. Persistent mode is a main reason that SM are used in the majority of MRI
systems.
The transportation sector also has developed several uses for SM technology.
Magnetic levitation vehicles (MAGLEVs) incorporate the magnetic properties to propel a
vehicle along a track. They are used in public transit in Germany and Japan. Germany uses
the electromagnetic system (EMS) where the attractive forces between magnets makes the
train float away from the track. Japan uses the electro dynamic system where repulsive forces
pushed the train to float above the track. In addition to public transportation, SM has been
developed for motors and generators. Traditional motors use copper windings. However,
superconductors can be used to replace these windings creating a more compact, quieter and
cheaper alternative. These motors are typically used for large-scale application on ships and
within factories [14] . The generators are desired for wind turbines.
1.6 Purpose of Study
Superconductivity continues to permeate a variety of fields by creating new
applications and expanding previous discoveries. This drives the need for increased stability
while accounting for rising costs. The usage of HTS results in lower cooling cost but has yet
application dependent but the concern here lies with quench development in magnets.
Magnetic applications explained above utilize coil configurations. A typical coil
configuration consists of winding a conductor (superconductor with additional layers) and an
insulation material. Typically insulation materials are dielectric and thermally insulating. The
dielectric component prevents current sharing between wound layers. In this study, usage of
thermally-conducting, dielectric insulation materials is investigated to understand their effect
on quench development in REBCO coils. In Chapter 2, previous research is explained.
Chapter 3 will explain the design and simulation followed by chapter 4 where the results and
analysis are discussed. Finally, Chapter 5 will summarize the findings and explain future
Chapter 2 LITERATURE REVIEW
Superconductors are characterized by their electrical, thermal, structural and magnetic
response during operation. In this study, the magnetic effects are excluded and the focus is
placed upon the electrical, thermal and structural correlations to quench behavior. Various
coil models were developed to simulate conductor behavior during quench initiation and
propagation. The evaluation of quench initiation and propagation is a determinant in
appropriate quench detection and protection methods. In addition to evaluating quench
response, it is important to investigate the mechanical behavior. When operating a
superconducting coil, three major mechanical response events occur: cool down, Lorentz
forces, quench. These events can affect the stability of the superconducting coil. Lorentz
forces are attributed from magnetic forces and will not be investigated in this study due to the
exclusion of the magnetic effects and because they do not directly impact quench behavior.
Here the effect of insulation selection on quench behavior is evaluated using common
parameters. The models are designed and simulated in a computational format to allow
customization. The optimization of model design and simulation design was determined from
gaining a complete understanding of quench, mechanical behavior, insulation material and
2.1 Quench
2.1.1 Quench Initiation and Propagation
Quench can arise when an area of the conductor is disturbed. Some disturbances can include
large heat input, rapid charging/discharging, material defects or delamination [15, 16] .
Thermal stability within a coil is defined by its ability to recover to the superconducting state
if disturbed. The stability quantified as the minimum quench energy (MQE), the minimum
amount of input energy necessary to induce quench. The MQE can be defined using equation
(1)
!"#≅ !"# !!! ! !!"
!!"
!!!! (1)
where !! is the critical temperature, !!" is the operating temperature, ! ! is the
temperature dependent specific heat and !"# is the minimum propagation zone[17] . The
!"# is the smallest area size that can initiate a quench in a conductor or configuration. The
MPZ can be approximated using equation (2)
!"# ≅! 2!(!!!!−!!") !!
!/! (2)
where ! is the thermal conductivity,!! is the density and !! is the critical current density. The
for determining the NZPV is the voltage criterion. The NZPV can be calculated as
!"#$ =!!−!!
∆! (3)
where !!is the first location where the voltage observed is equal to the voltage criterion,!!! is
Figure 2.1 Schematic of a SuperPower Inc. 2G HTS REBCO Coated Conductor [21]
Primarily, conductors are utilized at long lengths and in a coil format. Therefore, it is
important to understand quench propagation within REBCO coils to improve their stability
and performance. Many studies have been conducted to increase the understanding of
quench propagation in REBCO coated conductors and insulated conductor configurations
[18-20, 22-54]. To develop better protection methods it is imperative that the effects of coil
configurations on quench behavior is understood.
2.1.2 Quench Detection and Protection
Quench detection methods include voltage taps, thermocouples and the non-uniform
normal operation the voltage is zero. When a disturbance occurs, a voltage rise is
observed. A threshold voltage is set based upon the conductor type and application. When
this voltage is reached, it is determined that quench is occurring and a protection method
should be enacted. Thermocouples are used to monitor temperature rises. LTS are less stable
because their MQE is lower and quench propagates faster making it easier to detect a quench.
Developments are continually being made to compete with LTS. For coils, typical detection
arrangements utilize voltage taps or thermocouples. A novel method monitors the current in
each coil layer. During normal operation the current in each layer remains uniform. When a
quench is occurring, the layer where it developed will have a lower current. A non-uniform
current indicates a quench [49].
Quench protection is important to reduce probability of superconductor destruction.
For applications that use superconductors for energy storage, if a quench is not mitigated the
release of the large amount of energy could have detrimental effects. The main protection
methods are passive or active. Passive methods are typically incorporated into the initial
application and require no monitoring. Self-protection assumes the conductor will recover
without additional assistance. This requires more consideration during the conductor or coil
design phase. Recovery can occur by altering the architecture or changing materials. Shunt
resistors are another form of passive protection. The resistors are connected to the conductor
in parallel. In superconducting operation, the current flows through the conductor, bypassing
the resistor. In normal operation, the current flows through the resistor around the normal
joule heating. Active methods require activation from a monitor. Dump resistors are
similar to shunt resistors but they are connected in series. Once quench is detected, the switch
on the circuit is opened and the energy is “dumped” to the resistor. Heaters are also used as
an active protection method. Heaters are placed at various locations on the coil. When a
quench is detected, the current is shut off and the heaters are activated, increasing the
temperature of the entire coil. This reduces the focus of a single hot spot. Quench protection
methods are continually evaluated and updated to reflect application demands.
Figure 2.2 Quench protection Methods (a) Shunt Resistor Circuit (b) Dump Resistor Circuit (c) Heater Placement
2.2 Mechanical Behavior
The mechanical behavior of a coil is an important component when investigating
quench behavior. Stability is not only affected by quench but also the mechanical behavior
become coils, stresses result from winding, cool down and quenching. Tension is
used during coil winding and adds stress to the conductor. This stress is increased during cool
down due to thermal stresses. Thermal stress can occur due to coil cool down and quenching.
Thermal stresses occur due to the thermal expansion of the different coil constituents, such as
the conductor, insulation and epoxy, that results in compressive and tensile stresses [55].
Coils can be built using a single conductor or multiple conductors connected using lap joints.
The effect of stress increases for lap joints compared to the conductor. Coils with lap joints
can handle axial loading up to 100 MPa [56]. The nature of coil development and operation
deem a thorough investigation of the mechanical behavior and how it affects desired
outcomes.
Stress is expected during a coil life cycle but when threshold values are exceeded issues
arise. Excessive stress can lead to a reduction in critical current (Ic) [57-63]. Ic degradation
occurs when the Ic is less than 95% of the original Ic [62]. Some REBCO conductors have
strong mechanical properties in the longitudinal directions. SuperPower has observed an
irreversible stress-strain limit of ~0.6% before Ic degradation. Ic degradation can be caused by
stresses, which can lead to crack formation and/or delamination [55, 58, 59, 62-64]. The
crack size and delamination can significantly influence the Ic [59, 60, 63]. Cracks and
delamination can develop due to a combination of multiple stresses. Cracks develop in the
REBCO layer and delamination tends to occur at the buffer layer and substrate interface [55,
56]. Delamination occurs when the axial stress exceeds the bonding strength of the
when conductors are slit [55, 61]. Cracks and delamination can develop due to stresses
during winding and thermal stresses. Tension during winding should be managed to avoid
crack development. Coils are usually epoxy impregnated to improve mechanical strength
[65]. However, it increases coil radial stress during curing and cool down [55]. SuperPower
has identified four key technologies that should be adopted to reduce radial stress for
epoxy-impregnated coils [58].
• A thin former release layer removes the mechanical bond between the coil and the
coil former
• Partial epoxy impregnation and determination of the proper winding tension
• Alternative insulations such as metal strips to increase the mechanical strength of the
conductor
• Insulation can reduce radial tensile stress by providing a weak bond between the
insulation and conductor
Thus it important to understand the mechanical contribution of the proposed insulation
materials in addition to their effect on quench propagation.
2.3 Insulation Techniques
Coil properties, specifically insulation material, have a major impact on quench
behavior. The main properties investigated regarding insulation concepts affect the electrical
thermal conductivity and/or thickness of the insulation layers. These properties helped spawn
the incorporation of non-traditional materials, coatings and inserts [33-35, 66-69].
High thermal conductivity for insulation materials is one of the main proposals to
increase the NZPV for HTS. Traditionally, the insulation between conductors is a dielectric
to prevent current sharing between neighboring turns, but they also tend to have low thermal
conductivity. However, insulation materials with low thermal conductivity can decrease
stability because of the ease to initiate a normal zone [87]. Various considerations for the
thermal conductivity of insulation materials has been suggested to increase coil stability The
typical insulation, Kapton, can be replaced with diamond, sapphire (Al2O3 ) or ZnO to
increase NZPV [70]. Insulations with higher thermal conductivities have been proven to
increase the transverse propagation velocity compared to using traditional materials [47].
Though diamond and ZnO have higher thermal conductivities, they were excluded from this
study. Diamond and ZnO have the ability to switch from being a dielectric to an electrically
conductor. Diamond decreases in thermal conductivity with increasing thickness. It also has a
significant drop of thermal conductivity at 77 K. A preliminary mixed dimensional model
was developed to incorporate a thermally-conducting insulation. This insulation increased the
transverse propagation in YBCO coils [67].The results prompted another study that
developed and experimentally evaluated BSSCO and YBCO coils using a thermally
conducting insulation [33] . It was determined that by adjusting the insulation properties
within REBCO superconducting magnets, an improved quench detection environment
seemed promising based upon previous results. The results prompted the investigation of
additional parameters associated with quench to assist in protection and detection.
An important aspect of coil design is the engineering current density (Je), the amount
of transport current per conductor cross-sectional area. It is important to have a high ratio of
superconductor to supporting materials to increase the magnet packing factor and thus
self-field. This translates to smaller and more powerful magnets. Thinner insulation increases
thermal diffusion and also increases the Je. Thin insulation (~4 µm) can increase transverse
propagation and increase the overall current density [69]. “Good thermal response” was
found using a UV-cured epoxy insulation system to coat the conductors or steel co-winding
tapes using a sol-gel process [66].
Insulation concepts have been expanded to consider electrical and thermal behavior.
In addition to reducing radial stress, copper inserts have been used to reduce heating and
temperature increase in the normal zone by providing a current bypass. Using a copper insert,
a higher MQE was observed for the conductor with the stainless steel substrate than the
conductor with the copper substrate [35]. Non-insulated (NI) coils are increasing in
popularity due to high thermal conductivity and current sharing that reduces peak
temperatures and increases transverse normal zone propagation [10, 34, 35, 71]. For DC
applications, this approach may be desirable, but for AC applications more investigation is
necessary. AC applications are classified by their AC losses and charging and discharging
discharging of NI coils displayed time delays, which could be an issue for fast ramping DC
applications like energy storage and fault current limiters [71, 73].
2.4 Superconductor Modeling and Simulation
2.4.1 Analytical Modeling
Conductor models use a variety of methods to explain their behavior. Models using
analytical methods are prevalent and are used in tandem with experimental efforts. The
Universal Scaling Theory, an analytical method, was used where scaling parameters can be
developed for material properties and cooling parameters [74]. This model was verified
experimentally but showed numerical deviation in the threshold thermal current. It showed
that when the conductor size is increased, the threshold thermal current could become less
than the reported critical current. Analytical models have been used to comprehend and
explain anomalies in experimental results [38]. Using a 2D current density relationship with
the potential difference
!! =−!!−!! !!
(4)
and assuming an ohmic relationship between the superconductor and the substrate, the 2D
Helmholtz equation is developed
(6)
where !! is the current density between the superconductor and and n = 1(copper stabilizer)
or 2 (metal substrate), !! is the resistance between the superconductor and stabilizer or
substrate, κ is the inverse of λ, λ is the current sharing length and d is the layer thickness.
The Helmholtz equation (5) shows the relationship between potential difference and current
sharing length in the stabilizer and substrate (6). Due to material properties the current
sharing lengths in the stabilizer and substrate are not equal, resulting in varied current sharing
lengths in the superconductor. The superconductor experiences a current sharing length
dependent on the boundary sharing between stabilizer or substrate [38].
(7)
This relationship helped explain the electric field distribution, observed experimentally, in
the substrate to the current sharing length. For copper stabilized YBCO conductors, a circuit λn = dn Rn
ρn
#
$%
&
'(
1/2Λn = RnJc
model was used to determine the hot spot temperature during a quench. Using the
determined temperature, the amount of copper to decrease the TH max below a threshold value
was determined with a known initial critical current, Ic0 and the energy dump constant, τ
[75]. Breschi et al. theorized the non-equipotential behavior of the conductor during a
quench. The non-equipotential behavior affects the NZPV and quench detection. The
understanding that layer architecture affects this behavior lends to more understanding of the
importance that contact resistance presents for faster detection [25].
2.4.2 Finite Element Modeling (FEM)
Further models focus on quench development using analytical and FEM methods,
where some FEM models are the primary tools unlike before. A study on using ANSYS1 as a “proof of principle” tool, in which the authors suggested its potential as a tool for studying
NZP and aiding in detection development, may have sparked this transition [26]. A 1D model
was developed to model quench induced by a heater. The MQE and NZPV were parameters
of interest and gave results similar to measured values. Though temperature development
wasn’t a priority for this model, it justified the usage of 1D for electrical behavior [22].
Earlier models used the full thickness of each layer, conductor homogeneity or reduction in
element order to investigate quench development [26, 35].
A mixed-dimensional model used a 3D-2D Ag-Bi2223 coil to represent the thermal behavior
as 3D and the electromagnetic as 2D. The temperature distribution in the resulting model
demonstrated the need for a 3D modeling because of its circular geometry and heat
placement [27].
An approach using FEM software COMSOL Multiphysics2 was developed and
quenching was simulated in a large racetrack coil. This served as an initial test of COMSOL
as a tool capable of handling quench development and analysis [40]. With further
development, it was also used to determine the influence of contact resistances on quench
propagation [28]. The usage of mixed-dimensional FEM was developed to investigate the
influence of interlayer contact resistances. A mixed-dimensional model was developed to
address the high-aspect ratio for the YBCO, buffer and silver layers [6]. The model
maintained the accuracy of a full thickness model with a reduced computation expense. This
model was used with varying electrical contact resistance for the silver and buffer layers. It
was determined that a larger contact resistance results in a longer current sharing length and
that an increased NZPV does not necessarily relate to a lower peak temperature. The
developments in the previous studies led to the investigation of the effect of conductor
architecture on these matters.
!!!!!!!!!!!!!!!!!!!!!!!!!!!!!!!!!!!!!!!!!!!!!!!!!!!!!!!!!!!!!
Chapter 3
METHODOLOGY
In this chapter the various methods are developed for each concept model and
explained including the corresponding geometry. The governing equations are expressed as is
the implementation in COMSOL Multiphysics. The development for each concept model is
outlined using COMSOL terminology.
3.1 Overview
Quench propagation is affected by a litany of inherent design, fabrication and
assembly factors. Therefore, it is important to investigate the influence of insulation on
specific areas of concern. Concept models are developed to understand the effects of
alternative insulation methods on three areas that determine the stability of coil
configurations: quench propagation and thermal stress.
• Concept Model 1 (CM1) - Quench Propagation Model
• Concept Model 2 (CM2) - Thermal Stress (Cool Down)
• Concept Model 3 (CM3) - Thermal Stress (Dynamic Quench)
CM1 simulates the connection between the electrical and thermal behavior of a coil.
The thermal stress models (CM2 and CM3) combine the thermal and structural behavior of a
coil for different scenarios. CM2 includes the conduction cooling of a coil. CM3 determines
of the effects of alternative insulation materials on important aspects of coil
operation. The insulation materials investigated include Kapton, doped-TiO2 [33] and ideal
Al2O3. It is important to capture the responses using the appropriate modeling techniques.
Improper physics assignments, mesh development, etc., affect the accuracy. All models are
developed using COMSOL Multiphysics, a commercial FEM software chosen because it
allows the coupling of the necessary physics to develop the models described above.
3.1.1 Geometry
Geometric configurations are important for determining the correct response in
comparison to actual operation or experimental data. Two model-specific geometries are
used for simulation. CM 1 and 3 simplify the modeling process by incorporating a straight
hybrid coil representing a section of a pancake coil. CM3 uses a pancake coil “wound” on a
former that sits on top of a Cu cooling plate used in cryocooler. COMSOL has four levels of
geometric elements in the 3D space: subdomain, boundary, edge and point.
3.1.1.1 Straight Hybrid Coil Model
The straight hybrid coil model combines homogenous and multilayer sections. A
straightened coil is a good approximation of a pancake coil with respect to the electrical and
thermal behavior during a quench. The multilayer section is embedded in the homogenous
sections. The embedded multilayer tape section consists of five layers of micrometer-scale
coated conductor (CC) tape models, each being inserted between a top and bottom insulation
in the model. The high-aspect ratio of conductors increases the difficulty of FEM with
respect to meshing of thin layers. Thin layers can be difficult to mesh because the small
element size can be difficult to converge resulting in inaccurate, time-consuming simulations.
The mixed-dimensional approach is utilized to mitigate this issue while also reducing
computational time and maintaining reducing accuracy. This method is adopted from [14]
and serves as the building block for these models. In the tape model, the Cu stabilizer,
Hastelloy substrate and solder are modeled as 3D layers while the thin film REBCO layer is
modeled as a 2D layer. The thin silver and buffer layers are modeled as thermally and
electrically contact layers with fixed contact resistances. The conductor referenced in this
study is the Superpower SCS3050. A schematic is currently unavailable for SCS3050 but the
schematic in fig. 2.1 of SCS4050 is similar and differences are referenced in [21] .
The coarse scale homogeneous section is designed to represent the rest of the turns
within the coil and is used as a thermal mass to mimic cooling behavior. The homogeneous
section enclosed the multilayer tape model except at the symmetric end. The symmetrical
thermal and electrical behavior allowed model reduction by developing a symmetrical
quarter of the coil (half of the coil length and tape width). A heat pulse is generated by a
symmetrical-half heater located at the symmetric end of the center CC tape (conductor 3) to
initiate a quench within the model. The heater is incorporated into the top Cu layer of the
central conductor. The conductor geometry and coil configuration details are displayed in
Fig. 3.2. The schematic of the coil configuration in Fig. 3.2b provides an overall concept
dimensions and parameters. Insulation thickness for a typical CC ranges from ~4 µm
to 160 µm. The CMs implemented insulation of thicknesses of 20 µm, 100 µm, and a
non-insulated (NI) coil. Since a NI coil can be viewed as a coil with very thin insulation it is
!
Figure 3.1 (a) Y-Z cross section of the surround stabilizer REBCO coated conductor tape with insulation added. (b) Turn-to-turn configuration schematic of a straight hybrid coil. Conductor 3 is sandwiched between four conductors and the homogeneous
sections. Qh represents the heater. V and T represent the locations of the voltage and temperature taps used in the simulations. The subscript for each tap displays the conductor number and its x-axis location (in centimeters). The left boundary represents
the center of a full-length tape i.e. axis of symmetry. Cooling is applied to the top, bottom and right boundaries of the homogeneous section with heat transfer coefficients
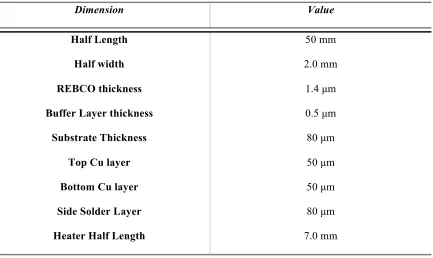
Table I Straight Hybrid Coil Model Dimensions
Dimension Value
Half Length 50 mm
Half width 2.0 mm
REBCO thickness 1.4 µm
Buffer Layer thickness 0.5 µm
Substrate Thickness 80 µm
Top Cu layer 50 µm
Bottom Cu layer 50 µm
Side Solder Layer 80 µm
Heater Half Length 7.0 mm
3.1.1.2 Pancake Coil Model
The pancake coil model is developed to understand the structural behavior during a
cool down (CM2). This model consists of 10 CCs separated by 11 insulation layers. The
pancake coil is wound on a G-10 former, a common former material. The coil and former are
placed on a Cu plate used in a cryocooler. In contrast to the detail of the straight coil model,
the conductor is treated as a laminate and effective material properties are calculated. The
important aspects here investigate the structural relationship between the insulation and the
behavior reduced the modeling requirements to half of the pancake coil. Fig. 3.2 displays the
Figure 3.2 Pancake Coil Geometry. This is a half view of cut along the Y-Z plane. The Cu plate is the bottom cylinder, the coil (conductor/insulation) is the outer portion on top of the Cu plate, and the G-10 former is the inner solid portion. The
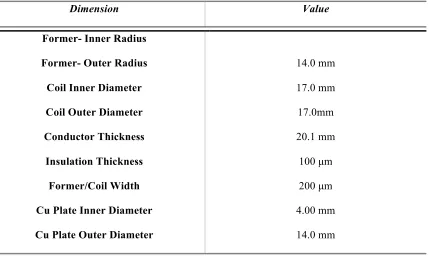
Table II Pancake Coil Model Dimensions
Dimension Value
Former- Inner Radius
Former- Outer Radius 14.0 mm
Coil Inner Diameter 17.0 mm
Coil Outer Diameter 17.0mm
Conductor Thickness 20.1 mm
Insulation Thickness 100 µm
Former/Coil Width 200 µm
Cu Plate Inner Diameter 4.00 mm
Cu Plate Outer Diameter 14.0 mm
3.2 Governing Equations
The governing equations used for the entire study incorporate electrical, thermal and
structural theory. The basics for CM 1and 3 use the electrical and thermal theory. Derivations
include additional physics to correspond with model designation. CM 3 uses thermal and
structural theory. The governing equations in subsequent sections are displayed according to
Figure 3.3 Diagram of Theory Incorporation
3.2.1 Straight Hybrid Coil Model
The hybrid modeling approach requires appropriate equations to capture the
mixed-dimensional structure and relationships. The referenced physics are assigned according to fig.
3.4 to create CM 1 and 3.
3.2.1.1 Electric Currents and Heat Transfer Physics
Superconductor operation is based upon the electrical and thermal relationship.
Quench initiation within a conductor requires the inclusion of these physics in the model.
These models compare the quench behavior under a DC transport current in the absence of
an applied field or self-field. Hence, according to [4], Maxwell equations for the electrical
Concept!
Model!1!
Electrical!
Thermal!
Concept!
Model!2!
Thermal!
Structural!
Concept!
Model!3!
Electrical!
Thermal!
component of the conductor model become
∇⋅ −σ! T ∇V =0 for Ωα (1)
!=σ! T ! for Ωα (2)
!= −∇V for Ωα (3)
where V is the electric potential, T!is the absolute temperature, !is the current density, σ! is the electrical conductivity, !is the electric field, and Ωα is the computation subdomain. Here
α represents copper, nickel or REBCO. The thermal equation for the 3-D domains is
ρ! T C! T ∂T
∂t +∇⋅ −k! T ∇T = !⋅!≡Q(T) for Ωα (4)
where ρ! (kg/m3) is the density, C! (J/kg-K) is the specific heat, k! (W/m-K) is the thermal
conductivity. Here, Q (T), on the right side of the equation is the joule heating, which is
generated by current sharing during a quench.
The high-aspect ratio of the REBCO layer allows the usage of 2-D physics. The thermal
d!!ρ! T C! T ∂T
∂t −d!∇!⋅ k! T ∇!T =
d!!Q!+k!
d! T!"! −T! +
k!
d! T!"!−T!
for Ωα (5)
and the electric physics is also approximated as
d!∇!⋅ σ! T ∇!V = σ!
d! V!"! −V! + σ!
d! V!"! −V! !!! in!Ω!(6)
whereT=(1 d!) !!!T!dz!, V= 1 d! !!!V!dz!,∇!!is the 2-D tangential operator. The
subscripts y, S and b represent the YBCO, silver and buffer layers, respectively, and!d!,d!
and d! are the thicknesses of the YBCO, silver and buffer layers, respectively. The electrical
conductivity, σ! , for REBCO is derived from the !−! power law as
σ! !,T =J!(T) ! !!!
!
Ec!! (7)
where !! = 10-4 V/m is critical electric field criterion and n is the !−!power law index.
The temperature dependent critical current density is
J! T = J!" !!!!! !!!!
!
0
′ if!T<T!!! (8)
Here, J!" is the critical current density at the operating temperature, T! , T! is the critical
temperature β and is the power index for the !−! relation. Further implementation details of
the CC tape and hybrid coil models can be found in previous work [76].
3.2.1.2 Solid Mechanics Physics
The solid mechanics physics is used to examine the effect of alternative insulation
materials on thermal stress within the coil configuration. The SM physics treats the model as
a quasi-static linear elastic model. In COMSOL, the Duhamel-Hooke law is used to relate the
stress tensor to the strain tensor and temperature.
0 : ( 0 * )
s s= +C
ε ε
− −α
Θ (9)where s is the strain tensor, C is the 4th order elasticity tensor, “:” is the scalar product, α is
the thermal expansion tensor, Θ = T-Tref, s0and ε0 are the initial stress and strain,
respectively. The strain tensor is the total strain tensor
1
( )
2
T
ε = ∇u+∇u (10)
where ∇u is the Lagrangian displacement with respect to material coordinates. The
x xy xz
xy y yz
xz yz z
ε ε ε ε ε ε ε ε ε ε " # $ % =$ % $ % & ' ;
x xy xz
xy y yz
xz yz z
s s s
s s s s
s s s
! " # $ =# $ # $ % & ;
x xy xz
xy y yz
xz yz z
α α α α α α α α α α " # $ % =$ % $ % & '
respectively. This also allows the elastic tensor to be represented as
1111 1122 1133 1112 1123 1113 11 12 13 14 15 16
1122 2222 2233 2212 2223 2213 12 22 23 24 25 26
1133 223 13 23 33 34 35 36
14 24 24 44 45 46
15 25 25 35 55 56
16 26 26 36 56 66
D D D D D D C C C C C C
D D D D D D C C C C C C
D D D D D D C C
D
D D D D D D
D D D D D D
D D D D D D
! " # $ # $ # $ =# $= # $ # $ # $ # $ % &
3 3333 3312 3323 3313
1112 2212 3312 1212 1223 1213
1123 2223 3323 1223 2323 2313
1113 2213 3313 1213 2313 1313
C C C C
C C C C C C
C C C C C C
C C C C C C
! " # $ # $ # $ # $ # $ # $ # $ # $ % &
where C is the elasticity matrix. For an isotropic material, the elasticity tensor becomes
1 0 0 0
1 0 0 0
1 0 0 0
1 2
0 0 0 0 0
2
(1 )(1 2 )
1 2
0 0 0 0 0
2
1 2
0 0 0 0 0
2 E D ν ν ν ν ν ν ν ν ν ν ν ν ν ν − # $
% − &
% &
% − &
% &
−
% &
= % &
+ − % &
−
% &
% &
% − &
% &
' (
(11)
where E is Young’s modulus, ν is Poisson’s ratio. The dependent variable u is determined
using the principle of virtual work, δW =0where W is
0 0
1
( ) : : ( )
2 s
3.2.2 Pancake Coil Model
The pancake coil model uses the thermal stress physics. COMSOL designed this
physics to combine the heat transfer and solid mechanics physics. Equations 4 and 12 are the
governing equations. The coefficient of thermal expansion is what couples the two equations.
The two dependent variables are T and u, where T is used as input to determine u. 3.3!Model!
Development
In these sections, each concept model is explained. The main sections include general
model definitions, subdomain and boundary setting, mesh development, solver settings and
post-processing. However, due to the commonality of some model areas, some sections are
absent but mentioned.
3.3.1 Concept Model 1: Quench Propagation
Multiphysics Designations: Electric Currents and Heat Transfer physics (refer to section 3.2.1.1)
3.3.1.1 General Model Definitions
In COMSOL, a user can define global definitions to be recalled throughout the
model. The first section defines certain model parameters that are used to build the geometry,
assign material properties, and provide heater and current inputs. Geometric model
parameters can be seen in table I. The parameters in table III account for material properties
Table III Model Parameters for Concept Model 1
Parameter Value
n-value 21
β 1
Critical Temperature 92 K
Heat Transfer Coefficient at top and bottom,
hb 5 W/m
2
-K
Heat Transfer Coefficient at right end, he 100 W/m2
-K
Silver layer electrical conductivity 108
S/m
Silver layer thermal Conductivity 500 W/m-K
Buffer layer electrical conductivity 10-1
S/m
Buffer layer thermal conductivity 0.1 W/m-K
Analytical functions are defined using symbolic expressions that do not require explicit
input, allowing flexibility when changing variables. This function is used to create the
current and heater inputs. The analytic functions use a smoothed Heaviside step function.
Figure 3.4 Analytical functions for (a) current input and (b) heater input
The dynamic thermal behavior within these models requires temperature-dependent
material properties. The thermal conductivity, electrical conductivity and heat capacity
temperature-dependent material properties are used for Cu, YBCO, Hastelloy C276, ideal
Al2O3, Kapton and doped-TiO2. The temperature-dependent material property data is input
using interpolation functions. Each property is interpolated as a piecewise cubic function to
increase the accuracy of the data fit. The values are extrapolated using the nearest function
value. The material property data can be found in Appendix A.
Scalar Variables
The implementation of the mixed-dimensional model requires the manual input of
equations for the YBCO layer. Equations (4) and (7) are input into the variables node listed
under the definitions node for model 1. The previously mentioned parameters are used to
conductor to have a corresponding set of equations.
The separate distinction of each conductor is an asset for solving and during post
processing. The dynamic behavior of the model resulted in large thermal variance within the
overall model. The separate distinctions decrease the variance to the conductors resulting in
easier convergence. Post-processing allows the user to recall various results using separate
variables. This can be advantageous when trying to determine the correct values between two
adjacent boundaries when selection is unclear.
Domain Point Probes
Domain point probes (DPPs) record the desired variable at a specified point. The
probe locations are documented in Fig. 3.1b. DPPs serve in a multiple capacities. The
temperature probes are the equivalent to thermocouples used in an experiment. During a
simulation run, the temperature probe monitors the hotspot temperature to determine if a
quench is occurring. After a simulation, the probes are also for post processing of the
temperature behavior. The voltage probes are used to emulate voltage taps. For example,
voltage tap V3_2.5-1.5 is the voltage difference between probes V3_2.5 and V3_1.5. The voltage
taps are used to determine for model-specific post-processing.
Identity Pairs
In this model, identity pairs connect two boundaries and project the behavior of the
and silver layers and to ensure continuity. As mention previously, the buffer and silver
layers are simulated using contact resistance equations. Identity pairs can be created
manually or automatically when rendering the geometry. Each pair has an identifier for
intra-model designations. For example, buffer and Ag layers could be created using identity pair if
REBCO is a subdomain. When two subdomains have adjacent boundaries, an identity pair
can be created and designated as a contact resistance pair. However, the use of different
geometric elements (subdomain and boundary) and physics requires that weak contributions
be implemented to assign the contact resistance between the REBCO and corresponding
boundary of a subdomain. In COMSOL, weak contributions are used to customize the model
by assigning equations that are not available. Continuity between separate insulation layers
is designated using identity pairs and settings that set the source and destination boundaries
equal.
3.3.1.2 Subdomain and Boundary Settings
The current conservation sub node in the electric currents physics is used to assign the
material properties of the 3D layers (Cu, Hastelloy, and solder). The heat transfer in the
solids sub node in the heat transfer physics is used to assign the material properties to the 3D
layers (Cu, Hastelloy, solder, and insulation). The heat source sub node is used to incorporate
joule heating from the electric current physics. The weak contribution, boundary sub node is
used to create the Ag and buffer layers for both physics. It is also used to create continuity
Table IV Concept model 1 Boundary Conditions
Boundary Electrical Condition Heat Transfer Condition
A Ground (V = 0) Symmetry (−!∙ −!!!T =0)
B Electrical Insulation (−!∙! =0) Inward Heat Flux, hb
C Electrical Insulation (−!∙! =0) Inward Heat Flux, he
D N/A Symmetry (−!∙ −!!!T =0)
Inner Boundaries Continuous Thermal Insulation
Buffer and Ag Pairs
Contact Resistance Contact Resistance
3.3.1.3 Mesh Development
Mesh development is a basic component of FEM. The mesh must be continuous to
ensure convergence and the solution from node to node of different layers. The following
precise meshing procedure is followed for each model.
1. The REBCO layer of the central conductor is meshed using a free triangular
mesh
2. That mesh is copied to the additional REBCO layers
3. Layer mesh copying is repeated until all layers are meshed
A comparison of the discontinuous mesh versus a continuous mesh is displayed in fig.3.7.
The continuous model mesh is completed using this method
Figure 3.6 Conductor meshing (a) discontinuous mesh (b) continuous mesh
Node placement, mesh element size and density are important for determining the
accuracy of a model. Nodes capture the desired solution at that location. It is important to
place nodes in the correct locations to have a complete solution and limit the amount of
interpolation between nodes. The mesh element size determines how many nodes, their
placement and mesh density. Large elements have a lower amount of nodes and decreased
density. Mesh sensitivity is determined by varying these specific areas
Mesh sensitivity can be determined using two main methods: mesh refinement and
convergence plot determination. Mesh refinement is a built-in tool that systematically
reduces the mesh element size to reduce the error in the model based upon the computational
amount of error in a model as a function of the timesteps or iterations of the model. While the
mesh refinement tool is the ideal solution, the size of model required the use of convergence
plots to determine the mesh sensitivity. The meshing procedure requires that the element size
be dictated by the thickness of the layers even though the REBCO layer is meshed first. The
tetrahedral elements have to be small enough to adequately fit within the layer without
producing an error in COMSOL but large enough to reduce memory usage. Due to previous
experience and the base conductor model used for the overall coil configuration, it has been
determined that the best maximum element size is 1.5 x 10⁴ m. This maximum element size
restriction is placed on the REBCO layer that is initially meshed. This restriction allows the
usage of various element sizes automatically chosen based upon specifications placed on
edges within the model. The dynamic nature of this model requires increased density for the
conductors. Mesh size and density can be changed by using the “size” sub node in the mesh
Mesh statistics
Property Value Minimum element
quality 8.75E-4 Average element quality 0.525 Tetrahedral elements 384042 Triangular elements 231838 Edge elements 31842 Vertex elements 236
![Figure 1.3 Critical Surface [3]](https://thumb-us.123doks.com/thumbv2/123dok_us/1377985.1170484/15.612.226.403.76.187/figure-critical-surface.webp)
![Figure 1.4 Timeline of Tc discovery [4]](https://thumb-us.123doks.com/thumbv2/123dok_us/1377985.1170484/17.612.138.494.72.324/figure-timeline-of-tc-discovery.webp)