Comparison between K- Means and
Hierarchical Algorithm on the Basis of
Normalization
Shruthi Sasi Nair 1, Okstynn Rodrigues 2, Amey J. Shenvi Khandeparkar 3
M.E. Student, Department of Information Technology, PCC Engineering College, Agnelganv, Verna Goa, India1
Asst. Professor, Department of Information Technology, PCC Engineering College, Agnelganv, Verna Goa, India2
Asst. Professor, Department of Computer Engineering, PCC Engineering College, Agnelganv, Verna Goa, India3
ABSTRACT: Normalization is the technique used to give all attributes equal weights. This is done to make them closer. Common Normalization technique used is Z-Score. This method preserves the range. The proposed work uses normalization by Z-Score to compare k-means and hierarchical algorithms.
KEYWORDS: Hierarchical, K-Means, Normalization, Z-Score
I. INTRODUCTION
Clustering is the process of separating the set of data objects into subsets. Similar objects fall in one cluster and different object fall in other clusters. This process is called clustering. [1]
K-Means uses centroid to separate objects into clusters resulting into sets of k clusters. The quality is measured by within cluster variation. It selects randomly center. Based on the center, clusters are placed by calculating the Euclidean distance between them. It iteratively improves the assignment of center by computing new mean until they are stable. [2]
Hierarchical method basically decomposes the given data set. They produce a sequence which results into a tree of clusters called as dendogram. The process begins by assigning data to cluster that is if you have N datasets, you are likely to have N clusters. The next step is to compute the distance between new cluster and old cluster. Repeat these until you get all data into number of clusters. [1]
Normalization is the technique used to all attribute equal weights. Z-score is a commonly used normalization technique. We compare these algorithms by finding the results for normalized data. [3]
II. RELATED WORK
The recent work represents query redirection method that shows that k-mean algorithm perform better as compared to hierarchical algorithm and takes less time for execution. On the other hand, hierarchical algorithm provides good quality results. This work was done on the basis of performance parameter but we have analysed that our proposed work on the two method using normalization and the results are concluded based on two measures that is the entropy and the covariance. [2]
III.CLUSTERING ALGORITHMS
A. K-Means
Step 1
Randomly choose k objects from datasets as initial center.
Step 2
Repeat (step2)
Reassign each object in cluster with closest center.
Step3
Update the center, that is calculate mean for each cluster.
Step 4
Do this until there is no change in the observation. [2]
B. Hierarchical Clustering Algorithm
The hierarchical clustering is categorized by agglomerative or divisive based on decomposition type. Decomposition type can be top down or bottom up.
Agglomerative follows bottom up approach. It starts by taking each object at a time and merging them to get larger clusters. This is done till you are left with single cluster or until certain conditions are met.
Divisive follows top down approach. It starts by taking all objects in the cluster which forms a root. At each step it divides the clusters into various subsets. This continues till you are left with single object.
In either of the methods, user can specify the terminating condition.
The proposed work uses agglomerative method for proving the results [1, 3].
Normalization
Normalization is used to assign equal weights to each attributes. These are done to get all value in one range. Commonly used normalization technique is Z-Score normalization also known as Zero score normalization.
The value of A is normalized using the mean and standard deviation of A. The new value vi’ is obtained by using following expression:
A i i
A
v
v
'
(1)
WHERE Ā AND
A ARE THE MEAN AND STANDARD DEVIATION OF ATTRIBUTE A, RESPECTIVELY.[2]IV.EXPERIMENTAL RESULTS
In this we have taken dataset for yeast type. The dataset consist of 1000 records which is normalized using z-score formula. The data clustered in case of k-means is eight clusters and in case of hierarchical its one clusters. The clustering is done using solver for excel which takes the input as datasets and display the results accordingly.
i) Calculation of entropy of k-means and hierarchical
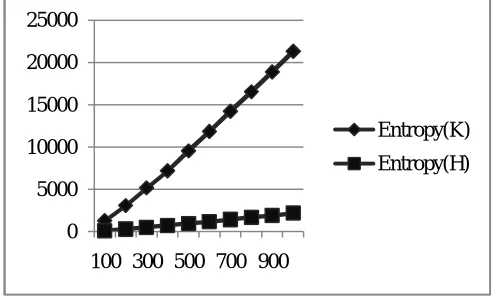
Table 1. Entropy for K-means and Hierarchical after Normalization of Dataset
NO OF
RECORD Entropy(K) Entropy(H)
100 1288.06322 123.8105
200 3085.06919 299.4254
300 5180.18666 500.401
400 7195.96541 727.315
500 9557.16349 958.6935
600 11852.3853 1182.559
700 14241.7633 1433.852
800 16560.8392 1702.218
900 18903.8331 1922.919
1000 21345.7094 2186.643
The graph shows that entropy keeps on increasing as the number of records increases. K-means provides good quality of clusters after normalization.
Figure 1.Graphical Representation of Entropy for K-means and Hierarchical after Normalization of Dataset
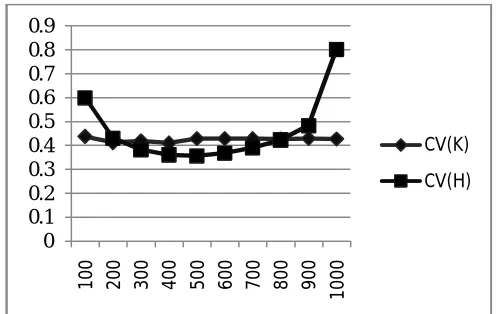
ii) Calculation of covariance of k-means and hierarchical algorithm
The covariance measure is used to check how closely the two algorithms are related to each other. The positive value represents the positive relationship between the data.
0 5000 10000 15000 20000 25000
100 300 500 700 900
Entropy(K)
Table 2. Covariance for K-means and Hierarchical after Normalization of Dataset
NO OF
RECORD CV(K) CV(H)
100 0.437772 0.598617 200 0.41149 0.429305 300 0.419254 0.381002 400 0.409974 0.360701 500 0.428671 0.355851 600 0.428551 0.367636 700 0.428224 0.389289 800 0.426522 0.42296 900 0.429265 0.482779 1000 0.427341 0.801378
The graph below shows the positive relationship to large extent. The covariance value of k-means linearly increases with the given dataset.
Figure 2: Graphical Representation of Covariance for K-means and Hierarchical after Normalization of Dataset
V. CONCLUSION AND FUTURE WORK
The proposed work represents normalization of data method which was used to compare k-means and hierarchical algorithm. In this we have done analysis on k-mean and hierarchical algorithm by applying validation measures like entropy and covariance. The result shows that k-means clustering by normalization is far better than hierarchical.
REFERENCES
[1] Jiawei Han and Micheline Kamber,”Data Mining: Concepts and Techniques”, Morgan Kaufmann Publishers, Third Edition, 2011.
[2] Manpreet Kaur and Usvir Kaur, “Comparison between K-Means and Hierarchical Algorithm using Query Redirection,” International Journal of Advanced Research in Computer Science and Software Engineering, vol. 3, Issue 7, July 2013.
[7] Garima Sehgal and Dr. Kanwal Garg, “Comparison of various Clustering Algorithm”, Interbal Journal of Computer Science and Information Technology, vol.5 (3) 2014.
[8] Sovan Kumar Patnaik, Soumya Sahoo and Dilip Kumar Swain, “Clustering Of Categorical Data by assigning Rank through Statistical approach”, International Journal Of Computer Application, vol.43-no.2, April 2012.
BIOGRAPHY
Shruthi Sasi Nair is a Student in the Department of Information Technology at Padre Conceicao College Of Engineering-Verna-Goa-India
Ms Okstynn Rodrigues is an Assistant Professor in the Department of Information Technology at Padre Conceicao College of Engineering-Verna-Goa-India.
Her teaching interests include Software Development and Frameworks, Project Management and Software Testing, Bioinformatics, Modern Algorithm design Foundation, Data structures using Information Technology.
Mr. Amey Jagadish Shenvi Khandeparkar is an Assistant Professor in Computer Engineering Department at Padre Conceicao College Of Engineering- Verna-Goa-India.