5
F
orests cover a vast area of the United States: 304 million ha, or approximately one-third of the Nation’s land area (Smith and others 2009). These forests possess substantial ecological and socioeconomic importance. Both their ecological integrity and their continued capacity to provide goods and services are of concern in the face of a long list of threats, including insect and disease infestation,fragmentation, catastrophic fire, invasive species, and the effects of climate change.
Assessing and monitoring the health of these forests are critical and challenging tasks. The complexity of these tasks is reflected in the Criteria and Indicators for the Conservation and Sustainable Management of Temperate and Boreal Forests (Montréal Process Working Group 1995), which the Forest Service, U.S. Department of Agriculture, uses as a forest sustainability assessment framework (USDA Forest Service 2004, 2011). Although the concept of a healthy forest has universal appeal, forest ecologists and managers have struggled with how exactly to define forest health (Teale and Castello 2011), and they have not agreed on a universally accepted definition.
Most definitions of forest health can be categorized as representing an ecological or a utilitarian perspective (Kolb and others 1994). From an ecological perspective, the current understanding of ecosystem dynamics suggests that healthy ecosystems are those that are able to maintain their organization and autonomy over time while remaining resilient to stress (Costanza 1992) and that evaluations of forest health should emphasize factors that affect the inherent processes and resilience of forests (Kolb and others 1994, Raffa and others 2009, Edmonds and others 2011). On the other hand, the utilitarian perspective holds that a forest is healthy if management objectives are met, and that a forest is unhealthy if not (Kolb and others 1994). Although this definition may be appropriate when a single, unambiguous management objective exists, such as the production of wood fiber or the maintenance of wilderness attributes, the definition is too narrow when multiple management objectives are required (Edmonds and others 2011, Teale and Castello 2011). Teale and Castello (2011) incorporated both ecological and utilitarian perspectives into their two-component definition
CHAPTER 1.
Introduction
Forest Health Monitoring
6
Chapter 1
of forest health. First, a healthy forest must be sustainable with respect to its size structure, including a correspondence between baseline and observed mortality, and, second, a healthy forest must meet the landowner’s objectives, provided these objectives do not conflict with sustainability.
This national report, the 12th in an annual series produced by the Forest Health Monitoring (FHM) Program, attempts to quantify the status of, changes to, and trends in a wide variety of broadly defined indicators of forest health. The indicators described in this report encompass forest insect and disease activity, wildland fire occurrence, drought, tree mortality, and lichen diversity, among others.
This report has three specific objectives. The first objective is to present information about forest health from a national perspective, or from a multi-State regional perspective when appropriate, using data collected by the Forest Health Protection (FHP) and Forest Inventory and Analysis (FIA) Programs of the Forest Service as well as from other sources available at a wide extent. The chapters that present analyses at a national scale or multi-State regional scale are divided between section 1 and section 2 of
the report. Section 1 presents results from the analyses of forest health data that are available annually, allowing for the detection of trends over time and changes from one year to the next. Section 2 presents longer term forest health trends in addition to describing new techniques for analyzing forest health data at national or regional scales. Although in-depth interpretation and analysis of specific geographic or ecological regions are beyond the scope of these parts of the report, the chapters in sections 1 and 2 present information that can be used to identify areas that may require investigation at a finer scale.
7
of monthly gridded climate data that was used in that chapter to conduct the annual analysis of drought status across the conterminous United States.
The third objective of the report is to present results of recently completed Evaluation Monitoring (EM) projects funded through the FHM national program. These project summaries, presented in section 3, determine the extent, severity, cause, or all three, of forest health problems (FHM 2012), generally at a finer scale than that addressed by the analyses in sections 1 and 2. Each chapter in section 3 contains an overview of an EM project and key results.
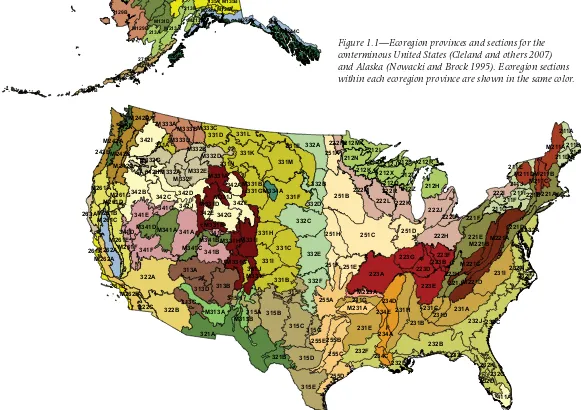
When appropriate throughout this report, authors use the Forest Service revised ecoregions (Cleland and others 2007) as a common,
ecologically based spatial framework for their forest health assessments (fig. 1.1). To be specific, when the spatial scale of the data and the
expectation of an identifiable pattern in the data are appropriate, authors use ecoregion sections or provinces as assessment units for their analyses. In Bailey’s hierarchical system, the two broadest ecoregion scales, domains and divisions, are based on large ecological climate zones, whereas
each division is broken into provinces based on vegetation macro features (Bailey 1995). Provinces are further divided into sections, which may be thousands of square kilometers in extent and are expected to encompass regions similar in their geology, climate, soils, potential natural vegetation, and potential natural communities (Cleland and others 1997).
DATA SOURCES
321A 251C 331F 322A 251B 223A 232B 315B 231I 332E 231E 322B 332C 331K 331M 232J 342I 221E 255A 315C 315E 313A 231A 231B 222H 341F 341A 342B 331C 313B 332A 331B 222J 223E 251D 331I 332F 331G 315D 342D 232F 222L 342G 341E 341B 212H 251E 331H 223G 331D M313A 255E 342C 223D 331L 212N 223F 212X M332E M231A 232C 331E 231H 222M 234D 251H 221A 255C M221A 262A M331I 222K 315A 342F 211F M341A M261E 232E 321B 315F 255D 313D 332B 255B 251A M332A M242B 232H M221D 222I 221F M211A M242A 221D M331D 313C 221H M332G 232I M261A 222U M331A M332D 232D 234A 212L 232K 232G 251F 231G 231C M313B M333A M331G 342A M242D 411A 332D M221C 231D 212K 212M 341G M262B 212T M341D 315G M221B 342J 232A 221J 342H M242C 211G M333D M262A 331N M211D M331F M331H M341C 331A M261G 341D M333B M332B 232L M341B 211D 211E 263A 242B 331J 212R M333C 212Q 223B M261F M261D 322C 261B 211B M211B 234E 261A 221B M223A 234C 211I M261B M331E 222N 211J 242A M332F 212S M211C 211A 315H M334A 212J 222R 341C 342E M331B 212Z 211C M261C 212Y M331J M125A 125A 129B M135C 121A M139C M139A M131A M129A 139A M131D M135B 131A M131C 131B 213A M131B M139B M213A M129B M244B 129A 213B 135A M244C M271A M244A M213B M245A M245B M135A 271A 245A M271B
Forest Health Monitoring
8
Chapter 1
9
Alaska Mixed Forest (213) Alaska Range Taiga (135) Aleutian Meadow (271) Arctic Tundra (121) Bering Sea Tundra (129) Brooks Range Tundra (125) Pacific Coastal Icefields (244) Pacific Gulf Coast Forest (245) Upper Yukon Taiga (139) Yukon Intermontaine Taiga (131)
Adirondack-New England Mixed Forest - Coniferous Forest - Alpine Meadow (M211) American Semi-Desert and Desert (322)
Arizona-New Mexico Mountains Semi-Desert - Open Woodland - Coniferous Forest - Alpine Meadow (M313) Black Hills Coniferous Forest (M334)
California Coastal Chaparral Forest and Shrub (261)
California Coastal Range Open Woodland - Shrub - Coniferous Forest - Meadow (M262) California Coastal Steppe - Mixed Forest - Redwood Forest (263)
California Dry Steppe (262)
Cascade Mixed Forest - Coniferous Forest - Alpine Meadow (M242) Central Appalachian Broadleaf Forest-Coniferous Forest-Meadow (M221) Central Interior Broadleaf Forest (223)
Chihuahuan Semi-Desert (321) Colorado Plateau Semi-Desert (313) Eastern Broadleaf Forest (221) Everglades (411)
Great Plains - Palouse Dry Steppe (331) Great Plains Steppe (332)
Intermountain Semi-Desert and Desert (341) Intermountain Semi-Desert (342)
Laurentian Mixed Forest (212) Lower Mississippi Riverine Forest (234)
Middle Rocky Mountain Steppe - Coniferous Forest - Alpine Meadow (M332) Midwest Broadleaf Forest (222)
Nevada-Utah Mountains Semi-Desert - Coniferous Forest - Alpine Meadow (M341) Northeastern Mixed Forest (211)
Northern Rocky Mountain Forest-Steppe - Coniferous Forest - Alpine Meadow (M333) Ouachita Mixed Forest-Meadow (M231)
Outer Coastal Plain Mixed Forest (232) Ozark Broadleaf Forest (M223) Pacific Lowland Mixed Forest (242) Prairie Parkland (Subtropical) (255) Prairie Parkland (Temperate) (251)
Sierran Steppe - Mixed Forest - Coniferous Forest - Alpine Meadow (M261) Southeastern Mixed Forest (231)
Southern Rocky Mountain Steppe - Open Woodland - Coniferous Forest - Alpine Meadow (M331) Southwest Plateau and Plains Dry Steppe and Shrub (315)
Alaska Ecoregion Provinces
Forest Health Monitoring
10
Chapter 1
(shaded)
58.9 ft radius 24.0 ft radius
Distance between subplot centers is 120.0 ft horizontal
6.8 ft radius center is 12.0 ft horizontal @90° azimuth from the subplot center
mapping system data (Daley and Taylor 2000; PRISM Group 2004, 2012); The Rainfall Atlas of Hawaii (Giambelluca and others 2011); the 2001 National Land Cover Database (Homer and others 2007); 1998–2004 average annual wet deposition values for sulfur dioxide, nitrate, and ammonium interpolated for each plot from models using National Atmospheric Deposition Program data (Coulston and others 2004); and version 4.4 of the Community Multiscale Air Quality model (Tonneson and others 2007).
As a major source of data for FHM analyses, the FIA Program deserves detailed description. The FIA Program collects forest inventory information across all forest land ownerships in the United States and maintains a network of more than 125,000 permanent forested ground plots across the conterminous United States and southeastern Alaska, with a sampling intensity of approximately one plot per 2428 ha. FIA phase 2 encompasses the annualized inventory measured on plots at regular intervals, with each plot surveyed every 5 to 7 years in most Eastern States, but with plots in the Rocky Mountain and Pacific Northwest regions surveyed once every 10 years (Reams and others 2005). The standard 0.067-ha plot (fig. 1.2) consists of four 7.315-m radius subplots (approximately 168.6 m2, or 1/24 acre), on which field crews measure trees at least 12.7 cm in diameter. Within each subplot is nested a 2.073-m radius microplot (approximately 13.48 m2, or 1/300 acre), on which crews measure trees smaller than 12.7 cm
Figure 1.2—The Forest Inventory and Analysis mapped plot design. Subplot 1 is the center of the cluster with subplots 2, 3, and 4 located 120 feet away at azimuths of 360°, 120°, and 240°, respectively (Woudenberg and others 2010).
11
FIA phase 3 plots represent a subset of these phase 2 plots, with one phase 3 plot for every 16 standard FIA phase 2 plots. In addition to traditional forest inventory measurements, data for a variety of important ecological indicators are collected from phase 3 plots, including tree crown condition, lichen communities, down woody material, soil condition, and vegetation structure and diversity, while data on ozone bioindicator plants are collected on a separate grid of plots (Woodall and others 2010, 2011). Most of these additional forest health indicators were measured as part of the FHM Detection Monitoring ground plot system before 20001 (Palmer and others 1991).
THE FOREST HEALTH
MONITORING PROGRAM
The national FHM Program is designed to determine the status, changes, and trends in indicators of forest condition annually and covers all forested lands through a partnership encompassing the Forest Service, State foresters, and other State and Federal agencies and
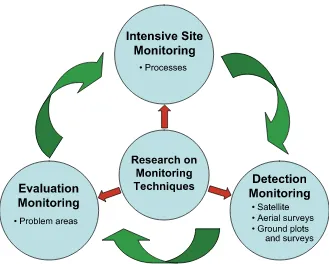
academic groups (FHM 2012). The FHM Program uses data from a wide variety of sources, both inside and outside the Forest Service, and develops analytical approaches for addressing forest health issues that affect the sustainability of forest ecosystems. The FHM Program has five major components (fig. 1.3):
1U.S. Department of Agriculture Forest Service. 1998. Forest
Health Monitoring 1998 field methods guide. Research Triangle Park, NC: U.S. Department of Agriculture Forest Service, National Forest Health Monitoring Program. 473 p. On file with: Forest Health Monitoring Program, 3041 Cornwallis Rd., Research Triangle Park, NC 27709.
• Detection Monitoring—nationally
standardized aerial and ground surveys to evaluate status and change in condition of forest ecosystems (sections 1 and 2 of this report).
• Evaluation Monitoring—projects to determine extent, severity, and causes of undesirable changes in forest health identified through Detection Monitoring (section 3 of this report). • Intensive Site Monitoring—projects to
enhance understanding of cause-effect relationships by linking Detection Monitoring to ecosystem process studies and to assess specific issues, such as calcium depletion and carbon sequestration, at multiple spatial scales (section 3 of this report).
• Research on Monitoring Techniques—work to develop or improve indicators, monitoring systems, and analytical techniques, such as urban and riparian forest health monitoring, early detection of invasive species, multivariate analyses of forest health indicators, and spatial scan statistics (section 2 of this report).
• Analysis and Reporting—synthesis of
Forest Health Monitoring
12
Chapter 1
In addition to its national reporting efforts, FHM generates regional and State reports. These reports may be produced with FHM partners, both within the Forest Service and in State forestry and agricultural departments. For example, the FHM regions cooperate with
their respective State partners to produce the annual Forest Health Highlights report series, available on the FHM Web site at www.fs.fed. us/foresthealth/fhm. Other examples include Steinman (2004) and Harris and others (2011).
The FHM Program and its partners also produce reports and journal articles on
monitoring techniques and analytical methods, including forest health data (Smith and Conkling 2004), soils as an indicator of forest health (O’Neill and others 2005), urban forest health monitoring (Cumming and others 2006, 2007; Lake and others 2006), health conditions in national forests (Morin and others 2006), crown conditions (Schomaker and others 2007, Randolph 2010, Randolph and Moser 2009), sampling and estimation procedures for vegetation diversity and structure (Schulz and others 2009), ozone monitoring (Rose and Coulston 2009), establishment of alien-invasive forest insect species (Koch and others 2011), spatial patterns of land cover (Riitters 2011), changes in forest biodiversity (Potter and Woodall 2012), and the overall forest health indicator program (Woodall and others 2010). For more information, visit the FHM Web site at www.fs.fed.us/foresthealth/fhm.
This FHM national report is produced by national forest health monitoring researchers at the Eastern Forest Environmental Threat Assessment Center, which was established under the Healthy Forest Restoration Act to generate Figure 1.3—The design of the Forest Health Monitoring (FHM) Program
13
knowledge and tools needed to anticipate and respond to environmental threats. For more information about the research team and about threats to U.S. forests, please visit www. forestthreats.org/about.
LITERATURE CITED
Bailey, R.G. 1995. Descriptions of the ecoregions of the United States. 2d ed. Misc. Pub. No. 1391, Map scale 1:7,500,000. Washington, DC: U.S. Department of Agriculture Forest Service. 108 p.
Bechtold, W.A.; Patterson, P.L., eds. 2005. The enhanced Forest Inventory and Analysis Program—national sampling design and estimation procedures. Gen. Tech. Rep. SRS-80. Asheville, NC: U.S. Department of Agriculture Forest Service, Southern Research Station. 85 p.
Cleland, D.T.; Avers, P.E.; McNab, W.H. [and others]. 1997. National hierarchical framework of ecological units. In: Boyce, M.S.; Haney, A., eds. Ecosystem management applications for sustainable forest and wildlife resources. New Haven, CT: Yale University Press: 181-200. Cleland, D.T.; Freeouf, J.A.; Keys, J.E., Jr. [and others].
2007. Ecological subregions: sections and subsections for the conterminous United States. 1:3,500,000; Albers equal area projection; colored. In: Sloan, A.M., tech. ed. Gen. Tech. Rep. WO-76. Washington, DC: U.S. Department of Agriculture Forest Service. Map, presentation scale. Also as a GIS coverage in ArcINFO format on CD-ROM or at http://fsgeodata.fs.fed.us/other_resources/ecosubregions. html. [Date accessed: March 18, 2011].
Costanza, R. 1992. Toward an operational definition of ecosystem health. In: Costanza, R.; Norton, B.G.; Haskell, B.D., eds. Ecosystem health: new goals for environmental management. Washington, DC: Island Press: 239-256. Coulston, J.W.; Riitters, K.H.; Smith, G.C. 2004. A
preliminary assessment of Montréal Process indicators of air pollution for the United States. Environmental Monitoring and Assessment. 95: 57-74.
Cumming, A.B.; Nowak, D.J.; Twardus, D.B. [and others]. 2007. Urban forests of Wisconsin: pilot monitoring project 2002. NA-FR-05-07. Newtown Square, PA: U.S. Department of Agriculture Forest Service, Northeastern Area State and Private Forestry. 33 p. Low resolution: http://www.na.fs.fed.us/pubs/fhm/pilot/pilot_study_ wisconsin_02_lr.pdf . High resolution: http://www.na.fs. fed.us/pubs/fhm/pilot/pilot_study_wisconsin2_02_hr.pdf. [Date accessed: October 19].
Cumming, A.B.; Twardus, D.B.; Smith, W.D. 2006. National Forest Health Monitoring Program, Maryland and Massachusetts street tree monitoring pilot projects. NA-FR-01-06. Newtown Square, PA: U.S. Department of Agriculture Forest Service Northeastern Area, State and Private Forestry. 23 p.
Daly, C.; Taylor, G. 2000. United States average monthly or annual precipitation, temperature, and relative humidity 1961-90. Arc/INFO and ArcView coverages. Corvallis, OR: Oregon State University, Spatial Climate Analysis. Edmonds, R.L.; Agee, J.K.; Gara, R.I. 2011. Forest health and
protection. Long Grove, IL: Waveland Press. 667 p. Forest Health Monitoring (FHM). 2003. Forest health
monitoring: a national strategic plan. http://fhm.fs.fed.us/ annc/strategic_plan03.pdf. [Date accessed: June 22, 2012]. Forest Health Monitoring (FHM). 2012. Program description. Forest Health Monitoring Fact Sheets Series. http://www. fhm.fs.fed.us/fact/. [Date accessed: June 21].
Giambelluca, T.W.; Chen, Q.; Frazier, A.G. [and others]. 2011. The rainfall atlas of Hawai’i [web page]. http:// rainfall.geography.hawaii.edu. [Date accessed: January 17, 2012].
Harris, J.L., comp.; Region 2 FHP staff. 2011. Forest health conditions, 2009–2010: Rocky Mountain Region (R2). R2-11-RO-31. Golden, CO: U.S. Department of Agriculture Forest Service, Renewable Resources, Forest Health Protection, Rocky Mountain Region. 108 p. Homer, C.; Dewitz, J.; Fry, J. [and others]. 2007.
Forest Health Monitoring
14
Chapter 1
Koch, F.H.; Yemshanov, D.; Colunga-Garcia, M. [and others]. 2011. Potential establishment of alien-invasive forest insect species in the United States: where and how many? Biological Invasions. 13: 969-985.
Kolb, T.E.; Wagner, M.R.; Covington, W.W. 1994. Concepts of forest health: utilitarian and ecosystem perspectives. Journal of Forestry. 92: 10-15.
Lake, M.; Marshall, P.; Mielke, M. [and others]. 2006. National Forest Health Monitoring Program monitoring urban forests in Indiana: pilot study 2002, part 1. Analysis of field methods and data collection. Gen. Tech. Rep. NA FR-06-06. Newtown Square, PA: U.S. Department of Agriculture Forest Service, Northeastern Area. http:// www.fhm.fs.fed.us/pubs/ufhm/indianaforests02/
indianaforests02.html. [Date accessed: November 6, 2007]. Montréal Process Working Group. 1995. Criteria and
indicators for the conservation and sustainable
management of temperate and boreal forests. http://www. rinya.maff.go.jp/mpci/rep-pub/1995/santiago_e.html. [Date accessed: June 21, 2012].
Morin, R.S.; Liebhold, A.M.; Gottschalk, K.W. [and others]. 2006. Analysis of forest health monitoring surveys on the Allegheny National Forest (1998–2001). Gen. Tech. Rep. NE-339. Newtown Square, PA: U.S. Department of Agriculture Forest Service, Northeastern Research Station. 102 p. http://www.fs.fed.us/ne/newtown_square/ publications. [Date accessed: November 6, 2007]. National Climatic Data Center. 2012. Climate data online—
monthly surface data (DS3220). http://cdo.ncdc.noaa/pls/ plclimprod/somdmain.somdwrapper?datasetabbv= DS32 20&countryabbv=&georegionabbv=&forceoutside=. [Date accessed: February 17].
Nowacki, G.; Brock, T. 1995. Ecoregions and subregions of Alaska, EcoMap Version 2.0. 1:5,000,000; colored. Juneau, AK: U.S. Department of Agriculture Forest Service, Alaska Region.
O’Neill, K.P.; Amacher, M.C.; Perry, C.H. 2005. Soils as an indicator of forest health: a guide to the collection, analysis, and interpretation of soil indicator data in the Forest Inventory and Analysis Program. Gen. Tech. Rep. NC-258. St. Paul, MN: U.S. Department of Agriculture Forest Service, North Central Research Station. 53 p. Palmer, C.J.; Riitters, K.H.; Strickland, T. [and others].
1991. Monitoring and research strategy for forests— Environmental Monitoring and Assessment Program (EMAP). EPA/600/4-91/012. Washington, DC: U.S. Environmental Protection Agency. 187 p.
Potter, K.M.; Woodall, C.W. 2012. Trends over time in tree and seedling phylogenetic diversity indicate regional differences in forest biodiversity change. Ecological Applications. 22(2): 517-531.
PRISM Group. 2004. 2.5-arcmin (4 km) gridded monthly climate data. http://www.prismclimate.org. [Date accessed: June 20, 2012].
PRISM Group. 2012. 2.5-arcmin (4 km) gridded monthly climate data. ftp://prism.oregonstate.edu//pub/prism/us/ grids. [Date accessed: April 23, 2012].
Raffa, K.F.; Aukema, B.; Bentz, B.J. [and others]. 2009. A literal use of “forest health” safeguards against misuse and misapplication. Journal of Forestry. 107: 276-277. Randolph, K.C. 2010. Equations relating compacted and
uncompacted live crown ratio for common tree species in the South. Southern Journal of Applied Forestry. 34(3): 118-123.
Randolph, K.C.; Moser, W.K. 2009. Tree crown conditions in Missouri, 2000–2003. Gen. Tech. Rep. SRS–113. Asheville, NC: U.S. Department of Agriculture Forest Service, Southern Research Station. 11 p.
15
Riitters, K.H. 2011. Spatial patterns of land cover in the United States: a technical document supporting the Forest Service 2010 RPA Assessment. Gen. Tech. Rep. SRS-136. Asheville, NC: U.S. Department of Agriculture Forest Service, Southern Research Station. 64 p.
Rose, A.K.; Coulston, J.W. 2009. Ozone injury across the Southern United States, 2002–06. Gen. Tech. Rep. SRS– 118. Asheville, NC: U.S. Department of Agriculture Forest Service, Southern Research Station. 25 p.
Schomaker, M.E.; Zarnoch, S.J.; Bechtold, W.A. [and others]. 2007. Crown-condition classification: a guide to data collection and analysis. Gen. Tech. Rep. SRS-102. Asheville, NC: U.S. Department of Agriculture Forest Service, Southern Research Station. 78 p.
Schulz, B.K.; Bechtold, W.A.; Zarnoch, S.J. 2009. Sampling and estimation procedures for the vegetation diversity and structure indicator. Gen. Tech. Rep. PNW-GTR-781. Portland, OR: U.S. Department of Agriculture Forest Service, Pacific Northwest Research Station. 53 p. Smith, W.D.; Conkling, B.L. 2004. Analyzing forest health
data. Gen. Tech. Rep. SRS-077. Asheville, NC: U.S. Department of Agriculture Forest Service, Southern Research Station. 33 p. http://www.srs.fs.usda.gov/pubs/ gtr/gtr_srs077.pdf. [Date accessed: November 6, 2007]. Smith, W.B.; Miles, P.D.; Perry, C.H.; Pugh, S.A. 2009. Forest
resources of the United States, 2007. Gen. Tech. Rep. WO-78. St. Paul, MN: U.S. Department of Agriculture Forest Service, Washington Office. 336 p.
Steinman, J. 2004. Forest health monitoring in the Northeastern United States: disturbances and conditions during 1993–2002. NA-Technical Paper 01-04. Newtown Square, PA: U.S. Department of Agriculture Forest Service, State and Private Forestry, Northeastern Area. 46 p. http:// fhm.fs.fed.us/pubs/tp/dist_cond/dc.shtml. [Date accessed: December 8, 2009].
Teale, S.A.; Castello, J.D. 2011. The past as key to the future: a new perspective on forest health. In: Castello, J.D.; Teale, S.A., eds. Forest health: an integrated perspective. New York: Cambridge University Press: 3-16.
Tonnesen, G.; Wang, Z.; Omary, M.; Chien, C.J. 2007. Assessment of nitrogen deposition: modeling and habitat assessment. Sacramento, CA: California Energy Commission, PIER Energy-Related Environmental Research. www.energy.ca.gov/2006publications/CEC-500-2006-032/CEC-500-2006-032.PDF. [Date accessed: June 20, 2012].
U.S. Department of Agriculture (USDA) Forest Service. 2004. National report on sustainable forests—2003. FS-766. Washington, DC: U.S. Department of Agriculture Forest Service. 139 p.
U.S. Department of Agriculture (USDA) Forest Service. 2011. National report on sustainable forests—2010. FS-979. Washington, DC: U.S. Department of Agriculture Forest Service. 134 p.
Woodall, C.W.; Amacher, M.C.; Bechtold, W.A. [and others]. 2011. Status and future of the forest health indicators program of the USA. Environmental Monitoring and Assessment. 177: 419-436.
Woodall, C.W.; Conkling, B.L.; Amacher, M.C. [and others]. 2010. The Forest Inventory and Analysis database: database description and users manual version 4.0 for phase 3. Gen. Tech. Rep. NRS-61. Newtown Square, PA: U.S. Department of Agriculture Forest Service, Northern Research Station. 180 p.