Discussion Paper Series
CDP No 05/05
Intergenerational Mobility and Return
Migration: Comparing sons of foreign
and native born fathers
Christian Dustmann
Centre for Research and Analysis of Migration
CReAM Discussion Paper No 05/05
Intergenerational Mobility and Return Migration:
Comparing the sons of foreign and native born fathers
Christian Dustmann*
*Centre for Research and Analysis of Migration, Department of Economics, University College London
Non-Technical Abstract
This paper studies the intergenerational mobility in earnings and education for father-son pairs with native and foreign born fathers. We develop a simple model which illustrates that a higher probability of a permanent migration of the parent increases educational investments into the child. Our empirical evidence is largely consistent with this. We find higher intergenerational mobility for father-son pairs with native born fathers than with foreign born fathers. For the foreign born, we find that son’s permanent wages are strongly and positively associated with the probability of the father’s permanent migration. Investigating investments into education, we find again a strong association between the probability of the father’s permanent migration, and the son’s educational attainments. These effects remain if in addition we condition on father’s education, or on father’s permanent earnings.
Intergenerational Mobility and Return Migration:
Comparing sons of foreign and native born fathers
∗
Christian Dustmann
†This Version: June 2005
Abstract
This paper studies intergenerational mobility in earnings and education for father-son pairs with native and foreign born fathers. We develop a simple model which illustrates that a higher probability of a permanent migration of the par-ent increases educational investmpar-ents into the child. Our empirical evidence is largely consistent with this. We find higher intergenerational mobility for father-son pairs with native born fathers than with foreign born fathers. For the foreign born, we find that son’s permanent wages are strongly and positively associated with the probability of the father’s permanent migration. Investigat-ing investments into education, we find again a strong association between the probability of the father’s permanent migration, and the son’s educational at-tainments. These effects remain if in addition we condition on father’s education, or on father’s permanent earnings.
∗I am grateful to David Card for many helpful discussions, and to Jerome Adda and Teresa Casey
for comments. This research was funded by the Economic and Social Research Council (grant RES-000- 23-0332).
†Department of Economics and Centre for Research and Analysis of Migration (CReAM) University
1
Introduction
Immigrants contribute significantly to the overall economic performance of their host economies. It is therefore not surprising that a large literature is concerned with the earnings mobility of the foreign born population, both in isolation, as well as in comparison with those who are native born.1 But immigrants have not only an
immediate effect on wealth accumulation and earnings and skill composition. They transmit their earnings status, as well as socio-economic and cultural characteristics to the next generation. The economic adjustment process within the immigrant’s own generation has long been recognised as an important step in understanding the economic effects of immigration. For understanding the long term consequences of immigration, assessment of intergenerational mobility in immigrant communities is perhaps equally important.
While the process of intergenerational economic mobility has been intensively stud-ied for majority populations (see Solon 1999, 2002 for reviews), less is known about intergenerational transmission in immigrant communities. For the U.S., early studies by Chiswick (1977) and Carliner (1980) compare earnings of immigrants with their descendants and their children. More recently, Borjas (1992, 1994) emphasises that intergenerational economic mobility among immigrants may be more complex, and estimating the usual models of intergenerational income mobility may miss out an im-portant aspect of this process. Borjas emphasises that the skills of the next generation may not only depend on parental inputs, but also on the quality of the ethnic environ-ment of the parent generation. Borjas terms this ethnic capital. In later work Borjas (1995) shows that one reason for the external effects of ethnicity is segregation into
particular neighbourhoods - a point that has been re-emphasised in work by Nielsen, Rosholm, Smith and Husted (2001).
This paper focusses on another important characteristic of immigrant communities that may affect the process of intergenerational mobility: the probability the immigrant family attaches to a permanent migration as opposed to a future return to the home country. There are a number of papers that show that return migration may affect dif-ferent aspects of immigrants’ behaviour. Work by Galor and Stark (1990) suggest that positive return probabilities may affect savings behaviour. Dustmann (1997) provides evidence that married immigrant women whose husbands plan to return to their home countries have a higher labour force participation rate. Dustmann (1999) develops a model that suggests that immigrants who have higher probabilities of returning are less likely to acquire human capital specific to the host country economy. He finds evidence for this by investigating their investment into language skills. In a recent paper, Cortes (2004) explains the higher rate of human capital accumulation by refugee immigrants in the US with lower probabilities in their return migration.
Similar considerations may hold in an intergenerational context. In this paper, we investigate how parental probabilities of a permanent as opposed to a temporary migration affect investment into their children. Our empirical analysis is for Germany, and based on detailed data from a long panel that oversamples immigrants. The data includes unique information on parental return intentions which we use to construct our measure for a permanent migration probability. To motivate our analysis, we develop a simple model, following previous work by Becker and Tomes (1979) and Solon (2004), which suggests that parental investment into the child increases with the probability of a permanent migration.
coef-ficients. Our analysis therefore extends some previous work on Germany by Couch and Dunn (1997) and Wiegand (1997) for the native born, but provides more robust esti-mates based on a longer panel. The panel nature of our data allows us to address the problem of measurement error in permanent parental earnings which bedevils studies of intergenerational transmission (see Solon 1989). In addition, we distinguish be-tween immigrant and native father-son pairs. To understand the precise nature of how parental background may affect earnings in the next generation, we also estimate investment equations, and equations of educational mobility.
Our results suggest that intergenerational earnings mobility from native born fa-thers to their sons is larger than from foreign born fafa-thers to their sons. This difference may be due to differences in direct investments, or differences in unobserved external-ities across the two communexternal-ities, conditional on ethnic capital. Estimates that relate educational achievements to permanent parental earnings show similar relationships for immigrants and natives, which suggests that differences in intergenerational earnings mobility are due to differences in unobserved endowments.
We also find that educational achievements of immigrant parents are not correlated with educational achievements of their children. This is in contrast with previous work by Card, DiNardo and Estes (1998) for the U.S., who show that much of the intergenerational link between the economic status of immigrant fathers and their sons and daughters works through education.2 Our findings are in line with similar results
reported by Gang and Zimmermann (2000). One explanation for this weak link in educational outcomes for immigrants is that it is the permanent earnings position of the father that matters for son’s educational attainment; father’s education is then
2Similar results are reported by Riphahn (2001), Bauer and Riphahn (2004) and van Ours and
only correlated with son’s education if education is a good predictor for earnings. We show that in our sample, this is not the case for immigrants.
We find consistent evidence that higher probabilities of permanent migration of the father increase permanent earnings as well as educational achievements of the sons of immigrants. This is an important results, in particular in light of the renewed interest in temporary or guest-worker type migration schemes in both Europe and the US. It suggests that such schemes may have possibly detrimental effect on the children of those immigrants who do not return.
The paper is structured as follows. In the next section we develop a simple theo-retical model, and discuss its empirical implications. In section 3 we describe the data and the sample. Section 4 presents the results, and section 5 concludes.
2
Theory
Our model is a permanent income model of intergenerational mobility with parental investments into child’s earnings potential, following early work by Becker and Tomes (1979) and Solon (2004). It extends Solon (2004) by taking account of the way the probability of a permanent migration as opposed to a future return may affect the decision of the parent to invest into the offspring’s human capital.
We consider a one-person household with one child. There are two periods. In the first period (period 0) both parent and child live in the host country. In the second period (period 1), the parent returns to the home country with probability 1−p, and remains in the host country with probabilityp. The parent retires in period 1, and has earnings in period 0 equal to y0. The child is in full time education in period 0, and
in the host country.
The parent is altruistic and maximises an intertemporal utility function, by choosing first period savingss0, and investment into the child’s human capital in the first period,
I0. When making these choices, the parent attaches the same probabilitypto his child’s
location choice in the second period than to his own. This assumption simplifies the algebra, but can be relaxed without affecting the key implications of our model, as long as the parent perceives the child’s probability to remain in the host country to increase in his probability of remaining.
The parent’s inter-temporal utility function is given by
V =u(c0) +p[u(cI1) +γ v(y1I)] + (1−p) [u(cE1, b) +γ v(y1E)], (1)
whereu(.) andv(.) are the the parent’s and the child’s utility functions, defined over parental consumption in period 0, c0, and parental consumption and child’s earnings
in period 1, cJ
1 and y1J. Here J = E, I stands for Emigration or Immigration country
respectively. The parameter γ is an altruistic weight. If γ = 0, the parent does not consider the child’s welfare in period 1. The parameter b is a preference parameter, reflecting a taste for consuming at home over consuming abroad. If b >1, more utility is obtained from consuming in the home country as compared to the host country.
We assume that parental investments translate into human capital of the child (h1)
according to the following production technology:
h1 =θlogI0 +e0. (2)
The parameter θ is a technology parameter measuring the productivity of invest-ments. The terme0 is the human capital the child receives without any direct parental
This term represents the child’s endowed attributes, depending on characteristics of the parent, the child’s upbringing, genetic factors, environment, and luck. It may also depend on existing networks, as well as the lack of opportunity to move out of social and economic structures from one generation to the next. This latter factor may be particularly important for immigrants, and we will discuss its implications later. It includes what Borjas (1992) calls ”ethnic capital” - the quality of the environment in which parental investments are made.
Human capital translates into earnings according to the following relationship:
logy1j =µj+rjh
1, (3)
wherej =I, E. Our formulation allows for different base wagesµas well as different returns to the child’s human capitalrj in the two countries. It follows from (2) and (3)
that the child’s earnings in the second period are related to parental investments as
logy1j =µj +rjθlogI0 +rje0. (4)
The parent’s consumption in period 0 equals c0 = Y0 −I0 −s0, where Y0 is first
period earnings. As the parent retires in period 1, period 1 consumption is equal to period 0 savings.
Choosing a simple logarithmic utility function, and substituting (4) for child’s earn-ings into (1), the optimisation problem of the parent can be expressed as
max
s,I V = log Y0−I0−s0+ p[logs0+γ(µI+r
IθlogI
0+rIe0)] + (5)
Maximising (5) w.r.t. savings and investment, and solving the first order conditions for the optimal investment I0 yields:
I0 =
γθ(p rI+ (1−p)rE)
γθ(p rI+ (1−p)rE)) + (1 +p+b(1−p))Y0 = Γ(p;r
E, rI, b, γ, θ) Y
0. (6)
The term in the numerator, which is equal to the first term in the denominator, is the expected utility gain to one unit of parental investment into the child’s human capital. The second term in the denominator is the expected lifetime utility from one log unit of additional consumption.
Simple comparative statics show that investment into the child’s human capital increases in p, the probability of a permanent migration, as long as the return to human capital investments is higher in the host country (rI > rE). Furthermore, a
lower probability of a permanent migration increases the expected gain in utility by consuming in the home country, as long as b > 1: the parent prefers to save more resources for future own consumption, thus reducing investment into the child. The combined effect leads to an increase in investment with the probability of a permanent migration. Finally, investment increases with altruismγand productivity of investment θ.
Now consider the relationship between child’s earnings and parent’s earnings for children who are observed in the host country in period 2. Substituting (6) into (4) and re-arranging terms yields
logy1I =µI+rIθ log Γ +rIθ log Y0+rIe1. (7)
Equation (7) is similar to the relationship between son’s earnings and father’s earn-ings, as derived in Solon (1999, 2004), except for the term Γ.
An estimable version of equation (7) is given by logyi1 =α1+α2Pi0 + K X k=1 α3kDik0+β log yi0+²i0, (8)
where P is a variable measuring the probability of a permanent migration of the parent, and y1 and y0 are permanent earnings of child and parent respectively. The
variable Dik0 is a dummy variable for the origin country k of individual i’s father. It
captures, among other factors, differences in ethnic capital (see Borjas 1992).3
3
Background, Data and Descriptives
3.1
Background
Between the mid 1950’s and 1973, the strong economic development in Northern Europe and the resulting demand for labour led to a large inflow of immigrants mainly from the periphery countries of Europe, but also from Turkey, North Africa, South America and Asia. The main receiving countries were Belgium, France, Germany, the Netherlands, Switzerland, and the Scandinavian countries.
The West-German economy experienced a strong upward swing after 1955, ac-companied by a sharp fall in the unemployment rate (between 1955 and 1960, the unemployment rate fell from 5.6 % to 1.3 %) and an increase in labour demand. This generated a large immigration of workers from Southern European countries and Turkey into Germany. The percentage of foreign born workers employed in West Germany in-creased from 0.6 percent in 1957 to 5.5 percent in 1965, to 11.2 percent in 1973, and
3Borjas (1992) parameterises origin dummies as functions of the average log earnings of the ethnic
declined thereafter. Bilateral recruitment agreements were set up between Germany and Italy, Spain, Greece, Turkey, Portugal and Yugoslavia in the 1950’s and 1960’s.
Labour migration over this period was initially considered as temporary by both the immigration countries and the emigration countries. Individuals were not expected to settle permanently. The German recruitment policy was based on the assumption that foreign workers would after some years return to their home countries. Still, although return migration has been quite considerable (see Boehning 1987), a large fraction of foreign born workers settled more permanently.
3.2
The Data and Sample
The data we use for this analysis stems from 19 waves of the German Socio-Economic panel (GSOEP 1984-2002), which is a household-based panel survey, similar to the US Panel Study of Income Dynamics (PSID) or the British Household Panel Study (BHPS). Initiated in 1984, the GSOEP oversamples the then resident immigrant pop-ulation in Germany, which stems from the migration movement we have described above. In the first wave, about 4500 households with a German born household head were interviewed, and about 1500 households with a foreign born household head. The data is unique in providing repeated information on a boost sample of immigrants over a long period of time.
Each individual in a respective household and over the age of 16 is interviewed. The household head provides information about all other individuals in the household and below the interviewing age. Individuals who leave households and form their own households are included in the panel.
When individuals are 16 years old, they receive their own personal identification, and pointers connect them to their mother and their father. We construct a sample of
father-son pairs for foreign born and native born fathers. We define a second generation immigrant as an individual who is born in Germany, and whose father is born abroad. The definition of our sample is in the tradition of previous studies on intergenerational mobility based on the PSID (see e.g. Solon 1992).4 Our reference group are individuals
who are likewise born in Germany, and whose father is German born. In our analysis we concentrate on father-son pairs.
We analyse below intergenerational earnings mobility, as well as the relationship be-tween permanent parental earnings and education and son’s educational achievements. For the analysis on earnings mobility, we exclude sons who are younger than 20 years. Our age range is between 20 and 34. Our analysis of educational achievements consid-ers two measures: completed education, and secondary track choice. For analysis on completed education, we use only individuals above the age of 20, and who have com-pleted education. Track choices in Germany are made at the age of 10, and determine whether individuals will be entitled to study at university, or will receive secondary education that entitles only for vocational or apprenticeship based post-secondary ed-ucation (see Dustmann, 2004). For this analysis, we include all sons above the age of 16, as their track choice has been made even if they are still in secondary education.
4Our sample is different from that used by Gang and Zimmermann (2000), who investigate the
relationship between educational attainment and ethnic origin using the same data. They define children of immigrants as individuals who immigrated before the age of 16 (or who are born in Germany), and who are sampled in the core data. Their data on parental characteristics stems from retrospective information.
3.3
Sample Characteristics and Variables
Our resulting samples contain a total of 795 sons born to native born fathers, and 334 sons of foreign born fathers. Because some fathers have more than one son, we have 640 corresponding native born fathers, and 251 foreign born fathers. In table 1 we provide a breakdown of fathers and sons in the two samples.
Table 1: Foreign born and Native born Fathers
Number of Sons to Father Foreign Born Fathers Native Born Fathers
No. Percent No. Percent
1 182 72.51 500 78.13
2 55 21.91 126 19.69
3 14 5.58 13 2.03
4 – – 1 0.16
Total number of fathers 251 100.00 640 100.00
Total number of sons 334 795
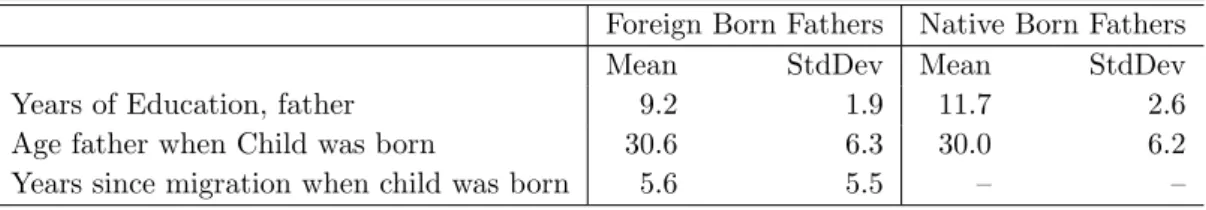
In table 2 we display information on the fathers’ observable characteristics. Foreign born fathers have about 2 years less education than native born fathers. The age of fathers when the son was born is relatively similar, at about 30 years. Foreign born fathers have been on average 5.5 years in Germany when their son was born.
Table 2: Individual Characteristics, Fathers
Foreign Born Fathers Native Born Fathers
Mean StdDev Mean StdDev
Years of Education, father 9.2 1.9 11.7 2.6
Age father when Child was born 30.6 6.3 30.0 6.2
Years since migration when child was born 5.6 5.5 – –
As a measure for earnings, we use hourly wages for both fathers and sons. The data provides information on average weekly gross earnings in the month preceding the interview, and on hours worked for pay during that month. From that information, we
compute an hourly wage rate. Weekly rather than yearly gross earnings are reported in the GSOEP.
A common problem in the literature on intergenerational mobility is the lack of sufficient information for the estimation of the permanent wage for fathers as well as their sons, which is particularly severe in short panels. Zimmerman (1992), Solon (1989, 1992) and Dearden et al. (1997) among others emphasise the problems of measurement error in parental earnings for the estimation of intergenerational mobility parameters. The length of our panel allows us to address this problem without the loss of many observations. Table 10 in the appendix displays valid wage spells of fathers in our sample, where the first set of columns report numbers for foreign born fathers and the second set of columns for native born fathers.
There is a total of 19 possible years an individual can report earnings, corresponding to a total of 2,577 earnings spells for foreign born fathers, and a total of 7,262 earnings spells for native born fathers. About 75% of fathers in the two samples have more than 6 wage observations, constituting, for each group, more than 90 percent of all wage spells in the data.
For sons, we disregard earnings spells while being on apprenticeship schemes. Ap-prenticeship schemes are vocational training schemes which pay low and regulated wages, and these wages are not appropriate measures for long-run status. As said above, we also exclude wage spells when individuals were younger than 20, for similar reasons. Table 11 in the appendix displays the wage information for sons. Among those with foreign born fathers, there are 161 individuals with 606 valid wage spells; among those with native born fathers, there are 373 individuals with 1,824 valid wage spells.
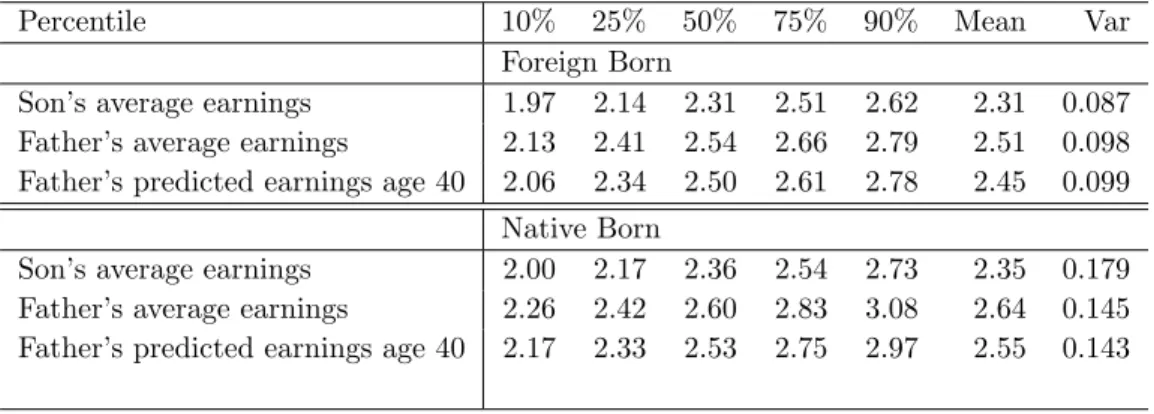
in our data. The age range is between 20 and 34 years, with the mean age of sons born to native and foreign born fathers being 26 years and 24.2 years respectively, and 47 and 48 years for native and foreign born fathers. The entries in the table show that mean wages of native born fathers are about 13 percent higher than mean wages of foreign born fathers. For sons, this difference has reduced to 4 percent. Wages of both sons and fathers in the native sample are considerably more dispersed than wages of sons and fathers in the sample of foreign born fathers. For natives, earnings of sons are slightly more dispersed than earnings of fathers - which is similar to what is found in US studies using similar data (see Solon, 1992). For the foreign born, however, fathers’ earnings seem to be more dispersed than sons’ earnings. Differences between sons to native and foreign born fathers seem to be similar throughout the distribution, while differences for native and foreign born fathers are slightly more substantiated in the upper percentiles of the distribution.
Table 3: Percentiles average earnings, Foreign and Native born Fathers
Percentile 10% 25% 50% 75% 90% Mean Var
Foreign Born
Son’s average earnings 1.97 2.14 2.31 2.51 2.62 2.31 0.087
Father’s average earnings 2.13 2.41 2.54 2.66 2.79 2.51 0.098
Father’s predicted earnings age 40 2.06 2.34 2.50 2.61 2.78 2.45 0.099 Native Born
Son’s average earnings 2.00 2.17 2.36 2.54 2.73 2.35 0.179
Father’s average earnings 2.26 2.42 2.60 2.83 3.08 2.64 0.145
Father’s predicted earnings age 40 2.17 2.33 2.53 2.75 2.97 2.55 0.143
Permanent Earnings
To eliminate measurement error, we essentially follow the literature which averages wages over a number of years, thus increasing the signal-noise ratio in earnings
in-formation (see e.g. Solon 1992 and Zimmerman 1992). Our method is slightly more general, and allows the inclusion of individuals with a minimum number of wage spells, but observed in different years, and without requiring subsequent valid spells. The way we do this is to estimate fixed effects wage regressions, conditioning on a quadratic in age. Our regressions have the following form:
lnwit =ak1 +ak2age+ak3age2+vi+uit, (9)
where lnwitare log real wages of individual iin periodt, thevi are individual fixed
effects, and the uit are iid error terms which include measurement error. The index
k is an index for the two groups of foreign and native born individuals. We estimate equation (9) separately for foreign born and native born fathers. Unconditional on age, the sum of estimates ˆak
1+ ˆvi is the mean wage for individual iin groupk. Conditioning
on age fixes individuals at the same point in their life cycle. As for our measure of permanent earnings, we predict ˆak
1+ ˆvi+ ˆak2age+ ˆak3age2 at age 40 for both native and
foreign born fathers.5 While estimates for ˆak
2 and ˆak3 are unbiased and consistent, the
estimates for vi are unbiased but inconsistent for small t, and estimates of permanent
earnings will suffer from measurement error if the sample contains individuals with small t(i.e. individuals that have reported earnings only for a small number of years). For our estimation, we will successively increase the minimum number of periods we require individuals to have valid earnings information to be included in the sample. The last rows of table 3 report predicted earnings, and the distribution of predicted earnings for native and foreign born fathers.
5The age for which we predict earnings does not matter for estimation of intergenerational
Probability of Permanent Migrations
To compute the probability of a permanent migration, we use survey information on father’s beliefs about whether or not he wishes to return to the home country in the future. Our data is unique in providing information about these beliefs. In each year between 1984 and 1995, immigrants have been interviewed about whether they intend to stay permanently in Germany, or whether they intend to return home at some point in the future.6
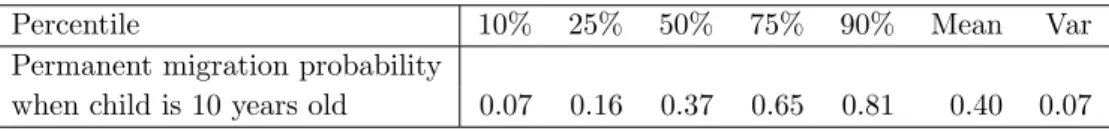
These intentions are likely to be subject to measurement error; furthermore, perma-nent migration intentions may also change over the immigrant’s life cycle. To obtain a measure for the probability that immigrants may have assigned to a possible perma-nent migration when making investment decisions about the child, we have first coded this information into a binary variable (assuming the value 1 when the response was 3: ”I want to remain permanently”). Similar to obtaining permanent earnings mea-sures, we then estimate fixed effects regressions, where we condition on a quadratic in the years since migration. As a measure for the permanent migration probability, we compute the individual specific fixed effects, evaluated at the years of residence when the child was 10 years old (which in Germany is the age where secondary track schools are decided, see Dustmann 2004 for details) and normalise this variable between 0 and 1.
We present the distribution of this variable in table 4. On average, the probability of remaining permanently in Germany is about 40 percent.
Expected returns are not necessarily realised later on, but they are strongly
corre-6The exact phrasing of the question is ”How long do you want to live in Germany?”. Respondents
could answer 1, ”I want to return within the next 12 months”, 2, ”I want to stay several more years in Germany”, or 3, ”I want to remain in Germany permanently”.
Table 4: Distribution of Permanent Migration Probabilities
Percentile 10% 25% 50% 75% 90% Mean Var
Permanent migration probability
when child is 10 years old 0.07 0.16 0.37 0.65 0.81 0.40 0.07
lated with later returns. Of those who replied in 1984 that they consider their migration as temporary, 25 percent have returned by 1997, compared to only 12 percent among those who replied in 1984 that they wish to stay permanently. However, expected returns are the appropriate measure as conditioning variables for human capital in-vestments, as it is the expectation on which current investments are based rather than later realisations.
In our estimations, we make the assumption that parent’s permanent migration probability calculated in this way is exogenous to outcomes of the son. If fathers condition their own migration plans on the son’s performance, then this may lead to simultaneity bias. This may be an issue when studying intergenerational earnings mobility, where the son’s labour market success may affect the father’s plans about a permanent migration. To test for this we will perform robustness checks where we use a measure of permanent migration probabilities that is constructed from father’s responses before the son has entered the labour market.
Selection issues
The sample of the foreign born father-son pairs we use for analysis is one which is selected - we observe more father-son pairs where fathers have a higher propensity to stay permanently. This induces a selection which is correlated with our measure for a permanent migration probability: those with a higher probability of a permanent migration (measured by past intentions) will be more likely to be in the sample. If
sons of those immigrants who remain in the sample perform differently than sons of those who return (conditional on father’s permanent earnings and permanent migration probability), then this will bias the coefficient of the return probability. The bias will be downward if residuals in the selection equation and the intergenerational mobility equation are positively correlated (indicating that sons of father-son pairs who remain in the sample do better than sons of father-son pairs who drop out of the sample, condi-tional on father’s earnings and permanent migration probability). The intuition is that those who have a low probability to remain permanently, but are nevertheless in the sample, must have unobserved characteristics that are positively related to son’s per-formance, reducing the coefficient estimate on the permanent migration probability in absolute size.7 We can therefore interpret the coefficients on the permanent migration
measure as a lower bound.
7More formally, suppose that the latent index for being selected into the sample, s∗ is linear in
p, the probability of a permanent migration, with s∗
i = α0+αpi+ui, and that a father-son pair is in the sample if s∗
i > 0. Suppose that the outcome equation is given by yi = γ0+γpi +vi, and assume thatui and vi are jointly normally distributed, with variances 1 and σv2 and correlation coefficientρ. Then selection could be accounted for by adding the generalised residual E(vi|s∗i >0) =λ(ci) to the estimation equation, whereλ(ci) =φ(ci)/Φ(ci), withφand Φ being the density and distribution function of the standard normal, and ci =α0+αpi. We obtain the estimation equation
yi =γ0+γpi+σvρ λ(ci) +ei.Omission ofλ(ci) results in a biased estimate for γ. The expectation of the error term when omitting λ, conditional onpi, isρ σvE(λ(ci)|pi). Sinceλdecreases inci, the bias is downward forρ >0 andα >0.
4
Results
4.1
Intergenerational earnings correlation
Comparing Foreign and Native born Father-Son Pairs
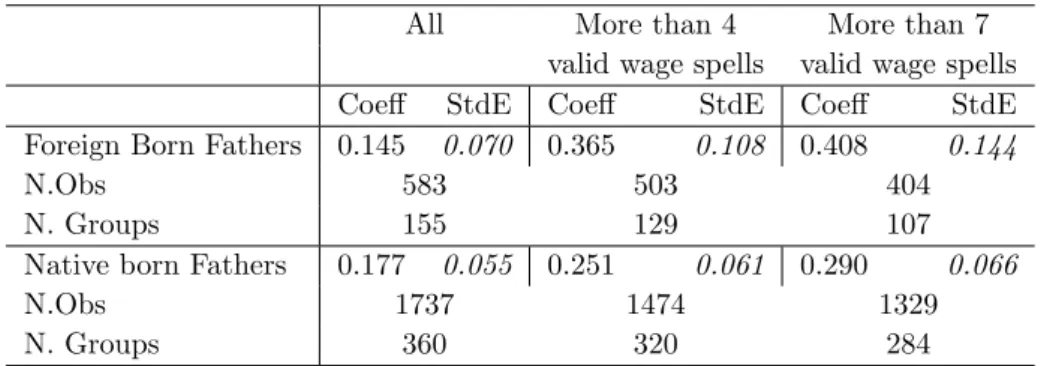
In table 5 we report intergenerational correlation coefficients for both immigrants and natives, using the measure for father’s permanent log wage as described above. We use all wage information for sons, and report standard errors that allow for an equicorre-lated covariance matrix. Estimates are based on equation (8), but include in addition a quadratic in son’s age and a linear time trend. The upper panel of table 5 reports results for foreign born fathers, and the lower panel reports results for native born fathers.
The results in the first column are based on all available observations for construct-ing father’s log wages. Intergenerational correlation coefficients for natives as well as immigrants are small, and similar in magnitude to those reported by Crouch and Dunn (1997).
In the second column, we use as a measure for parental permanent earnings predic-tions based on at least 5 wages spells. This should reduce any downward bias through measurement error. The effect on estimates is quite dramatic, with coefficients increas-ing to 0.25 for natives, and 0.36 for immigrants. The last column reports estimates where only father-son pairs are included with fathers reporting at least 8 wage spells. Coefficients rise further, to 0.29 for natives, and 0.40 for immigrants. Restricting the samples even further (we experimented with at least 11 wage observations for fathers) does not lead to any significant further change in the coefficients.
The increase in estimated coefficients is in line with other studies, suggesting sub-stantial underestimation in the degree of intergenerational immobility through
mea-Table 5: Intergenerational correlation coefficients, foreign and native born fathers
All More than 4 More than 7
valid wage spells valid wage spells
Coeff StdE Coeff StdE Coeff StdE
Foreign Born Fathers 0.145 0.070 0.365 0.108 0.408 0.144
N.Obs 583 503 404
N. Groups 155 129 107
Native born Fathers 0.177 0.055 0.251 0.061 0.290 0.066
N.Obs 1737 1474 1329
N. Groups 360 320 284
Dependent variable: Son’s log hourly wage. Regression includes son’s age and age2, a linear time trend, and father’s country of origin dummies for
individuals with a foreign born father.
surement error in parental earnings. The magnitude of estimates is in between those reported for the US by Solon (1992) and Zimmermann (1992), and those reported for Sweden by Bjoerklund and Jantti (1997) who also use multi-year averages to reduce measurement error in parental earnings. The numbers suggest further a larger inter-generational immobility for immigrant father-son pairs than for native father-son pairs. The difference in point estimates, based on estimates in column 3, is about 0.12.
Explaining differences in intergenerational correlation
One explanation for the larger coefficient estimate as well as the larger downward bias for immigrants due to measurement error is a larger correlation in ²i0 in (8) across
generations. Following Becker and Tomes (1979) and Solon (2005), suppose that this term follows an AR(1) process, reflecting the serial correlation in unobserved factors that determine parent’s and son’s permanent earnings position, ²it =β+λ ²i,t−1+νt,
where νt is a white noise error term and λ ∈(0,1) measures the degree of correlation
in unobservables across generations. These may include ability and the networking capacity of the parent in generating opportunities for the offspring, but also and in
particular for immigrants be related to discrimination, as well as segregation.
The probability limit of the estimated parameterb(based on equation (8) and using OLS) is then
plimb= β+λ 1 +β λ,
which is an increasing function of λ and β. Any differences in estimates of inter-generational mobility between different groups (in our case, immigrants and natives) may be due to differences in either of the two parameters.
It is easy to show that measurement error leads to a larger downward bias if λ is larger.8 Accordingly, if we consider two populations with differently sized λ’s, but
the same measurement error in earnings, we should expect a larger downward bias in the population where λ is larger, as is the case for the two groups in table (5). Therefore, the estimates of intergenerational mobility coefficients for the two groups are compatible with a higher degree of correlation in unobservables for father-son pairs with foreign born fathers.
Permanent Migration Probabilities
In table 6 we report estimates for immigrants where we condition additionally on the father’s probability of a permanent migration. Other regressors include as before a
8Assume that the measure for permanent parental earningsy
0that we observe in our data is equal
toy∗
0 =y0+ξ, whereξis measurement error. Then our OLS estimate of the parameterβ is given by
plimb= β+λ 1 +β λ+σξ2 σ2 u(1−λ 2)(1−λβ)(1−β2), where σ2
ξ is the variance of the measurement error. Therefore, the intergenerational elasticity for children of native and foreign born parents may differ due to factors that influence the degree of heri-tability (λ), or due to parental investment into child’s human capital (β). The effect of measurement error on the degree of downward bias in the estimate ofβ increases inλ.
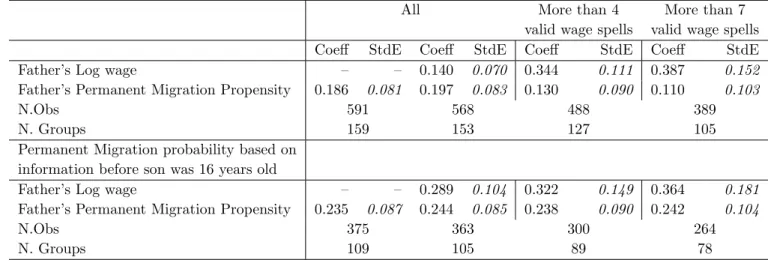
Table 6: Son’s log wages and permanent migration probabilities, foreign born fathers
All More than 4 More than 7
valid wage spells valid wage spells
Coeff StdE Coeff StdE Coeff StdE Coeff StdE
Father’s Log wage – – 0.140 0.070 0.344 0.111 0.387 0.152
Father’s Permanent Migration Propensity 0.186 0.081 0.197 0.083 0.130 0.090 0.110 0.103
N.Obs 591 568 488 389
N. Groups 159 153 127 105
Permanent Migration probability based on information before son was 16 years old
Father’s Log wage – – 0.289 0.104 0.322 0.149 0.364 0.181
Father’s Permanent Migration Propensity 0.235 0.087 0.244 0.085 0.238 0.090 0.242 0.104
N.Obs 375 363 300 264
N. Groups 109 105 89 78
Dependent variable: son’s log hourly wage. Regression includes son’s age and age2, a linear
time trend, and father’s country of origin dummies.
quadratic in son’s age, father’s origin dummies, and a time trend. The estimated coefficient of the measure for a permanent migration suggest a higher log wage of sons whose fathers tend to consider the migration as permanent rather than temporary. The effect is sizeable: an increase in the probability of a permanent migration by one standard deviation (0.26) increases son’s permanent real wages by about 5 percent.
In the next columns we condition in addition on father’s permanent wages. Columns 2 consider all father-son pairs with at least one observation on father’s earnings, and columns 3 and 4 restrict the sample to father-son pairs with at least 5 or 8 earnings observations for the father, respectively. In columns 2 the coefficient on father’s prob-ability of a permanent migration remains roughly the same as in column 1, with about the same standard error. Conditional on father’s permanent earnings, an increase of the probability of the father staying permanently continues to increase son’s permanent wage.
observations (columns 3 and 4), the coefficient on the measure for a permanent migra-tion propensity decreases in size, with a slightly increased standard error. One reason for this is that father’s permanent earnings are positively correlated with father’s prob-ability to migrate permanently. Therefore, a downward bias in the effect of father’s permanent earnings on son’s wage translates into an upward bias in the coefficient estimate of the permanent migration probability. Compared to table 5, the size of the coefficient of the father’s permanent wage measure is slightly decreased.
Robustness checks
One concern which we discussed above is the possible simultaneity problem that occurs when fathers base their permanent migration intentions on the economic success of the offspring. To check that, we have re-estimated regressions in table 6 using permanent migration probabilities that are constructed from father’s responses before the son was 16 years old. We present results in the lower panel of the table.
The estimates for the permanent migration probability increase slightly in size, and remain stable and significant throughout the four specifications. Estimates for the three measures of father’s permanent earnings remain more stable than before. The reason for this is that the sample which is based on permanent migration intentions before sons were 16 years old excludes many of those fathers who have only a small number of wage observations, thus reducing the measurement error bias from the start. We include in our sample siblings who have the same father (see table 1 for fre-quencies). To check whether our results are robust to using only the oldest son for father-son pairs with more than one son, we re-estimate the models restricting our sample to father-oldest son pairs if a father has more than one son. The results for the intergenerational correlation coefficients are similar, with point estimates and
as-sociated standard errors of 0.261 (0.058) and 0.278 (0.061) for natives using wage information based on more than 5 or 7 years of father’s wage data, and corresponding coefficients of 0.355 (0.165) and 0.360 (0.197) for immigrants. Point estimates remain higher for immigrant father-son pairs.
When conditioning on the permanent migration probability in addition, coefficients on father’s permanent earnings decrease slightly, as before. The estimated coefficient on the father’s permanent migration probability is similar: point estimates for regressions in columns 1-4 of table 6 are 0.20, 0.16, 0.15, and 0.17.
4.2
Education
We now turn to educational outcomes, and investigate the relationship between son’s education and parental education and earnings. We consider two measures for educa-tion: completed education, and secondary school track choice.
In Germany, the age of 10 marks an important decision in the school career of children. At this age, the child transfers from primary to secondary school, and, at the same time, has to decide between 3 secondary school tracks: lower secondary (with graduation typically at age 16), intermediate secondary (with graduation typically at age 16-17), and high school (with graduation typically at age 18-19). Although switch-ing tracks is possible, it rarely occurs (see Pischke, 1999 for evidence). Only high school allows for continuation to University; lower and intermediate secondary schools qualify for blue collar and white collar apprenticeship degrees.9 This track choice, at this young
9Note that in Germany, only about 19% of a cohort attends university. About 65% enrolls on an
apprenticeship training scheme, a combined school-workplace training scheme that lasts between 2 and 3 years. Many qualifications that can only be acquired through college or university attendance in the US or the UK are obtained through apprenticeship training in Germany.
age, is important for future career prospects. Dustmann (2004) illustrates the strong correlation between secondary school track, post-secondary educational achievements, and earnings.
We first analyse type of secondary school attendance. Our sample includes all sons above the age of 15, even if they are still in secondary education, because the secondary school choice has been made before that age. We then analyse completed education, measured as the total number of years in full time education for those who have finished full time education. Our analysis has three objectives. First, to investigate the possi-ble correlation between child’s educational achievements, and education of the father, and compare this for the two groups. Second, to investigate the relationship between father’s permanent earnings and school track enrollment of the son. And finally, for foreign born fathers, to understand the possible relationship between the probability the father assigns to a possible permanent migration, and the educational qualifications of the son.
School Track Choice
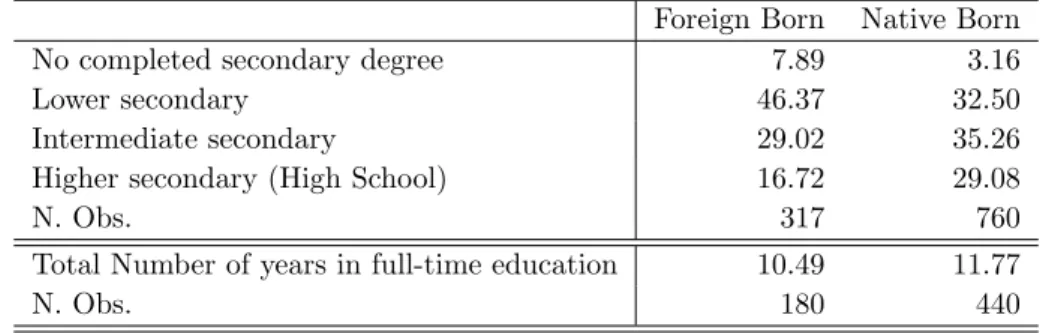
In table 7 we display secondary school degrees for sons of native and foreign born fathers. The numbers show that sons of native born fathers have a higher probability of attending higher track schools than the sons of foreign born fathers. While about 64 percent of sons of native born fathers attend at least an intermediate secondary school, this number is only 46 percent for sons of foreign born fathers. On the other hand, about 8 percent of sons of foreign born fathers do not complete secondary school training, while this is the case for only 3 percent of sons of native born fathers.
The numbers in the lower panel give the total number of years of education for the two groups. There is a difference in the number of years of full time education
between sons of native and foreign born fathers of about 1.3 years, which is a significant reduction compared to the fathers’ generation, where this difference was 2.4 years (see table 2).
Table 7: Secondary School Degrees, Sons of Foreign and Native Born Fathers Foreign Born Native Born
No completed secondary degree 7.89 3.16
Lower secondary 46.37 32.50
Intermediate secondary 29.02 35.26
Higher secondary (High School) 16.72 29.08
N. Obs. 317 760
Total Number of years in full-time education 10.49 11.77
N. Obs. 180 440
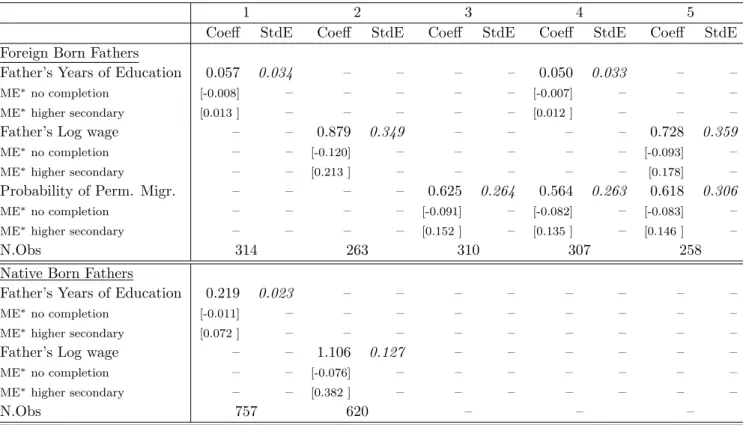
In table 8 we present results from ordered probit estimates of secondary school choice, where the upper panel presents estimates for sons of foreign born fathers, and the lower panel presents estimates for sons of native born fathers. As in table 7, we distinguish between four attainments: no completed secondary school, lower secondary school, intermediate secondary school, and high school. We use the same sample on which means in the previous table are based, which includes all individuals who are at least 16 years old. For construction of the education variable, we use the last spell for each son where educational attainment is reported. For sons who are still in secondary school, we use information on the type of secondary school in which the individual is enrolled.
Estimates condition on the son’s birth cohort, and (for foreign born fathers) on country of father’s birth. We present estimation results of coefficients on father’s number of years of education, father’s permanent earnings (where we use estimates based on a minimum of 5 wage spells), and (for foreign born fathers) the probability of a permanent migration. Standard errors are corrected for clustering if the same
father has more than one son that is included in the sample. We report in brackets underneath the marginal effects of the respective variable on the probability that the son does end up with no completed post-secondary degree (first row), and with a high school degree (second row). These probabilities are calculated at sample means for each of the two samples. Estimates for sons to foreign born fathers are reported in the upper panel, and for sons to native born fathers in the lower panel.
The first column presents results for father’s years of education. This variable is insignificant for foreign born fathers, but highly significant (and much larger in size) for native born fathers. For the latter groups, each year of additional education increases the probability that the son attends high school by 7.2 percentage points. These results support estimates by Gang and Zimmermann (2000), who do not find any association in education between foreign born parents and their children. In their case, this may be due to the fact that their sample includes immigrants who arrived before the age of 16, and have therefore obtained or started education in their home countries. In our case, all sons to foreign born parents are born in Germany; despite that, we find only small and insignificant associations between father’s and son’s educational attainments. One explanation is that it is father’s permanent earnings (rather than father’s education) that matters for investment into son’s education. If father’s education is not strongly correlated with his permanent earnings, then this leads to a low intergenerational correlation in education. We investigate this hypothesis in more detail below.
Columns 2 report results where we regress on father’s permanent wage. This equa-tion is similar to the investment equaequa-tion in our theoretical model. The coefficient for foreign born fathers is slightly smaller in size than the coefficient for native born fa-thers, and significantly different from zero. To compare the magnitude of these effects, we consider the marginal probabilities, which are given in brackets underneath. An
Table 8: Secondary school track choice
1 2 3 4 5
Coeff StdE Coeff StdE Coeff StdE Coeff StdE Coeff StdE
Foreign Born Fathers
Father’s Years of Education 0.057 0.034 – – – – 0.050 0.033 – –
ME∗no completion [-0.008] – – – – – [-0.007] – – –
ME∗higher secondary [0.013 ] – – – – – [0.012 ] – – –
Father’s Log wage – – 0.879 0.349 – – – – 0.728 0.359
ME∗no completion – – [-0.120] – – – – – [-0.093] –
ME∗higher secondary – – [0.213 ] – – – – – [0.178] –
Probability of Perm. Migr. – – – – 0.625 0.264 0.564 0.263 0.618 0.306
ME∗no completion – – – – [-0.091] – [-0.082] – [-0.083] –
ME∗higher secondary – – – – [0.152 ] – [0.135 ] – [0.146 ] –
N.Obs 314 263 310 307 258
Native Born Fathers
Father’s Years of Education 0.219 0.023 – – – – – – – –
ME∗no completion [-0.011] – – – – – – – – –
ME∗higher secondary [0.072 ] – – – – – – – – –
Father’s Log wage – – 1.106 0.127 – – – – – –
ME∗no completion – – [-0.076] – – – – – – –
ME∗higher secondary – – [0.382 ] – – – – – – –
N.Obs 757 620 – – –
Ordered probit estimates, dependent variable: secondary school track. Regression includes son’s birth cohort, and (for the foreign born) father’s country of origin dummies.
increase in father’s permanent wages by about 10 percent increases the probability of high school attendance by about 2.1 percentage points for sons born to foreign born fathers, and by 3.8 percentage points for sons with native born fathers.
The measure for a permanent migration probability is included in columns 3-5. It is always significantly different from zero, and the size of the coefficient is similar across specifications. Unconditional on father’s permanent earnings and education, an increase in the probability to remain permanently by one standard deviation increases the probability of high school attendance by about 5 percentage points. Given that only about 17 percent of sons of foreign born parents attend high school, this impact is quite large.
Years of Education
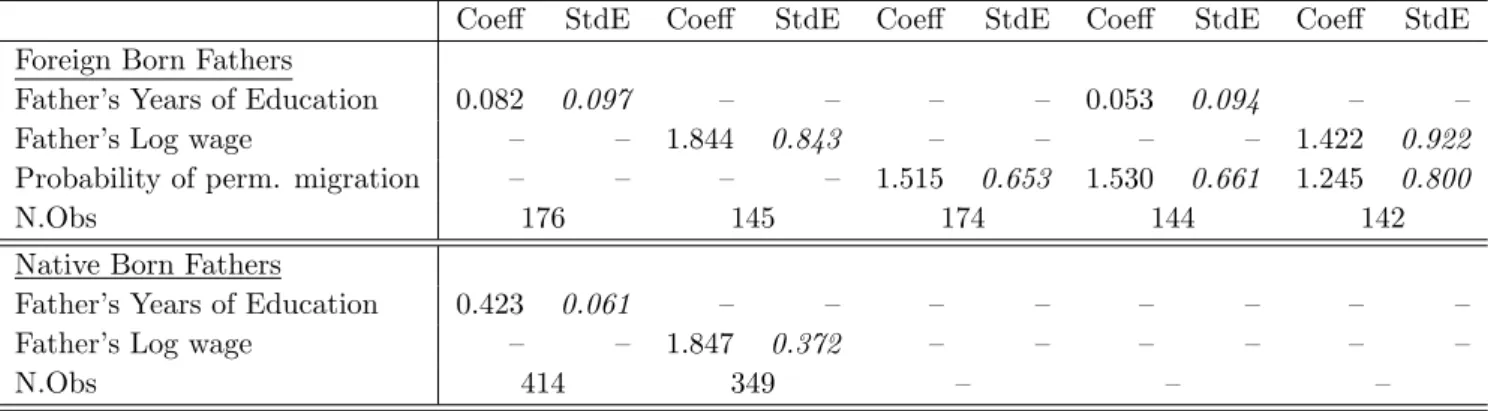
In table 9 we present results where we regress the completed number of years of educa-tion for those sons who completed full time educaeduca-tion on father’s years of educaeduca-tion and permanent wages (again based on a minimum of 5 wage observations). For immigrant fathers, we also include their probability of a permanent migration. Results on fathers’ years of education are similar to those we obtained from the ordered probit specifica-tions above: while for native fathers, education has a strong and significant effect on son’s education, it is smaller in size and insignificant for immigrants. This is similar to our findings on school track choice, and suggests that there is little intergenerational correlation in education levels for immigrants.
While intergenerational correlation in education differs across groups, there is how-ever a strong association between father’s permanent earnings and son’s number of years of completed education for both groups, with similarly sized coefficient esti-mates. An increase in permanent wages by 10 percent increases the number of years
Table 9: Years of Education
Coeff StdE Coeff StdE Coeff StdE Coeff StdE Coeff StdE
Foreign Born Fathers
Father’s Years of Education 0.082 0.097 – – – – 0.053 0.094 – –
Father’s Log wage – – 1.844 0.843 – – – – 1.422 0.922
Probability of perm. migration – – – – 1.515 0.653 1.530 0.661 1.245 0.800
N.Obs 176 145 174 144 142
Native Born Fathers
Father’s Years of Education 0.423 0.061 – – – – – – – –
Father’s Log wage – – 1.847 0.372 – – – – – –
N.Obs 414 349 – – –
Dependent variable: number of years of education. Regression includes son’s birth cohort, and (for the foreign born) father’s country of origin dummies.
in full time education for about 0.18 years for both groups. Interestingly, when condi-tioning on father’s education in addition, this coefficient drops from 1.8 to about 0.9 for natives, but not for immigrants, where it increases slightly to about 2 (results not reported), suggesting a strong correlation between parental education and permanent wages for the native born.
One explanation for the small coefficient we estimate for intergenerational corre-lation in education for immigrants is measurement error. As education of the foreign born is obtained abroad, it is more likely to be mis-coded than education obtained in the host country. This may lead to a downward bias in estimates; however, it is unlikely to fully explain the large difference in point estimates for foreign and native born father-son pairs.10
A further explanation is that it is permanent earnings rather than educational
10Assuming that measurement error is well-behaved, and taking the point estimates at face value,
the variance of the measurement error will need to be four times as large as the variance in fathers’ education to explain the difference in estimates between regression results for sons of foreign and native born fathers.
achievements of the father that drives educational outcomes of the son. This inter-pretation is compatible with the simple intergenerational permanent income model of Becker and Tomes (1986). The association between father’s permanent earnings and son’s education we estimate is basically identical for foreign and native born fa-thers, and is similar for school track choice (table 8). If education of the father affects son’s education mainly through father’s earnings, a low correlation between perma-nent earnings and education, as often found for immigrant communities, explains why some studies (like Gang and Zimmermann, 2000) find only a modest association of educational achievements between parent and offspring in immigrant samples.11
The last three columns in table 9 include the probability of a permanent migration as an additional regressor. Again, estimates suggest a strong relationship between this probability, and the total number of years of education, supporting the findings we report for school track choice. The effect is sizeable: increasing the probability of father’s permanent migration by one standard deviation increases the number of years of full-time education obtained by around 0.3.
5
Discussion and Conclusions
Earlier research by Borjas (1992) suggests that the way wealth and earnings potential is transmitted from one generation to the next may differ between immigrant and na-tive born communities. Borjas argues that for immigrants, the quality of the ethnic environment may provide an externality in the production of human capital of the next generation, which affects parental investments. In this paper we investigate a further
11Regressing father’s permanent earnings on his years of education results in a coefficient of 0.22
reason why parental investment may be different across immigrant groups: differences in parents’ assessment about a permanent or a temporary migration. Furthermore, we estimate and compare intergenerational correlation coefficients for education and per-manent earnings, distinguishing between immigrant and native born father-son pairs.
Our empirical analysis is based on a long panel that oversamples immigrants. The data provides unique and repeated information on permanent migration intentions of foreign born individuals. Estimating intergenerational correlation coefficients for father-son pairs of foreign and native born fathers, and taking account of measurement error using a flexible panel estimator based averaging method, we find intergenerational correlation coefficients of about 0.3 for father-son pairs with native born fathers, and about 0.4 for father-son pairs with foreign born fathers. One explanation for the larger point estimate for the foreign born is stronger correlation in unobserved endowments between generations in immigrant communities. This explanation is compatible with the similarly sized coefficients we obtain when relating son’s educational achievement to permanent parental earnings, and the way measurement error affects estimates of foreign vs native born father-son pairs.
We investigate two measures of educational attainment for sons: secondary school track choice, and total years of education. For both groups, father’s permanent earnings positively affect educational achievements of the son. For father-son pairs with native born fathers, we also find a strong correlation between educational attainment of father and son, while this correlation is small and insignificant for immigrants. We explain this with the low association between education and earnings for foreign born fathers: if parental earnings affect investment in child’s education, as suggested by the permanent income model of intergenerational mobility, then father’s education is a weaker proxy for permanent earnings for immigrants than for natives.
On the impact of fathers’ permanent migration propensities on sons’ outcomes, our evidence is consistent with our hypothesis. We find that son’s permanent wages are positively associated with the probability of the father’s permanent migration. In-vestigating investments into the son’s education, we find again a strong association between the probability of father’s permanent migration, and son’s educational attain-ments. These effects remain if we condition in addition on father’s education, or on father’s permanent earnings.
Our results suggest that the effect of permanent as opposed to temporary migration expectations on immigrants’ performance, as established for instance by Dustmann (1997) and Cortes (2004), are not restricted to the immigrant generation, but are likely to carry over to the next generation. The findings put into question migration schemes that are based on an initial temporary commitment of residence to the immigrant, which subsequently may result in permanent migrations, like schemes in Europe in the 1950’s-1970’s. These schemes may not only lead to suboptimal investments into the immigrant’s human capital at early stages of the migration cycle, when a permanent migration is uncertain, but also have unwanted dynastic effects on those immigrants who do not return, by lowering investments into the child.
6
References
• Bauer, P. and R. Riphan (2004), Heterogeneity in the Intergenerational Trans-mission of Educational Attainment: Evidence from Switzerland on Natives and Second Generation Immigrants, mimeo, University of Basel
• Becker, G.S. and N. Tomes (1979), An Equilibrium Theory of the Distribution of Income and Intergenerational Mobility, Journal of Political Economy, vol. 87, pp. 1153-1189.
• Becker, G and Nigel Tomes (1986), Human Capital and the Rise and Fall of Families, Journal of Labor Economics, vol. 4, no. 3, S1-S39.
• Bjoerklund, A. and M. Jantti (1997), Intergenerational Income Mobility in Swe-den compared to the United States, American Economic Review, 87, 1009-1018. • B¨ohning, W. (1987),Studies in International Migration, St. Martin’s Press, New
York.
• Borjas, G.J. (1985), Assimilation, Changes in Cohort Quality, and the Earnings of Immigrants, Journal of Labour Economics, 3, 463-489
• Borjas, George J. (1992), Ethnic Capital and Intergenerational Mobility, The Quarterly Journal of Economics, pp. 123 - 150.
• Borjas, George J. (1993), The Intergenerational Mobility of Immigrants, Journal of Labor Economics, 1993, Vol. 11, No.1, pp.113 - 135.
• Borjas, George J. (1994), Long-Run Convergence of Ethnic Skill Differentials: The Children and Grandchildren of the Great Migration, Industrial and Labor Relations Review, Vol. 47, No. 4 (July 1994), 553-573.
• Borjas, George J. (1994b), The Economics of Migration, Journal of Economic Literature 32,1667-1717
• Borjas, George J. (1995), Ethnicity, Neighbourhood, and Human Capital Exter-nalities, American Economic Review 85, 365-390
• Card, D., J. DiNardo and E. Estes (1998), The More Things Change: Immigrants and the Children of Immigrants in the 1940s, the 1970s, and the 1990s, NBER Working Paper 6519, April 1998.
• Carliner, Geoffrey (1980), Wages, Earnings and Hours of first, second and third generation American males, Economic Inquiry, 18, 87-102
• Chiswick, Barry (1977), Sons of Immigrants: Are they at an Earnings Disadvan-tage?, American Economic Review, 67, pp 376-380
• Chiswick, Barry (1978), The Effect of Americanization on the Earnings of Foreign-born Men, Journal of Political Economy 86, pp 897-921
• Couch, Kenneth A. and Thomas A. Dunn (1997), Intergenerational correlation in labour market status: a comparison of the United States and Germany, Journal of Human Resources 32: 210-232
• Cortes, Kalena E. (2004), Are Refugees Different from Economic Immigrants? Some Empirical Evidence on the Heterogeneity of Immigrant Groups in the United States, The Review of Economic and Statistics, Vol. 86, pp. 465-480 • Dearden, L., Machin and Reed (1997), Intergenerational Mobility In Britain, The
• Dustmann, Christian (1997), Differences in the Labour Market Behaviour be-tween Temporary and Permanent Migrant Women, Labour Economics, 4, pp. 29-46.
• Dustmann, Christian (1999), Temporary Migration, Human Capital and Lan-guage Fluency of Migrants, Scandinavian Journal of Economics, 101, 297-314. • Dustmann, Christian (2004), Parental background, secondary school track choice,
and wages, Oxford Economic Papers, 56, 209-230
• Galor, O., and O. Stark (1990), Migrants Savings, the Probability of Return Mi-gration, and Migrants Performance, International Economic Review 31:2 (1990), 463467.
• Gang, Ira N. and Klaus F. Zimmermann (2000), Is Child Like Parent? Educa-tional Attainment and Ethnic Origin,The Journal of Human Resources, XXXV, 3, Summer 2000, pp.550-569
• Nielsen, Rosholm, Smith and Husted (2001), Intergenerational transmissions and the school-to-work transition of 2nd generation immigrants, Centre for Labour Market and Social Research, Aarhus, Working Paper 01-04, February 2001 • Pischke, J.S. (1999), Does shorter schooling hurt student performance? Evidence
from the German short school years. mimeo, MIT
• Riphahn, Regina T (2001), Dissimilation? The Educational Attainment of Second-Generation Immigrants, CEPR Discussion Paper No. 2903
• Solon, Gary (1989), Biases in the Estimation of Intergenerational Earnings Cor-relations, The Review of Economics and Statistics, February 1989, 71, 172-97.
• Solon, Gary (1992), Intergenerational Income Mobility in the United States, The American Economic Review, June 1992, vol. 82, no. 3, pp.393-408.
• Solon, Gary (1999), Intergenerational Mobility in the Labor Market Handbook of Labor Economics, Vol. 3A. Orley C. Ashenfelter and David Card, eds. Ams-terdam: North-Holland, pp. 1761 - 1800.
• Solon, Gary (2002),Cross-Country Differences in Intergenerational Earnings Mo-bility, Journal of Economic Perspectives, Summer 2002, Vol.16, No.3, p.59-66. • Solon, Gary (2004), A Model of Intergenerational Mobility Variation over Time
and Place, in Miles Corak (ed.), Generational Income Mobility in North America and Europe, pp. 38-47, Cambridge: Cambridge University Press.
• Zimmerman, David (1992), Regression Toward Mediocrity in Economic Stature, The American Economic Review, June 1992, vol. 82, no. 3, pp.409-429.
• van Ours, J.C. and J. Veenman (2003), The educational attainment of second-generation immigrants in The Netherlands, Journal of Population Economics, 4, 711-739.
• Wiegand, Johannes (1997), Four Essays on Applied Welfare Measurement and Income Distribution Dynamics in Germany 1985-1995, PhD Dissertation, Uni-versity College London
Appendix: Tables
Table 10:
Years Foreign Born Fathers Native Born Fathers
observed Individuals Sum % Sum valid Sum % Individuals Sum % Sum valid Sum %
earnings spells spells spells spells
0 7 2.79 23 3.59 – – 1 8 5.98 8 0.31 23 7.19 23 0.31 2 7 8.76 22 0.85 17 9.84 57 0.78 3 13 13.94 61 2.36 23 13.44 126 1.73 4 6 16.33 85 3.29 32 18.44 254 3.49 5 13 21.51 150 5.82 28 22.81 394 5.42 6 11 25.90 216 8.38 23 26.41 532 7.32 7 20 33.86 356 13.81 18 29.22 658 9.06 8 6 36.25 404 15.67 29 33.75 890 12.25 9 15 42.23 539 20.91 31 38.59 1169 16.09 10 23 51.39 769 29.84 24 42.34 1409 19.40 11 19 58.96 978 37.95 25 46.25 1684 23.18 12 18 66.14 1194 46.33 29 50.78 2032 27.98 13 12 70.92 1350 52.38 25 54.69 2357 32.45 14 13 76.10 1532 59.44 43 61.41 2959 40.74 15 8 79.28 1652 64.10 33 66.56 3454 47.56 16 9 82.87 1796 69.69 39 72.66 4078 56.15 17 10 86.85 1966 76.29 35 78.13 4673 64.34 18 16 93.23 2254 87.46 71 89.22 5951 81.94 19 17 100.00 2577 100 69 100.00 7262 100 Total 251 – 2577 – 640 – 7262 –
Table 11:
Years Sons to foreign born fathers Sons to native born fathers
observed Individuals Sum % Sum valid Sum % Individuals Sum % Sum valid Sum %
earnings spells spells spells spells
0 173 51.80 – – 423 53.14 – – 1 48 66.17 48 7.92 68 61.68 68 3.73 2 31 75.45 62 18.15 63 69.60 126 10.64 3 12 79.04 36 24.09 47 75.50 141 18.37 4 21 85.33 84 37.95 25 78.64 100 23.85 5 10 88.32 50 46.20 24 81.66 120 30.43 6 9 91.02 54 55.12 31 85.55 186 40.63 7 7 93.11 49 63.20 22 88.32 154 49.07 8 9 95.81 72 75.08 21 90.95 168 58.28 9 5 97.31 45 82.51 22 93.72 198 69.13 10 4 98.50 40 89.11 20 96.23 200 80.10 11 1 98.80 11 90.92 9 97.36 99 85.53 12 – – – – 11 98.74 132 92.76 13 2 99.40 26 95.21 8 99.75 104 98.46 14 1 99.70 14 97.52 2 100.00 28 100.00 15 1 100.00 15 100.00 – – – – Total 334 – 606 – 796 – 1,824 –