Models for integrated pest control and their biological implications
Sanyi Tang
a,*, Robert A. Cheke
ba
College of Mathematics and Information Science, Shaanxi Normal University, Xi’an 710062, PR China b
Natural Resources Institute, University of Greenwich at Medway, Central Avenue, Chatham Maritime, Chatham, Kent, ME4 4TB, UK
a r t i c l e
i n f o
Article history:
Received 12 August 2007
Received in revised form 12 June 2008 Accepted 18 June 2008
Available online 28 June 2008 Keywords: Host–parasitoid model IPM Economic threshold Host–parasitoid ratio Initial density Outbreak frequency
a b s t r a c t
Successful integrated pest management (IPM) control programmes depend on many factors which include host–parasitoid ratios, starting densities, timings of parasitoid releases, dosages and timings of insecticide applications and levels of host-feeding and parasitism. Mathematical models can help us to clarify and predict the effects of such factors on the stability of host–parasitoid systems, which we illus-trate here by extending the classical continuous and discrete host–parasitoid models to include an IPM control programme. The results indicate that one of three control methods can maintain the host level below the economic threshold (ET) in relation to different ET levels, initial densities of host and parasitoid populations and host–parasitoid ratios. The effects of host intrinsic growth rate and parasitoid searching efficiency on host mean outbreak period can be calculated numerically from the models presented. The instantaneous pest killing rate of an insecticide application is also estimated from the models. The results imply that the modelling methods described can help in the design of appropriate control strategies and assist management decision-making. The results also indicate that a high initial density of parasitoids (such as in inundative releases) and high parasitoid inter-generational survival rates will lead to more frequent host outbreaks and, therefore, greater economic damage. The biological implications of this counter intuitive result are discussed.
Ó2008 Elsevier Inc. All rights reserved.
1. Introduction
Integrated pest management (IPM) is a long-term control strat-egy that combines biological, cultural, and chemical tactics to re-duce pest populations to tolerable levels when the pests reach an economic threshold (ET) (Fig. 1). IPM has been shown experimen-tally[10,35,36,44,45]to be more effective than classical methods (such as biological or chemical control only). Economic injury lev-els and ETs are important components of a cost effective integrated pest management programme and are useful for decision-making in the applications of pesticides [10,27,35,36,44,45,47]. An ET is usually defined as the number of insect pests in the field when con-trol actions must be taken to prevent the economic injury level from being reached and exceeded. For an IPM strategy, action must be taken once a critical density of pests is observed in the field so that the economic injury level is not exceeded (Fig. 1). Therefore, understanding and appropriate use of economic decision levels in dealing with pests can increase profits and maintain environmen-tal quality.
The use of economic thresholds, field monitoring, and record keeping are important parts of an IPM programme. These practices play a key role when making management decisions in an effective
IPM programme. Many factors have limited both the design of new economic thresholds and the development of existing ones. The ET is a complex value that is difficult to derive and requires estimation and prediction of several different parameters[27]. When using integrated pest management as an approach to control insect pests one must be committed to the long term. Therefore, regular field monitoring is needed to keep track of both pest and beneficial in-sect populations for an IPM programme to be effective. Proper identification of insect pests and a basic knowledge of economic thresholds are essential for an IPM programme to be successful and proper management of beneficial insects is important in order
to keep insect pests below the economic threshold
[10,35,36,44,45]. However, because of the uncertainties involved, particularly in pest population growth rates, accurate population estimates, and most ETs, are relatively crude.
One of the most interesting aspects of a dynamic systems ap-proach is that the proposed models can be used in a predictive way. Host–parasitoid interactions with integrated control methods have been modelled and investigated in attempts to identify fac-tors that stabilize such interactions [1,2,5,6,15–17,33,49,50, 53,54]. Factors affecting the population dynamics of the wasp Encarsia formosa and the whitefly Trialeuroides vaporariorum in greenhouse vegetable systems include host parasitoid ratios, the starting density and age structure of whitefly populations at the time of the first parasitoid releases[6,11], levels of host-feeding and parasitism[7], temperature, and the host plant[37]. Methods
0025-5564/$ - see front matterÓ2008 Elsevier Inc. All rights reserved.
doi:10.1016/j.mbs.2008.06.008
* Corresponding author. Tel.: +86 29 85310232.
E-mail addresses: [email protected], [email protected](S. Tang),
[email protected](R.A. Cheke).
Contents lists available atScienceDirect
Mathematical Biosciences
j o u r n a l h o m e p a g e : w w w . e l s e v i e r . c o m / l o c a t e / m b sused in these studies have included estimating correlations under non-experimental regimes between observed conditions and out-comes, conducting experiments to identify factors affecting popu-lation dynamics, and developing models to predict the dynamics of population interactions and the effects of parasitoid release regi-mens on whitefly population growth.
However, in these studies an integrated control strategy includ-ing biological control and chemical control was applied in each generation whether the density of host population exceeded the ET or not, which is not cost effective and may cause environmental problems due to frequent insecticide applications. Furthermore, most important factors for successful insect pest control, including the host outbreak period or frequency (i.e. the mean interval be-tween successive host upsurges above the ET), dosage and timing of insecticide application and instant killing rate, cannot be esti-mated and predicted. Therefore, one of the main purposes of this paper is to extend the classical continuous and discrete host–par-asitoid models to include several different control tactics and ETs. That is, an integrated control strategy is applied only when the host density reaches or exceeds the given ET. Recently, the sim-plest continuous predator–prey models concerning IPM strategy
have been developed and investigated [41–43]. Tang and Chen
[41], Tang and Cheke[42]investigated the simplest case of the
sys-tem developed in the present paper (i.e. the Lotka–Volterra prey– predator model with integrated control strategies and ET). The re-sults obtained in[41,42]imply that the simplest model exists rich dynamical behaviour including several different types of periodic solutions with the maximum amplitude no larger than the ET; Tang et al.[43]studied the prey-dependent consumption model with integrated control tactics and ET, and obtained the similar re-sults as those in[41,42]. Results from these studies can help in the design of a control strategy by informing decisions on dosages and frequencies of insecticide applications and on the timing of natural enemy releases.
For the models proposed in this paper, one of the most impor-tant questions that we want to answer is when does the pest population reach or exceed the ET level? That is, when should an IPM strategy be applied (i.e. host outbreak period or
fre-quency), how many natural enemies should be released and what fraction of the insect pest population should be killed to avoid economic damage at that time? To answer these questions, we consider two possible cases according to different levels of ET. If the ET is less than the steady state value (or maximum ampli-tude of oscillation solutions) of the pest population in systems without an IPM strategy, any solution of a system with an IPM strategy will reach or exceed the ET an infinite number of times. If the ET is larger than the steady state value (or maximum ampli-tude of oscillation solutions) of the pest population of systems without an IPM strategy, our results show that a successful con-trol strategy depends on several factors. Furthermore, if the re-lease rate is extremely high (inundative rere-lease) or the parasitoid intergenerational survival rate is relatively large, we have found that the dosages, timing of insecticide applications and parasitoid release rates are very difficult to ascertain due to the complex dynamical behaviour of the system.
2. The models
2.1. Basic framework of host–parasitoid models
Models of biological control have a long history of theoretical development that have focused on the interactions between a par-asitoid and its host[17]. Studies of host–parasitoid systems have identified several important and general factors affecting the long-term dynamics of interacting populations, with practical implications for the biological control of insect pests[28]. Analyt-ical models, in particular, have proved useful, since their relative simplicity allows study of those factors affecting the stability and depression of the host equilibrium that are attributable to parasit-ism. Of the two classical candidate models developed in the past, one is a continuous-time model (differential equations) and the other a discrete-time model (difference equations). In this paper, we focus on both types of models, aiming to establish the basic framework on how to model host–parasitoid systems with an IPM control strategy, and discuss possible applications in pest con-trol and the biological implications.
ET EIL
Time
Time 1 Time 2
Number of insects
Fig. 1.Economic injury level (EIL) = lowest population density that will cause economic damage. Economic threshold (ET) = population density at which control measures should be determined to prevent an increasing pest population from reaching the economic injury level. The arrow indicates the point where pest levels exceeded the economic threshold and an IPM strategy would be applied.
The differential model, originally developed to explore verte-brate predator–prey interactions[25,48], updates both parasitoid and host populations continuously and so includes within-genera-tion dynamics as well as between-generawithin-genera-tion dynamics[25,30]. So when host generations are overlapping, a differential equation framework is more suitable to represent a coupled host–parasitoid system in continuous time:
dH dt¼b1ðHÞHfðH;PÞP; dP dt¼
c
1fðH;PÞPl
P; ( ð1ÞwhereHandPare the population abundance of host (any stage but in general adults) and parasitoid (generally adult female), respec-tively,b1(H) is the per capita net rate of increase,f(H,P) is the per capita functional response of the parasitoid or the rate of host attack
[22,23],
l
represents the per capita death rate of the parasitoidpop-ulation, and
c
1 denotes the conversion efficiency of hosts to parasitoids.A classical discrete-generation host–parasitoid interaction was developed by Nicholson and Bailey[32]. It is well known that the Nicholson–Bailey model has a positive fixed point and it is never stable. A number of stabilizing factors such as spatial heterogene-ity, non-random search, density-dependent growth of the host, functional responses of the parasitoid, and mutual interference among searching parasitoids were put forward in order to stabilize
coexistence in single host–single parasitoid systems
[3,4,14,17,18,26]. A difference equation framework for a coupled, synchronized host–parasitoid system with discrete generations can be written as following the generalized model:
Htþ1¼b2ðHtÞHtgðHt;PtÞ; Ptþ1¼
c
2Ht½1gðHt;PtÞ þdPt;
ð2Þ
whereHtandPtare the host and parasitoid population abundance
in generationt, respectively,b2(H) is the per capita net rate of in-crease of the host population,g(H,P) is the proportion of host indi-viduals that escape attack by the parasitoid,
c
2 embodies the numerical response or the average number of parasitoids that emerge per host individual parasitized andd(d> = 0) denotes the density-independent survival of parasitoid propagules at generation t. The parasitoid intergenerational survival rate can be affected by several different factors such as immigration from outside the local area, parasitoid overwintering survival and parasitism of an alter-nate insect pest which is not modelled explicitly.The functional response of a consumer to a change in the den-sity of a resource is generally understood to be the rate at which an individual consumer extracts resources as a function of resource density. Holling [22,23] presented three different functional re-sponse classes, for which the following are nominal forms: type I (linear then constant), type II (decelerating rise to an upper asymp-tote), and type III (sigmoidal). Among the three types of functional response, types II and III have received the most attention. The most widely used model for describing the functional response of parasitoids is the disk equation of Holling’s type II. In the present paper, as an example, we assume that the production of hosts (in the absence of parasitoid) follows the usual logistic growth, i.e. we have b1ðHÞ ¼r 1H K ; b2ðHÞ ¼exp r 1H K ; ð3Þ
whereris the intrinsic growth rate, andKis the carrying capacity of the environment. The host-dependent functional response is of the Holling’s type II form, i.e. we have
fðH;PÞ ¼
a
TH 1þa
ThH ; gðH;PÞ ¼expa
TP 1þa
ThH ; ð4Þwhere
a
is the instantaneous search rate, i.e. the average number of encounters with hosts per parasitoid per unit of searching time,T the total time initially available for search, i.e. the total time the hosts are exposed to parasitoids andThthe handling time, i.e. the time between a host being encountered and search being resumed. We should emphasize here that many other growth functions including the Beverton–Holt (discrete model) and the Gompertz growth (continuous model) functions have been proposed for the host population, as have several other host-dependent functional response functions such as Holling’s types I and III. Different combi-nations of those functions result in different host–parasitoid sys-tems and different dynamical behaviour.The continuous-time host–parasitoid model (1) with various growth functions b1(H) and functional responsesf(H,P) has very simple dynamics, which include only stable equilibrium or limit cycles[17,29,31]. Nevertheless, Beddington et al.[3]showed that in discrete-time host–parasitoid models the dynamics can produce a much richer set of patterns than those observed in continuous-time models, which include coexistence, period doubling bifurca-tion and chaotic solubifurca-tions[3,4,14,17,18,26].
2.2. Host–parasitoid models with economic threshold
The discrete nature of human actions and possible exogenous effects leading to pest population densities changing very rapidly can be taken into account by impulsive differential or difference equations. For instance, impulsive reduction of the pest population density of a given species is possible after its partial destruction by trapping or by poisoning with chemicals. An impulsive increase of a controlling predator or parasitoid population density is possible by artificial breeding and releases.
In this section, we will extend models(1) and (2)by introducing an IPM strategy such as releasing natural enemies or spraying pes-ticide when the density of the host population reaches ET (Fig. 1). Mathematically, it is easy to extend model(1)with ET due to the continuity of solutions. It follows from model (1) that we have the following model concerning IPM strategies:
dHðtÞ dt ¼b1ðHÞHfðH;PÞP; dPðtÞ dt ¼
c
1fðH;PÞPl
P; ) HðtÞ<ET; HðtþÞ ¼ ð1q1ÞHðtÞ; PðtþÞ ¼ ð1þq2ÞPðtÞ þs
; HðtÞ ¼ET; Hð0þÞ ¼H0<ET; Pð0þÞ ¼P0; 8 > > > > > > < > > > > > > : ð5ÞwhereH(t+) andP(t+) denote the numbers of hosts and parasitoids after a control strategy applied at timet, andH(0+),P(0+) denote the initial densities of host and parasitoid populations. Throughout this paper we assume that the initial density of the host population is always less than ET. Otherwise, the initial values are taken after an integrated control strategy application. In model(5)06q1< 1
is the proportion by which the pest density is reduced by killing or trapping once the number of pests reaches ET, whileq2P0 is a proportion for the release rate of parasitoids and
s
P0 is the con-stant number of natural enemies released at this timet. Recently, some special cases of system (5)with or without impulses have been extensively used to investigate pest control [1,12,13,41– 43,52].For any solution of(5)with initial condition (H0,P0), one of the following three cases must occur: (a) the maximum value of the host population always remaining below ET; (b) reaching ET a fi-nite number of times; and (c) reaching ET an infifi-nite number of times. Consequently, we denote the time points at which the solu-tion reaches ET astn(n= 1, 2,. . .) and an IPM control programme is
applied. Further, denote
witht0= 0 as host outbreak duration (or period), wherenmay be finite or infinite which depends on the solutions of the models.
However, the solutions of discrete models do not exactly cross through ET due to the discontinuity and complexity of their dynamical behaviour. Usually, the solutions may suddenly jump above or below ET at some generations. If this happens, the control tactics including biological control and cultural control usually are not capable of reducing the density of the host population below the ET immediately, due to the response delay. Thus, an insecticide application is needed at this generation because insecticides are easy to apply, fast-acting, and in most instances can be relied on to control the pests. However, the complete reliance on insecti-cides is an undesirable approach to insect control because insect pests may quickly become resistant to chemical pesticides. There-fore, convenient and effective management tools should be incor-porated into an IPM programme.
For example, if the insect pest has an outbreak and exceeds the ET at generationk(k> 0), i.e.b2(Hk)Hkg(Hk,Pk) > ET, an insecticide
application needs to be applied and at least a number of Td
kb2ðHkÞHkgðHk;PkÞ insect pests should be killed such that
ð1TdkÞb2ðHkÞHkgðHk;PkÞ ¼ET, where 1Tdk is the survival rate
proportion at generationkafter an insecticide application, which depends on the densities of host and parasitoid populations. In or-der to control it more effectively, other control tactics including biological control are applied at the same time. Thus, based on the model(2)we have the following extended model:
Htþ1¼minfb2ðHtÞHtgðHt;PtÞ;ETg; Ptþ1¼
c
2Ht½1gðHt;PtÞ þdPt; Ptþ1þ¼ ð1þq2ÞPtþ1þs
; ifHtþ1¼ET; H0þ¼H0<ET; P0þ¼P0; 8 > > > < > > > : ð7Þwhere min{b2(Ht)Htg(Ht,Pt), ET} denotes the minimum value of
b2(Ht)Htg(Ht,Pt) and ET,q2P0 is a proportion for the release rate
of the parasitoids and
s
P0 is the constant number of natural ene-mies released at generationt. The instant killing rate by an insecti-cide application can be calculated as follows:Tdt ¼ 1 ET b2ðHtÞHtgðHt;PtÞ; ifb2ðHtÞHtgðHt;PtÞ>ET; 0; otherwise: ( ð8Þ
For more generality, when the insect pest has an outbreak and ex-ceeds the ET at generation k, we apply an insecticide such that
ð1Td
kÞb2ðHkÞHkgðHk;PkÞ ¼ ð1q1ÞET, and then we have the
fol-lowing model: Htþ1¼b2ðHtÞHtgðHt;PtÞ; Ptþ1¼
c
2Ht½1gðHt;PtÞ þdPt; if b2ðHtÞHtgðHt;PtÞ6ET; Htþ1þ¼ ð1q1ÞET; Ptþ1þ¼ ð1þq2ÞPtþ1þs
; if b2ðHtÞHtgðHt;PtÞ>ET; H0þ¼H0<ET; P0þ¼P0; 8 > > > > > < > > > > > : ð9Þwhere 06q1< 1 is the proportion by which the pest density is
re-duced by killing or trapping once the number of pests exceed ET. In particular, the above model can be reduced to the model(7)if q1= 0.
In the present paper, we will focus on the models(5) and (7). It is clear that the models(5) and (7)involve the key factors of an IPM control strategy including ET, instant killing rate (q1in model(5) andTdt in model(7)), dosage and timing of insecticide application
ðTcnandT
d
tÞ, and the release rate of natural enemies (q2and
s
). Thisclarifies that models(5) and (7)can be used to estimate and predict densities of host–parasitoid populations, help in the design of an appropriate control strategy, make management decisions, control insect pests such that the pest population lies below ET and avoid economic loss. In particular,Tc
nin Eq.(6)andT
d
t in Eq.(8)give us
necessary information to make management decisions on how to successfully implement an IPM programme. In what follows, we numerically investigate models(5) and (7)to find possible factors that affect an IPM programme including initial density, host–para-sitoid ratios and augmentation methods (inoculative or inundative release), and to find the relations among ET, stable states of sys-tems and control methods.
3. Results
In practice, the smaller ET is, the more often control strategies need to be applied. Meanwhile, the dynamic behaviour of models
(1) and (2)in combination with the level of the ET may provide
useful information to determine which control strategies should be applied, such as a periodic control strategy or control a finite number of times. As noted before, the continuous model(1)only has a stable equilibrium or limit cycles, which means that any tra-jectory of model(5)will reach the ET infinite times if the given ET is less than the steady state value of the host population in model
(1). Similarly, any trajectory of model(7) will reach ET infinite
times if the given ET is less than the steady state value or the max-imum value of multi-point cycles or the maxmax-imum value of oscilla-tion soluoscilla-tions. If this happens, one of the best control methods is to design the periodic control strategy which can be actually esti-mated and predicted by our model presented here.
3.1. Periodic control strategy and its impact factors
Effective testing of parasitoid release strategies and killing rates of hosts by an insecticide application requires accurate estimates of the numbers of the hosts and parasitoids in the population. In what follows, the parameters in models(5) and (7)are fixed such that the ET is less than the steady state value or maximum value of oscillation solutions of the host population, the parameter sets used inFigs. 2 and 3being examples. The results shown in these two figures imply that for models(5) and (7)periodic oscillations with the maximum value below the ET do exist, as expected.
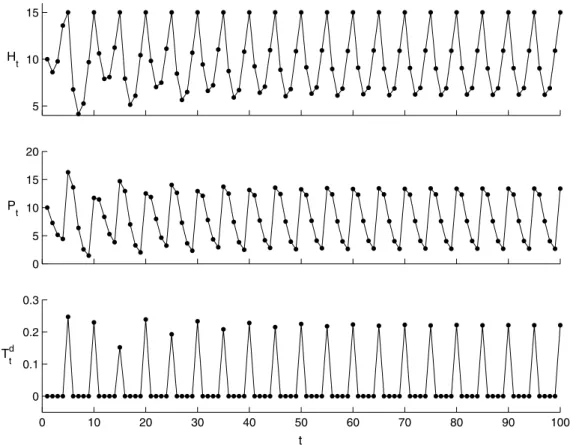
For the continuous model(5),Fig. 2shows that the host and parasitoid periodically oscillate with a period of approximately 2.7934, the stable value of sequenceTcn shown at the bottom of Fig. 2. This period also tells us when the host population will reach the ET for the given initial densities and when the control strate-gies should be applied. This indicates that we can use the model to predict the host–parasitoid dynamic behaviour for given initial densities. The results shown inFig. 3indicate that host–parasitoid populations in model(7)periodically oscillate with period 5, and the sequence ofTnt shown at the bottom ofFig. 3implies that the
instant killing rate of the host population by an insecticide applica-tion stabilizes at 0.221, which provides the dosages and timing of insecticide applications.
From the biological point of view, the effective testing of para-sitoid release strategies and timing of insecticide applications
re-quire the use of replicated treatments in independent
greenhouses[19,20]and the use of experimental controls either in cages[34]or separate greenhouses[19,20]. Thus, experimental methods in combination with the model approaches presented in this paper are the most cost effective method. However, the intrin-sic growth rate of hosts,r, parasitoid searching efficiency,
a
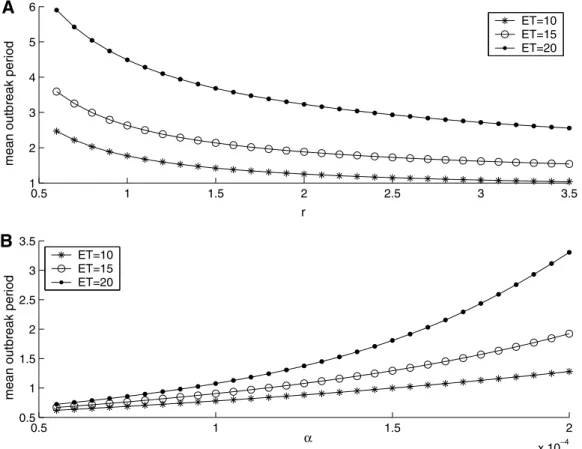
, and other factors (such as ET) can vary among host and parasitoid spe-cies. How do these factors affect the control strategies?The effect of host intrinsic growth rate and parasitoid searching efficiency on host mean outbreak period (or outbreak frequency) can be calculated from the models(5) and (7)numerically (Figs. 4 and 5). Mean host outbreak period is an average over several host outbreaks or host cycle periods. Model(5)predicts that the mean outbreak period is decreasing as host intrinsic growth rate
in-11 12 13 14 15 16 20 30 40 50 0 10 20 30 40 50 60 70 80 90 100 0 1 2 3 t H t Pt T n c
Fig. 2.Periodic solution of model(5)withr= 0.9,T= 100,Th= 1,a= 0.0002,K= 150,c= 0.4,q1= 0.22,q2= 0.2,s= 10, and ET = 15. The stable value of sequenceTc
ntends to
2.7934, the host outbreak period. Initial densities are (H0,P0) = (10, 10).
5 10 15 Ht 0 5 10 15 20 Pt 0 10 20 30 40 50 60 70 80 90 100 0 0.1 0.2 0.3 t Ttd
Fig. 3.Periodic solution of model(7)withr= 0.9,T= 100,Th= 1,a= 0.001,K= 150,d= 0.1,q2= 0.2,s= 10, and ET = 15. The period is five generations. The positive values of
sequenceTd
0.5 1 1.5 2 2.5 3 3.5 1 2 3 4 5 6 r
mean outbreak period
ET=10 ET=15 ET=20 0.5 1 1.5 2 x 10⁻⁴ 0.5 1 1.5 2 2.5 3 3.5 α
mean outbreak period
ET=10 ET=15 ET=20
Fig. 4.The mean outbreak period of model(5), as a function ofr(0.5 <r< 3.5) in (A) witha= 0.0002, and as a function ofain (B) withr= 1.9. The other parameters are fixed
as follows:T= 100,Th= 1,K= 150,d= 0.1,q1= 0.22,q2= 0.2, ands= 10. Initial densities are (H0,P0) = (10, 10). Simulations were run for 200 host outbreak events to rule out
transients, and the last 100 points of sequenceTc
nwere used to determine the average outbreak period.
1 2 3 4 5 6 7
mean outbreak period
1 1.5 2 2.5 3 3.5 0 0.1 0.2 0.3 0.4 0.5 r
mean killing rate
1 2 3 4 5 6
mean outbreak period
0.5 1 1.5 2 2.5 3 3.5 x 10⁻³ 0 0.2 0.4 0.6 0.8 α
mean killing rate
Fig. 5.The mean outbreak period and mean killing rate of model(7), as a function ofrin (A) and (B) witha= 0.001, and as a function ofain (C) and (D) withr= 1.9. The other
parameters are fixed as follows:T= 100,Th= 1,K= 150,d= 0.1,q2= 0.2,s= 10, and ET = 15. Simulations were run for 2000 iterations to rule out transients, and the last 200
iterates were used to determine the average outbreak period and the mean killing rate from sequenceTd
creases, and the higher ET is, the stronger the effect that it has (Fig. 4(A)). Conversely, model(5)predicts that efficient searchers (large
a
) prolong the mean outbreak period, but, once again, the higher ET is, the stronger is its effect (Fig. 4(B)). However, the effect of these factors on model(7)is more complex (Fig. 5). One of the main differences is that different host intrinsic growth rates and different parasitoid characteristics may have the same mean out-break period. But the largerresults in a high instant killing rate (Fig. 5(A) and (B)), while efficient searchers (largea
) reduce the in-stant killing rate (Fig. 5(C) and (D)).3.2. The effects of various host–parasitoid ratios on IPM
If the given ET is relatively large (for example larger than the steady state values or the maximum amplitude of oscillation solu-tions of the host population), successful control strategies largely depend on the initial density and host–parasitoid ratios. To show this, from now on we assume that the ET level is larger than the steady state value or the maximum amplitude of oscillation solu-tions of the host population, and investigate the effect of initial densities and host–parasitoid ratios on insect pest control.
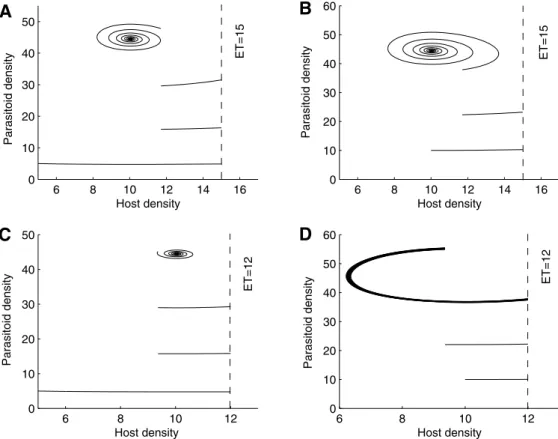
For model(5), if all parameter values are fixed as inFig. 6, the stable steady state of model(1)isE1withE1= (10.04, 44.498). So the ET level (ET = 15 or 12) is larger then 10.04. The results shown
inFig. 6provide some examples of possible cases. InFig. 6(A) the
initial densities of host–parasitoid populations are (5, 5) and the simulation result indicates that the trajectory eventually tends to the stable steady stateE1 after three integrated control applica-tions. If we set the initial densities as (10, 10),Fig. 6(B) indicates that the trajectory eventually tends to the stable steady stateE1 after two integrated control applications. However, if we slightly reduce the ET from 15 to 12 and keep the same initial densities as in Fig. 6(A) and (B), Fig. 6(C) shows the same results as
Fig. 6(A). While we have a totally different result shown in
Fig. 6(D) (comparing withFig. 6(B)), here a periodic control
strat-egy is needed for the initial densities (10, 10) and ET = 12. It follows from the trajectories shown inFig. 6that different host–parasitoid initial densities and ET levels may result in different control strat-egies. Similar results are obtained if we increase or decrease the host–parasitoid ratios (not shown here).
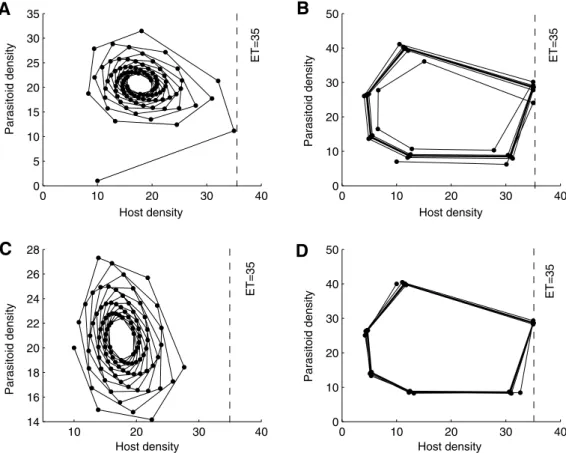
Similarly, if we fix all parameters of model(7)as inFig. 7and chose various starting densities of host–parasitoid populations, it
follows that model (2) has a stable steady state E2 with
E2= (17.57, 20.75). The trajectory shown in Fig. 7(A) with initial densities (H0,P0) = (10, 1) indicates that the solution approaches the steady stateE2after one integrated control application. When we choose the initial densities as (10, 7), the trajectory shown in Fig. 7(B) indicates that the host population will have outbreaks an infinite number of times and a periodic control strategy is needed in this case. But if we increase the initial density of the par-asitoid population to 20, the solution is free of impulsive effect and directly tends to theE2. In this case, we see that the natural ene-mies can successfully suppress the host outbreak and result in a stable system between host and parasitoid. While if the initial den-sity of the parasitoid is further increased to 40,Fig. 7(D) implies that a periodic control strategy is needed to control the host pop-ulation and avoid economic damage. This confirms that inundative release of a parasitoid population is not necessarily beneficial for insect pest control, which we will show in more detail later.
We have conducted many other numerical simulations (not shown here) on models(5) and (7)with different initial densities and different host–parasitoid ratios, and found that there are only three possible control cases that models(5) and (7)have: (a) infi-nite repeats of integrated control tactics such as in periodic control strategies (Figs. 6(D) and 7(B) and (D)); (b) finite numbers of grated control tactics (Figs. 6(A)–(C) and 7(A)); and (c) no
inte-6 8 10 12 0 10 20 30 40 50 60 Host density Parasitoid density 6 8 10 12 0 10 20 30 40 50 Host density Parasitoid density 6 8 10 12 14 16 0 10 20 30 40 50 60 Host density Parasitoid density 6 8 10 12 14 16 0 10 20 30 40 50 Host density Parasitoid density ET=15 ET=15 ET=12 ET=12
Fig. 6.Illustrating the effects of ET and initial densities of host and parasitoid populations of model(5)on the IPM strategies. The parameters are fixed as follows:r= 1.9,
grated control required (Fig. 7(C)). These results clarify that the models proposed here can help us to understand host–parasitoid interactions, help us to design appropriate control strategies and to make management decisions in insect pest control.
3.3. Efficacy of release rates and their effect on insect pest control It is somewhat counter intuitive to suppose that a high initial density of parasitoids leads to more severe host outbreaks and, therefore, to greater economic damage (for exampleFig. 7(D)). In order to understand how the number of parasitoids released affects host outbreaks in more detail, we fix all parameter values inFig. 8 exceptq2, the proportional release rate of the parasitoid popula-tion. The bifurcation diagram with respect toq2shown inFig. 8 indicates that the dynamic behaviour of the modelled host–para-sitoid populations are very complex, including period doubling bifurcation and chaotic solutions as q2 increases. In particular, the time series ofTcnconfirms that the larger the parasitoid release
rate is, the harder implementation of control applications becomes. The complex outbreak period shown in the sequence forTcn con-firms that inundative parasitoid release will result in unexpected secondary host outbreaks. This counterintuitive result indicates that contrary to a priori assumptions, indundative releases may be counter-productive by leading to more not fewer host outbreaks per unit of time. Similar results can be obtained for model(7).
3.4. The effect of intergenerational survival rates
To investigate how the parasitoid intergenerational rated af-fects control programmes, we have tested several differentd val-ues, and the simulation results imply that model(7) has strong periodicity even with high intrinsic growth rate,r, ifdis relative
small. However, the dynamical behaviour becomes more and more complex asdincreases (Fig. 9). It follows fromFig. 9that if the par-asitoid intergenerational survival rate is large enough (here d= 0.8), the model(7)has complex dynamical behaviour even with a very low host intrinsic growth rate. In particular, the time series shown at the bottom ofFig. 9implies that the host outbreak period and instant killing rate are extremely complex. From a biological point of view, a high parasitoid intergenerational survival rate means a high initial parasitoid density in the next generation, and then the high initial density of parasitoids may lead to more severe host outbreaks.
4. Discussion
In biological control introductions, relatively few natural ene-mies may be released at a critical time of the season (inoculative release) or literally millions may be released (inundative release). An example of inoculative release occurs in greenhouse production of several crops. Periodic releases of the parasitoid,E. formosa, are used to control greenhouse whiteflyTrialeurodes vaporariorum, and the predaceous mite,Phytoseiulus persimilis, is used for control of the two-spotted spider miteTetranychus urticae[21]. The periodic inundative release of parasitoids has also been attempted against several species and has been successful against a few[38,39]. Here, we have extended the classical continuous and discrete host–par-asitoid models to include an IPM control strategy in order (a) to understand why different release methods result in different pest control outcomes; (b) to estimate and predict the timing of an inte-grated control application and the dosage of insecticide applica-tions, and (c) to investigate the effects of initial densities of host– parasitoid populations and host–parasitoid ratios on insect pest control. To do this, the logistic growth rate of the host population
0 10 20 30 40 0 5 10 15 20 25 30 35 Host density Parasitoid density 0 10 20 30 40 0 10 20 30 40 50 Host density Parasitoid density 10 20 30 40 14 16 18 20 22 24 26 28 Host density Parasitoid density 0 10 20 30 40 0 10 20 30 40 50 Host density Parasitoid density ET=35 ET=35 ET=35 ET=35
Fig. 7.The effects of ET and initial densities of host and parasitoid populations of model(7)on the IPM strategies. The parameters are fixed as follows:r= 1.9,T= 100,Th= 1,
and the Holling’s type II functional response function, as an exam-ple, are investigated in this paper.
The results presented here indicate that a number of factors may affect successful IPM programmes, including ET level, parasit-oid search efficiency, intergenerational survival rate, initial densi-ties and host–parasitoid ratios. One of the basic factors affecting host abundance is the numbers of hosts killed by parasitoids, which is affected by host density and the size of the regulating par-asitoid population, which, in turn, is influenced by the host avail-ability[14].
Two possible cases are investigated according to the relations between host population and its ET level. When the ET level is rel-atively small (here less than the stable steady state value or the maximum amplitude of oscillation solutions of the host population (Figs. 2 and 3)), numerical simulations indicate that a periodic con-trol strategy is the best choice. The results obtained in the present paper indicate that host–parasitoid populations periodically oscil-late with maximum amplitude below ET. Under these circum-stances, we have used the models to numerically calculate the host outbreak period and instantaneous killing rate of the host population by an insecticide application. Further, the effects of the intrinsic growth rate, parasitoid searching efficiency, and other factors (such as ET) on mean host outbreak period and instant kill-ing rate are investigated. The results indicate that the mean out-break period decreases as the host intrinsic growth rate increases, and the higher ET is, the stronger is its effect. Conversely, efficient searchers prolong the mean outbreak period but, as be-fore, the higher ET is, the stronger is its effect.
When the ET level is larger than the stable steady state value or the maximum amplitude of oscillation solutions of the host popu-lation, the design of desirable control strategies (for example for
cost effectiveness) becomes much more difficult. Because, in this case, there are more factors which may affect successful IPM pro-grammes in the sense of cost effectiveness. For example, different initial densities and host–parasitoid ratios may result in different timings of IPM applications. The most important is that the parasit-oid can successfully suppress the host population below ET if we correctly control the initial densities of host and parasitoid (Fig. 7(C)). Furthermore, our results suggest that these factors can lead to completely different IPM requirements in real management contexts including the need for infinite numbers of applications, a finite number of applications or no applications at all, but the pre-cise details would need clarification by incorporating our models into more complex, system-specific, predictive models.
The time series ofTc
nandT
d
t provide several important points
about the key roles in insect pest control played by host outbreak period (frequency), dosage (instant killing rate of host by an insec-ticide application) and time of insecinsec-ticide application. Moreover, the two time series can be calculated numerically from the models (5) and (7), which confirms that the modelling methods proposed here can also be implemented into more complex models used to drive management decisions.
The results also indicate that high parasitoid release rates (inundative release) and high parasitoid intergenerational survival rates may result in complex dynamic behaviour such as in the time series ofTc
nandT
d
t. These results show that inundative release of
parasitoids may cause more frequent host outbreaks and hence more pest damage, which agrees with the following facts: high parasitoid densities or high host–parasitoid ratios may result in longer development time and smaller size of parasitoid progeny, due to possible differences in nutritional quality as a consequence of host-feeding or superparasitism, resulting in exhaustion of food Fig. 8.Bifurcation diagrams of model(5). For each value of the parameterq2, model(5)is integrated for 300 IPM strategy applications. (A) The last 200 minimum values of the
host population between each outbreak duration are plotted for 400 values ofq2over [0, 10]. (B) The last 200 points of the parasitoid population at the time of IPM strategy
applications are plotted for 400 values ofq2over [0, 10]. (C) The last 200 outbreak periodsTc
nare plotted for 400 values ofq2over [0, 10]. The other parameters are fixed as
for developing parasitoids. As parasitoid–host ratios increase, it is possible that parasitoids are able to select more suitable hosts, with the result that, on average, the progeny are larger, live longer, and develop more rapidly. Simmonds[40]and Wylie[51]reported that parasitoid larvae take longer to develop in superparasitized hosts than in singly-parasitized hosts. Biologically, our results con-firm that if too few parasitoids are released, control is too slow for effective pest management and may occur after the economic threshold density of the pest has been exceeded. If too many par-asitoids are introduced, one risks extermination of the pest and consequently also of the natural enemy, perhaps followed by pest immigration and resurgence and secondary outbreaks[8,9,37].
Such phenomena have been observed in experiments. Searching efficiency may decrease with increasing parasitoid density [24], due to phenomena such as mutual interference, and sometimes this will benefit the host population. For instance, as the number ofE. formosareleased per plant increased, their efficacy decreased, andBemisia argentifoliisurvivorship increased[19,20]. Numerical simulations from the models presented in this paper offer an explanation. Parasitoids with high initial density rapidly suppress the host population causing parasitoid numbers to rapidly decline. Following the crash, the host population recovers faster than the parasitoid population allowing a long severe outbreak before par-asitoids can control the hosts once more. Experimental observa-tions show that inundative releases of parasitoids often achieve higher initial wasp-whitefly nymph ratios and at these higher ra-tios host-feeding and superparasitism reach high levels, which re-sult in extinction of pest and parasitoid [8,9]. Reinvasion of greenhouses by whiteflies and subsequent uncontrolled pest pop-ulation growth may then result[46].
Extensive numerical bifurcation analysis confirmed that the dynamical behaviour obtained for models (5) and (7) can exist
for a wide range of parameters. Thus, the choice of which parame-ters to vary, and what values to use is unimportant, as many others would give similar results and reproduce most of the behaviour shown in this paper.
The effects of different host–parasitoid ratios on the efficacy of the parasitoidEretmocerus mundusattacking the silverleaf whitefly B. argentifoliiwas experimentally investigated by Jones et al.[24]. Their results showed that different host–parasitoid ratios can sig-nificantly affect host mortality, the numbers of hosts killed and the numbers of female parasitoid progeny per female, and the most efficient ratio was one parasitoid female per 10 second instar host nymphs. However, in order to improve integrated control of an in-sect pest and to obtain a better understanding of host–parasitoid interactions, detailed model studies are necessary, which can pro-vide more simulated data on host–parasitoid interactions and model parameter estimations.
As noted in Section1, the previous work on this topic mainly fo-cused on the simplest continuous predator–prey models concern-ing IPM strategies [41–43]. They theoretically obtained several biologically desirable solutions including a pest-eradication peri-odic solution and positive periperi-odic solutions with maximum pest amplitude below ET. In the present paper, however, we extend the simplest continuous model to a quite general modelling frame-work, which allows us to investigate the effects of ET level, parasit-oid search efficiency, intergenerational survival rate, initial densities and host–parasitoid ratios on the IPM programmes in more detail. Moreover, the corresponding discrete version model has been developed which is much more realistic for the insect species with discrete population generation. For each type of mod-els, the time series ofTcn(for continuous model) andT
d
t(for discrete
model) have been introduced, and they are quite important to jus-tify how to implement an IPM strategy in pest control. In particu-Fig. 9.Bifurcation diagrams of model(7). For eachrthe 1001 first simulated values are omitted to remove the initial transients and only the next 200 values are plotted. (A)
The host populations are plotted for 600 values ofrover [1, 4]. (B) The parasitoid populations are plotted for 600 values ofrover [1, 4]. (C) The host-killing rateTd
tare plotted
lar, the two times series can indicate us when the pest population reach or exceed the ET level, how many natural enemies should be released and what fraction of the insect pest population should be killed to avoid economic damage, which are not investigated in the previous studies[41–43].
The results of the present study serve to increase our knowledge of the effects of different factors on the success of IPM pro-grammes. They also serve to provide information for long-term studies on insect pest control. However, the present study focused entirely on the simplest continuous and discrete models with ET level and the temporal interactions of an insect host and its para-sitoid. A number of additional factors such as spatial heterogeneity and environmental noise will be considered in the future and re-ported elsewhere.
References
[1] H.J. Barclay, Models for pest control using predator release, habitat management and pesticide release in combination, J. Appl. Ecol. 19 (1982) 337. [2] H.J. Barclay, Models for pest control: complementary effects of periodic
releases of sterile pests and parasitoids, Theor. Popul. Biol. 32 (1987) 76. [3] J.R. Beddington, C.A. Free, J.H. Lawton, Dynamic complexity in predator–prey
models framed in difference equations, Nature 255 (1975) 58.
[4] J.R. Beddington, C.A. Free, J.H. Lawton, Characteristics of successful natural enemies in models of biological control of insect pests, Nature 273 (1978) 513.
[5] T. Burnett, Effect of host distribution on the reproduction ofEncarsia formosa
Gahan (Hymenoptera: Chalcidoidea), Can. Entomol. 90 (1958) 179. [6] T. Burnett, Effects of initial densities and periods of infestation on the growth
forms of a host and parasite population, Can. J. Zool. 38 (1960) 1063. [7] T. Burnett, Aspects of the interaction between a chalcid parasite and its
aleurodid host, Can. J. Zool. 45 (1967) 539.
[8] M.H. Eggenkamp-Rotteveel Mansveld, J.C. van Lenteren, J.M. Ellenbroek, J.
Woets, The parasite–host relationship between Encarsia formosa(Hym.,
Aphelinidae) and Trialeurodes vaporariorum (Hom., Aleyrodidae). XII.
Population dynamics of parasite and host in a large, commercial glasshouse and test of the parasite-introduction method used in the Netherlands, Z. Ang. Entomol. 93 (1982) 113.
[9] M.H. Eggenkamp-Rotteveel Mansveld, J.C. van Lenteren, J.M. Ellenbroek, J.
Woets, The parasite–host relationship between Encarsia formosa (Hym.,
Aphelinidae) and Trialeurodes vaporariorum (Hom., Aleyrodidae). XII.
Population dynamics of the parasite and host in a large, commercial glasshouse and test of the parasite-introduction method used in the Netherlands (second part), Z. Ang. Entomol. 93 (1983) 258.
[10] M.L. Flint, Integrated Pest Management for Walnuts, University of California Statewide Integrated Pest Management Project, Division of Agriculture and Natural Resources, second ed., University of California, Oakland, CA, Publication 3270, 1987.
[11] G.N. Foster, A. Kelly, Initial density of glasshouse whitefly (Trialeurodes vaporariorum (Westwood), Hemiptera) in relation to the success of
suppression by Encarsia formosa Gahan (Hymenoptera) on glasshouse
tomatoes, Hortic. Res. 18 (1978) 55.
[12] J. Grasman, O.A. Van Herwaarden, L. Hemerik, J.C. van Lenteren, A two-component model of host–parasitoid interactions: determination of the size of inundative releases of parasitoids in biological pest control, Math. Biosci. 169 (2001) 207.
[13] D.J. Greathead, Natural enemies of tropical locusts and grasshoppers: their impact and potential as biological control agents, in: C.J. Lomer, C. Prior (Eds.), Biological Control of Locusts and Grasshoppers, C.A.B. International, Wallingford, UK, 1992.
[14] M.P. Hassell, The Dynamics of Arthopod Predator–Prey Systems, Princeton University, Princeton, NJ, 1978.
[15] M.P. Hassell, Insecticides in host–parasitoid interactions, Theor. Popul. Biol. 26 (1984) 378.
[16] M.P. Hassell, Host–parasitoid population dynamics, J. Anim. Ecol. 69 (2000) 543.
[17] M.P. Hassell, The Spatial and Temporal Dynamics of Host–Parasitoid Interactions, Oxford University, Oxford, 2000.
[18] M.P. Hassell, R.M. May, Stability in insect host-parasite models, J. Anim. Ecol. 42 (1973) 693.
[19] M.S. Hoddle, R.G. van Driesche, J.P. Sanderson, Biological control ofBemisia
argentifolii(Homoptera: Aleyrodidae) on poinsettia with inundative releases of Encarsia formosa ‘Beltsville Strain’ (Hymenoptera: Aphelinidae): can parasitoid reproduction augment inundative releases?, J Econ. Entomol. 90 (1997) 910.
[20] M.S. Hoddle, R.G. van Driesche, J.P. Sanderson, Biology and use of the whitefly
parasitoidEncarsia formosa, Annu. Rev. Entomol. 43 (1997) 645.
[21] M.P. Hoffmann, A.C. Frodsham, Natural Enemies of Vegetable Insect Pests, Cooperative Extension, Cornell University, Ithaca, NY, 1993.
[22] C.S. Holling, The components of predation as revealed by a study of small-mammal predation of the European pine sawfly, Can. Entomol. 91 (1959) 293. [23] C.S. Holling, Some characteristics of simple types of predation and parasitism,
Can. Entomol. 91 (1959) 385.
[24] W.A. Jones, S.M. Greenberg, J.R. Legaspi, The effect of varying Bemisia
argentifolii and Eretmocerus mundus ratios on parasitism, BioControl 44 (1999) 13.
[25] A.J. Lotka, Undamped oscillations derived from the law of mass action, J. Am. Chem. Soc. 42 (1920) 1595.
[26] R.M. May, M.P. Hassell, R.M. Anderson, D.W. Tonkyon, Density dependence in host–parasitoid models, J. Anim. Ecol. 50 (1981) 855.
[27] R.L. Metcalf, W. Luckman, Introduction to Insect Pest Management, Wiley, New York, 1975.
[28] N.J. Mills, W.M. Getz, Modelling the biological control of insect pests: a review of host–parasitoid models, Ecol. Model. 92 (1996) 121.
[29] W.W. Murdoch, A. Oaten, Predation and population stability, Adv. Ecol. Res. 9 (1975) 2.
[30] W.W. Murdoch, J. Chesson, P.L. Chesson, Biological control in theory and practice, Am. Nat. 125 (1985) 344.
[31] J.D. Murray, Mathematical Biology I: An Introduction, third ed., Springer, Berlin, 2002.
[32] A.J. Nicholson, V.A. Bailey, The balance of animal populations. Part I, Proc. Zool. Soc. Lond. 3 (1935) 551.
[33] F.D. Parker, Management of pest populations by manipulating densities of both host and parasites through periodic releases, in: C.B. Huffaker (Ed.), Biological Control, Plenum, New York, 1971.
[34] M.P. Parrella, T.D. Paine, J.A. Bethke, J. Hall, Evaluation ofEncarsia formosa
(Hymenoptera: Aphelinidae) for biological control of sweetpotato whitefly (Homoptera: Aleyrodidae) on poinsettia, Environ. Entomol. 20 (1991) 713. [35] L.P. Pedigo, Entomology and Pest Management, second ed., Prentice-Hall,
Englewood Cliffs, NJ, 1996.
[36] L.P. Pedigo, L.G. Higley, A new perspective of the economic injury level concept and environmental quality, Am. Entomol. 38 (1992) 12.
[37] X. Rumei, J.C. van Lenteren, P. Huisman, Parasitism of whitefly byEncarsia
formosaat different release ratios, IOBC/WPRS Bull. 10 (1987) 188. [38] R.E. Stinner, Efficacy of inundative releases, A. Res. Ent. 22 (1977) 515.
[39] T.E. Summers, E.G. King, D.F. Martin, R.D. Jackson, Biological control ofDiatraea
sacchanalisin Florida by periodic releases ofLixophaga diatraeae, Entomophaga 4 (1976) 359.
[40] F.J. Simmonds, The occurrence of superparasitism inNemeritis canescens, Grav.
Rev. Canad. Biol. 2 (1943) 15.
[41] S.Y. Tang, L.S. Chen, Modelling and analysis of integrated pest management strategy, Discrete Contin. Dyn. Syst. B 4 (2004) 759.
[42] S.Y. Tang, R.A. Cheke, State-dependent impulsive models of integrated pest management (IPM) strategies and their dynamic consequences, J. Math. Biol. 50 (2005) 257.
[43] S.Y. Tang, Y.N. Xiao, L.S. Chen, R.A. Cheke, Integrated pest management models and their dynamical behavior, Bull. Math. Biol. 67 (2005) 115.
[44] J.C. van Lenteren, Integrated pest management in protected crops, in: D. Dent (Ed.), Integrated Pest Management, Chapman and Hall, London, 1995. [45] J.C. van Lenteren, Measures of success in biological control of arthropods by
augmentation of natural enemies, in: S. Wratten, G. Gurr (Eds.), Measures of Success in Biological Control, Kluwer, Dordrecht, 2000.
[46] J.C. van Lenteren, H.J.W. van Roermund, S. Sutterlin, Biological control of
greenhouse whitefly (Trialeurodes vaporariorum) with the parasitoidEncarsia
formosa: how does it work?, Biol Control 6 (1996) 1.
[47] J.C. van Lenteren, J. Woets, Biological and integrated control in greenhouses, Annu. Rev. Entomol. 33 (1988) 239.
[48] V. Volterra, Variations and fluctuations of a number of individuals in animal species living together Translation in:, in: R.N. Chapman (Ed.), Animal Ecology, McGraw-Hill, New York, 1931.
[49] J.K. Waage, M.P. Hassell, H.C.J. Godfray, The dynamics of pest–parasitoid– insecticide interactions, J. Appl. Ecol. 22 (1985) 825.
[50] K.A.J. White, K. Wilson, Modelling density-dependent resistance in insect– pathogen interactions, Theor. Popul. Biol. 56 (1999) 163.
[51] H.G. Wylie, Delayed development of Microctonus vittatae (Hymenoptera:
Braconidae) in superparasitized adults ofPhyllotreta cruciferae(Coleoptera:
Chrysomelidae), Can. Entomol. 115 (1983) 441.
[52] Y.N. Xiao, F. Van Den Bosch, The dynamics of an eco-epidemic model with biological control, Ecol. Model. 168 (2003) 203.
[53] E. Yano, A simulation study of population interaction between the greenhouse
whitefly,Trialeurodes vaporariorumWestw. (Homoptera: Aleyrodidae), and the
parasitoidEncarsia formosaGahan (Hymenoptera: Aphelinidae). I. Description
of the model, Res. Popul. Ecol. 31 (1989) 73.
[54] E. Yano, A simulation study of population interaction between the greenhouse
whiteflyTrialeurodes vaporariorumWestwood (Homoptera: Aleyrodidae) and
the parasitoids Encarsia formosa Gahan (Hymenoptera: Aphelinidae). II.
Simulation analysis of population dynamics and strategy of biological control, Res. Popul. Ecol. 31 (1989) 89.