Efficient rotation- and scale-invariant texture
classification method based on Gabor wavelets
Xudong Xie Qionghai Dai Tsinghua University Department of Automation Beijing, China E-mail: [email protected] Kin-Man Lam
The Hong Kong Polytechnic University Centre for Signal Processing
Department of Electronic and Information Engineering Hong Kong
Hongya Zhao City University of Hong Kong Department of Electronic Engineering
Hong Kong
Abstract. An efficient texture classification method is proposed that considers the effects of both the rotation and scale of texture im-ages. In our method, the Gabor wavelets are adopted to extract local features of an image and the statistical properties of its gray-level intensities are used to represent the global features. Then, an adaptive, circular orientation normalization scheme is proposed to make the feature invariant to rotation, and an elastic cross-frequency searching mechanism is devised to reduce the effect of scaling. Our method is evaluated based on the Brodatz album and the Outex database, and the experimental results show that it
out-performs the traditional algorithms.© 2008 SPIE and
IS&T. 关DOI: 10.1117/1.3050071兴
1 Introduction
Texture analysis performs fundamental and important roles in many image-based applications, such as remote sensing analysis, medical image interpretation, pattern recognition, and content-based image retrieval. Many methods have been proposed for texture analysis and can be divided into three categories: statistical methods, structural methods, and model-based methods.1–3Among these methods, mul-tichannel analysis algorithms, such as the wavelet model4,5 and the Gabor model,6have gained a lot of attention due to their ability to characterize features at different frequencies and orientations. With the wavelet-based method, only three directions 共i.e., the horizontal, vertical and diagonal orientations兲 are considered, while the Gabor wavelets 共GWs兲can be used to extract features at any specific ori-entation.
In image retrieval applications, because it is difficult to ensure that a captured texture image has the same orienta-tion and scale as the training images, invariant texture analysis is highly desirable from both the practical and the-oretical viewpoints.7 In Ref. 8, a circular shift technique 共CST兲 is used for rotation normalization based on the ex-tracted Gabor features, so that all images have the same dominant direction. In Ref.9, rotation-invariant texture fea-tures are derived from the symmetrical Gabor filtered im-ages of texture, and the feature used is a modified average absolute deviation from the mean. Gabor features are also used for rotation-invariant texture classification in Ref.10, where rotation invariance is achieved by using the Fourier expansion of these features with respect to orientation. The above-mentioned methods consider only the effect of rota-tion. Cui et al.7 proposed a rotation- and scale-invariant feature set based on the Radon transform and multiscale analysis. In Ref.11, the rotational invariance is achieved by using the two kinds of wavelets with their directional prop-erties, and the scale invariance is achieved by using a method that is an extension of the fractal dimension fea-tures. The first- and second-order statistical parameters and the entropy characterize the quality of the features ex-tracted.
In this paper, an efficient texture classification method, which is invariant to rotation and scale, is proposed. Our algorithm uses Gabor wavelets to extract features at differ-ent frequencies and oridiffer-entations. The mean and variance of the Gabor filtered image form the feature to represent the homogeneous texture image and can also be used for tex-ture classification. An adaptive circular orientation normal-ization共ACON兲technique is proposed to reduce the effect of rotation in the images. Compared to the CST in Ref.8, two modifications are made in our algorithm. First,
orien-Paper 08046R received Mar. 26, 2008; revised manuscript received Sep. 16, 2008; accepted for publication Oct. 31, 2008; published online Dec. 22, 2008.
tation normalization is performed within each frequency; this can reduce the cross-frequency disturbance. Second, because the Gabor features can only represent the local characteristics of an image, we also consider the statistical properties of an image’s gray-level intensity as a global feature. Then, an elastic cross-frequency searching共ECFS兲 mechanism is devised to search the scales of the features used in matching. Experimental results based on the Bro-datz album12 and the Outex database13 show that our method can greatly improve the classification performance. This paper is organized as follows. In Section 2, the fundamentals of GWs are described. The ACON technique, which is used for rotation normalization, and the ECFS mechanism, which can effectively reduce the effect of scal-ing, are presented in Section 3. Experimental results are given in Section 4, evaluating the different invariant texture image classification algorithms based on two different tex-ture databases. Finally, conclusions are drawn in Section 5.
2 Gabor Feature Extraction
The GWs, whose kernels are similar to the response of the two-dimensional receptive field profiles of the mammalian simple cortical cell,14exhibit the desirable characteristics of capturing salient visual properties, such as spatial localiza-tion, orientation selectivity, and spatial frequency.6 In the spatial domain, a GW is a complex exponential modulated by a Gaussian function, which is defined as follows:14
,共x,y兲=
1 22e
−关共xcos+ysin兲2+共−xsin+ycos兲2/22兴
⫻关ei共xcos+ysin兲−e−共22/2兲兴, 共1兲
where 共x,y兲 denotes the pixel position in the spatial do-main,is the radial center frequency, is the orientation of the GW, andis the standard deviation of the Gaussian function along the x- and y-axes, where x=y= is as-sumed. The value of can be derived as follows:
=/, 共2兲
where=
冑2 ln 2
关共2+ 1兲/共2− 1兲兴andis the bandwidth in octaves. By selecting different center frequencies and orientations, we can obtain a family of Gabor kernels from 共1兲that can be used to represent an image. The Gabor filters with different center frequencies and orientations are shown in Fig.1.Given a gray-level image f共x,y兲, the convolution of
f共x,y兲 and,共x,y兲 is given as follows:
Y,共x,y兲=f共x,y兲ⴱ,共x,y兲, 共3兲
where the asterisk denotes the convolution operator. Con-catenating the convolution outputs, we can obtain a one-dimensional Gabor representation of the input image, Y,=关Y,共0,0兲,Y,共0,1兲, . . . ,Y,共0,NH
− 1兲,Y,共1,0兲, . . . ,Y,共NW− 1,NH− 1兲兴T, 共4兲
whereTrepresents the transpose operation, andNWandNH
are the width and height of the image, respectively. In this paper, we consider only the magnitude of the Gabor repre-sentations, which can provide a measure of the local
prop-erties of an image 共for convenience, we also denote it as Y,兲. Then these Gabor features, with different and ,
are concatenated to form a high-dimensional feature vector, as follows: Y=关Y 1,1 T ,Y 2,1 T , . . . ,Y m,n T 兴T , 共5兲
wheremand n are the numbers of center frequencies and orientations used, respectively.
3 Rotation- and Scale-Invariant Feature Representation and Texture Classification
The mean , and the standard deviation , of Y, in
共6兲and共7兲, respectively, are used to form the features of a homogeneous texture image, and can be used for texture classification,8 ,= 兺y兺xY,共x,y兲 NWNH , 共6兲 ,=
冑
兺y兺x关Y,共x,y兲−,兴2 NWNH . 共7兲We can obtain a feature vector, which includes all the means and standard deviations at different frequencies and orientations, i.e.,
P=关
1,1,1,1,2,1,2,1, . . . ,m,n,m,n兴
T. 共8兲
This vector is used for texture classification. If the query image is rotated, then the order of the elements inPwill be altered and, therefore, we cannot use Pdirectly for classi-fication. In this case, an orientation normalization process is necessary.
Fig. 1 Gabor filters:共a兲Real parts of the Gabor filters at five differ-ent cdiffer-enter frequencies and eight oridiffer-entations. The frequencies are / 2,冑2/ 4,/ 4,冑2/ 8, and/ 8 from the top to the bottom row, respectively. The orientations are from 0 to 7/ 8 in steps of/ 8, from the left to the right column, respectively.共b兲Magnitudes of the Gabor filters at the corresponding five different center frequencies.
From共1兲, we can see that the kernel function of a Gabor wavelet is a periodic function, whose period is 2. On the basis of this property, the simple circular shift technique is used in Ref.8 to reduce the effect of rotation. In this tech-nique, for each feature vector P, the orientation with the highest energy 共i.e., the largest ,兲 is considered the
dominant orientation. The corresponding element in the dominant orientation is shifted circularly to become the first element in the feature vectorP, and the other elements are also shifted accordingly. Assuming that the dominant orien-tation isi,共8兲is rewritten as P=关 1,i,1,i,2,i,2,i, . . . ,m,i,m,i,1,i+1, 1,i+1, . . . ,m,i−1,m,i−1兴 T . 共9兲
This method is simple and efficient and can reduce the effect of rotation. However, it does not consider the effect of scaling. In fact, because,represents the energy of an
image at a specific frequency and at a specific orientation, its magnitude should be dependent on both the frequency and the orientation. In other words, for a scaled image, due to the effect of scaling, its largest mean , may have a
different orientation from that of the original image. In this case, performing the circular shift on all the elements of a feature extracted at different frequencies and orienta-tions may result in mismatching. Therefore, in this paper, an ACON technique is proposed to reduce the effect of rotation and to eliminate any cross-frequency disturbance.
For each frequencyi, the corresponding extracted
fea-tures are denoted as P
i, where Pi =关 i,1,i,1,i,2,i,2,¯,i,n,i,n兴 T . For those elements inP
i, ifi,jhas the largest magnitude, then the correspondingj will be considered the dominant orienta-tion at the frequency i. The feature element i,j is
moved to the first element inP
i, and the other elements are circularly shifted accordingly. The new feature vector is
denoted as P i, where P
⬘
i =关 i,j,i,j,i,j+1,i,j+1, . . . ,i,j−1,i,j−1兴 T. Fi-nally, theP i⬘
from different frequencies are concatenated to build a high-dimensional feature vector, i.e.,P=关P 1
⬘
T ,P 2⬘
T , . . . ,P m⬘
T兴T . 共10兲As the orientation normalization is performed for each in-dividual frequency, P
i
⬘
is only affected by the orientation and the disturbance from cross frequency is eliminated.Because the Gabor features can only represent the local characteristics of an image, we also consider the statistical properties of its gray-level intensities, which can give the global information about the image. Denote the mean and the standard deviation of the gray-level intensities of a tex-ture image as 0 and 0, respectively. Adding these two feature values to共10兲, we have the following feature vector to represent the texture image:
P=关0,0,P 1
⬘
T ,P 2⬘
T , . . . ,P m⬘
T兴T. 共11兲Pis invariant to rotation and is therefore effective for tex-ture classification. Compared to the CST, two improve-ments have been made in our algorithm: not only is the
orientation normalization performed for each individual frequency, which can reduce the disturbance from cross frequency, but the global information about the texture im-age is also included.
After rotation normalization, an ECFS mechanism is proposed to reduce the effect of image scaling. As the ex-tracted Gabor features based on different frequencies rep-resent the characteristics of images at different scales,14we should consider these features separately. For two texture images to be compared, the distance metric is defined as
D=
兺
i Di+D0, 共12兲 where Di= min k兺
j冑
共i,j 共1兲 − k,j 共2兲 兲2+共 i,j 共1兲 − k,j 共2兲 兲2, 共13兲 and D0=冑
共0共1兲−0共2兲兲2+共0共1兲−0共2兲兲2. 共14兲 In 共13兲, i,j 共1兲 and i,j共1兲 are the mean and the standard
deviation of the first image with frequencyiand orienta-tionj, respectively; and
k,j
共2兲 and
k,j
共2兲 denote the mean
and the standard deviation of the second image with fre-quency kand orientationj. In this formulation, the fea-ture vector of the second image at a frequency of, sayk, which results in a minimum distance to the first image at frequencyi, is considered. This minimum distance is de-noted asDi. In other words, the feature at frequencykof the second image is the most similar or matched one to the feature at frequencyiof the first image. In 共14兲,D0 is a
measure of the similarity between the global features of the two images. With this distance measure, the effect of scal-ing can be effectively reduced. Then, the nearest-neighbor rule is applied to find the most similar pairing between a query image and the images in an image database.
4 Experimental Results
In this section, we will evaluate the performance of our proposed algorithm for texture classification based on the Brodatz album and the Outex database, which contain 112 and 319 texture patterns, respectively. All the texture im-ages are normalized to a size of 64⫻64. First, we will investigate the selection of the parameters for the Gabor wavelets to be used 共i.e., the number of frequencies and orientations兲. Then, our method is compared to the CST, which mainly focuses on rotation-invariant texture classifi-cation. Furthermore, our method is also compared to other methods for rotation- and scale-invariant texture classifica-tion.
4.1 Parameter Setting
As described in Section 2, the Gabor features are extracted at different frequencies and orientations. The number of frequencies and orientations should be predetermined. To determine these numbers, the 10 images D1–D10 from the Brodatz album were selected. The testing set was generated by rotating and scaling these 10 images. Each of these im-ages is scaled with 10 different scales 共0.5–1.5, with 0.1
intervals, 1.0 is excluded兲and rotated by 36 different ori-entations共10– 360 deg, with 10 deg intervals兲; therefore, a total of 360 testing images is generated. Then, the perfor-mance of our method in terms of its recognition rate is measured with different numbers of frequencies and orien-tations, as tabulated in Table1. Here, the frequencies and orientations adopted are /共
冑2
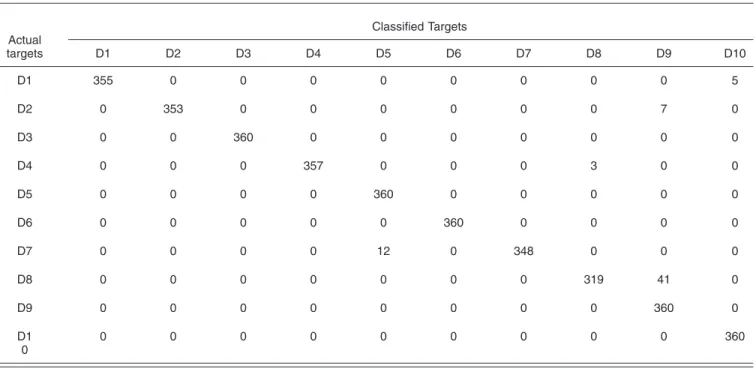
兲p+1, where p= 1 , 2 , . . . ,m,and 2q/n, where q= 1 , 2 , . . ., n− 1, respectively. From Table 1, we can see that the best performance can be achieved when five frequencies and ten orientations are em-ployed. This result coincides with the analysis in Ref. 8. Therefore, in our following experiments,mandnare set as 5 and 10, respectively. To demonstrate a better visualization of the classification performance, the corresponding confu-sion matrix for this optimal number of frequencies and ori-entations is shown in Table2, and some incorrectly classi-fied samples are illustrated in Fig. 2. We can see that, sometimes, one texture may look similar to another texture after the rotation and scaling operations.
4.2 Experimental Results Compared to CST
In this experiment, all 112 images in the Brodatz database are used for training, and three different sets of testing im-ages are produced that are used to evaluate the relative performances of the different methods. In set I, all 112 images in the Brodatz database are rotated in increments of 10 deg from 10– 360 deg; thus, 4032 rotated texture images 共112⫻36= 4032兲 are generated. In set II, the images are scaled by scaling factors from 0.5 to 1.5 with 0.1 intervals 共the image with scaling factor 1.0 is excluded兲. Thus, this image set has 1120 共112⫻10= 1120兲 images. For set III, the images are both rotated and scaled as in the previous section 关i.e., 36 orientations共10– 360 deg, with 10 deg in-tervals兲 and 10 scales 共0.5–1.5, with 0.1 intervals; 1.0 is excluded兲. In other words, a total of 40,320 共112⫻36 ⫻10= 40,320兲 images are generated. From this procedure for producing the various testing sets, we can see that there is no overlap between the images in the training set and Table 1Texture classification performance共in percent兲based on Gabor wavelets with different
num-bers of frequencies and orientations.
mandn 2 3 4 5 6 4 87.2 85.4 90.6 93.0 91.9 6 87.9 90.9 94.1 96.9 96.8 8 87.4 90.9 92.9 97.2 97.1 10 86.4 89.9 93.2 98.1 97.9 12 86.4 89.8 91.2 96.4 96.3
Table 2 The confusion matrix of the result whenmandnare set as 5 and 10, respectively.
Actual targets Classified Targets D1 D2 D3 D4 D5 D6 D7 D8 D9 D10 D1 355 0 0 0 0 0 0 0 0 5 D2 0 353 0 0 0 0 0 0 7 0 D3 0 0 360 0 0 0 0 0 0 0 D4 0 0 0 357 0 0 0 3 0 0 D5 0 0 0 0 360 0 0 0 0 0 D6 0 0 0 0 0 360 0 0 0 0 D7 0 0 0 0 12 0 348 0 0 0 D8 0 0 0 0 0 0 0 319 41 0 D9 0 0 0 0 0 0 0 0 360 0 D1 0 0 0 0 0 0 0 0 0 0 360
those in the testing set. Figure 3 shows the texture image D26 and some of its rotated and scaled images.
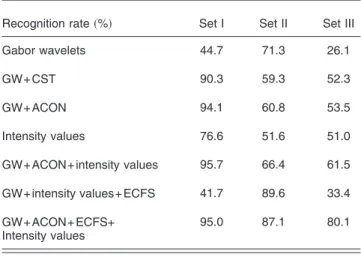
The performance of our proposed algorithm is evaluated and compared to the circular shift technique. The experi-mental results are shown in Table3. The “Gabor Wavelets” method refers to the use of the feature in共8兲, and the Eu-clidean distance measure is used for classification. The “In-tensity Values” method employs the global statistical prop-erties of the image only; in other words,共14兲instead of共12兲 is used for classification. From Table 3, we have the fol-lowing observations:
1. For those rotated testing images, the GWs method achieves a poor recognition rate, even lower than that based on the intensity values method. This is because Gabor features are sensitive to the orientation of an image. Consequently, if a query image is rotated, it cannot give a satisfactory result.
2. With the CST, the recognition rate is greatly in-creased; however, this method does not perform well when the images are scaled. Furthermore, with the use of a more robust and flexible rotation normaliza-tion mechanism, our proposed method outperforms the CST when the images are under rotation only. 3. For set I, the ACON technology can achieve the best
performance; whereas while for set II, our proposed ECFS mechanism outperforms the other methods. If the images are both rotated and scaled, then combin-ing these two techniques can obtain the best
perfor-mance. For both sets I and II, the combined method has a performance level slightly lower than the re-spective best performance; however, it still signifi-cantly outperforms the other methods.
4. The statistical properties of the gray-level intensities can provide additional information to the Gabor fea-tures, which represent the local characteristics of an image. Combining these two different kinds of fea-tures together, the best recognition performance can be achieved.
In order to investigate the effect of rotating and scaling texture images on the classification performance, we con-sider sets I and II. The images in sets I and II are divided into 36 and 10 subcategories according to their angles of rotation and scaling factors, respectively. The respective recognition rates are shown in Figs.4and5. From Fig.4, we can see that the peak values locate at the angles of 10, 90, 180, 270, and 360 deg. This is because when an image is rotated, some information in the edge areas, which can-not be handled by the rotation normalization, is lost. The distorted information between these rotated images and the
Table 3Texture classification based on the Brodatz album.
Recognition rate共%兲 Set I Set II Set III
Gabor wavelets 44.7 71.3 26.1
GW+ CST 90.3 59.3 52.3
GW+ ACON 94.1 60.8 53.5
Intensity values 76.6 51.6 51.0
GW+ ACON+ intensity values 95.7 66.4 61.5
GW+ intensity values+ ECFS 41.7 89.6 33.4
GW+ ACON+ ECFS+ Intensity values
95.0 87.1 80.1
Fig. 3 Sample texture images:共a兲original texture image, and共b兲–共f兲 the rotated and scaled images, where the rotation angles are 20, 50, 70, 100, and 140 deg, respectively, and the scaling factors are 1.1, 0.5, 0.7, 1.4, and 0.8, respectively.
Fig. 2 Some incorrectly classified samples. For the query images in 共a兲, the scaling factors used are 1.3, 0.6, 0.6, 0.6, and 0.5, respec-tively, while the corresponding rotation angles are 100, 150, 130, 120, and 110 deg, respectively, from the left to the right column.
original image is smallest at these angles. From Fig.5, the performance is optimal when the scaling factor is close to 1.0. Furthermore, we can see that the proposed method can achieve a better performance for enlarged images than for the reduced images. This is because more detailed texture information will be lost when the resolution is reduced.
4.3 Experimental Results Based on the Outex
Database
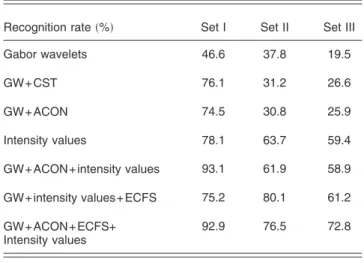
The experiments in the previous section were based on the Brodatz album, where the testing images are produced by artificially scaling and rotating the original images. In order to make the results independent of artificially introduced artifacts, we also consider another texture database共i.e., the Outex database兲,13where the textures have been rotated and scaled physically before being imaged by a camera. In our experiment, 319 feature patterns are considered 共i.e., the training set includes 319 images兲. For each texture, only one image is adopted for training, whose resolution is 360 dpi. Three testing sets are built according to the char-acteristics of the images. Set I considers only those images with rotation, where the rotated angles are 5, 10, 15, 30, 45, 60, 75, and 90 deg. Set II includes images with different resolutions: 300, 500, and 600 dpi. In Set III, both the scal-ing and rotation effects are considered. The numbers of images in the three testing sets are 2552 共319⫻8兲, 957 共319⫻3兲, and 8613共319⫻9⫻3兲, respectively. The experi-mental results based on the different methods are shown in Table4. We can see that, similar to the conclusions in Sec-tion 4.2, ACON can reduce the effects of rotaSec-tion, ECFS is the most effective method for feature classification under scaling variations, and when both rotation and scaling ef-fects exist, the combined algorithm can achieve the best performance.
4.4 Experimental Results Compared to Other
Methods
In this section, we compare the performance of our method to some other texture classification algorithms that are in-variant to rotation and scale. The simulation was performed according to the descriptions in Ref.7, where 25 classes of
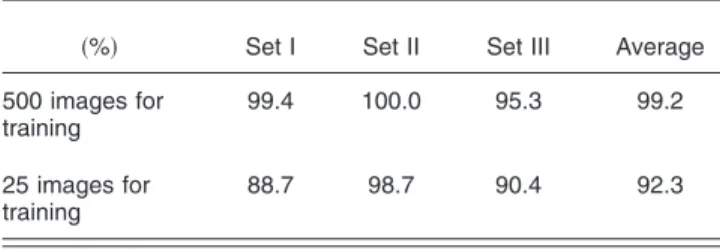
natural texture images from the Brodatz database were se-lected and three testing image sets were built. The images in Set I are both rotated and scaled, with 24 orientations 共0 – 345 deg, with 15 deg intervals兲 and 5 scaling factors 共0.6–1.4, with 0.2 intervals兲. Therefore, this set has 3000 共25⫻120兲images. The images in set II are rotated with 72 orientations only共0 – 355 deg, with 5 deg intervals兲. In this way, this image set has 1800共25⫻72兲images. For set III, each image is scaled by different factors to form 18 samples共0.48–1.84, with 0.08 intervals兲; thus, this set has 450共25⫻18兲images. In the experiment, 20 samples from each class in set I共i.e., a total of 500 images兲are used for training and the other images in all the image sets are used for testing. The average recognition rates for the different methods are shown in Table 5. We see that our proposed method can achieve the best performance.
We have also evaluated our method for the case when only one image from each class in set I 共i.e., 25 images only兲 is selected for training, and the other images in all image sets are used for testing. The results are shown in the last row of Table6. We can see that although the number of training images is greatly reduced, our proposed method can still achieve almost the same recognition rate as the methods in Refs.7 and15.
5 Conclusion
In this paper, we have proposed an efficient rotation- and scale-invariant texture classification method. In our method, GWs are used for extracting an image’s local fea-Fig. 5 Texture classification for images with different scaling factors.
Table 4 Texture classification based on the Outex database.
Recognition rate共%兲 Set I Set II Set III
Gabor wavelets 46.6 37.8 19.5
GW+ CST 76.1 31.2 26.6
GW+ ACON 74.5 30.8 25.9
Intensity values 78.1 63.7 59.4
GW+ ACON+ intensity values 93.1 61.9 58.9
GW+ intensity values+ ECFS 75.2 80.1 61.2
GW+ ACON+ ECFS+ Intensity values
92.9 76.5 72.8
Table 5Texture classification based on different methods.
Radon transform7 Log-polar wavelet energy signature15 Standard wavelet packet energy
signature16 Our method Average
recognition rate共%兲
92.2a 92.1a 83.5a 99.2
tures, and then the means and standard deviations of these features at different frequencies and orientations are calcu-lated. After an ACON operation, an ECFS mechanism is proposed for classification that can effectively reduce the effect of scaling. Considering the fact that the Gabor fea-tures represent only the local feafea-tures of an image, the sta-tistical properties of the gray-level intensities of an image are also used in our algorithm. The experiments were con-ducted using the Brodatz album and the Outex database. Experimental results show that our proposed method can achieve the best performance when compared to other al-gorithms.
Acknowledgments
This work was supported, in part, by The Distinguished Young Scholars of NSFC共Grant No. 60525111兲, The Gen-eral Program of NSFC共Grant No. 60872085兲, and in part, by the 863 Program共Grant No. 2007AA01Z332兲.
References
1. T. R. Reed and J. M. H. Du Buf, “A review of recent texture segmen-tation and feature extraction techniques,”CVGIP: Image Understand.
57共3兲, 359–372共1993兲.
2. T. Ojala, M. Pietikinen, and D. Harwood, “A comparative study of texture measures with classification based on feature distributions,” Pattern Recogn.29共1兲, 51–59共1996兲.
3. J. G. Zhang and T. N. Tan, “Brief review of invariant texture analysis methods,”Pattern Recogn.35共2兲, 735–747共2002兲.
4. R. Manthalkar, P. K. Biswas, and B. N. Chatterji, “Rotation and scale invariant texture features using discrete wavelet packet transform,” Pattern Recogn. Lett.24共14兲, 2455–2462共2003兲.
5. S. Arivazhagan and L. Ganesan, “Texture classification using wavelet transform,”Pattern Recogn. Lett.24共9–10兲, 1513–1521共2003兲. 6. C. Liu and H. Wechsler, “Independent component analysis of Gabor
features for face recognition,”IEEE Trans. Neural Netw.14共4兲, 919– 928共2003兲.
7. P. Cui, J. Li, Q. Pan, and H. Zhang, “Rotation and scaling invariant texture classification based on radon transform and multiscale analy-sis,”Pattern Recogn. Lett.27共5兲, 408–413共2006兲.
8. S. Arivazhagan, L. Ganesan, and S. Padam Priyal, “Texture classifi-cation using Gabor wavelets based rotation invariant features,” Pat-tern Recogn. Lett.27共16兲, 1976–1982共2006兲.
9. R. Manthalkar, P. K. Biswas, and B. N. Chatterji, “Rotation invariant texture classification using even symmetric Gabor filters,”Pattern Recogn. Lett.24共12兲, 2061–2068共2003兲.
10. F. Lahajnar and S. Kovačieˇ, “Rotation-invariant texture classifica-tion,”Pattern Recogn. Lett.24共9–10兲, 1151–1161,共2003兲. 11. K. Muneeswaran, L. Ganesan, S. Arumugam, and K. Ruba Soundar,
“Texture classification with combined rotation and scale invariant wavelet features,”Pattern Recogn.38共10兲, 1495–1506共2005兲. 12. P. Brodatz,Textures: A Photographic Album for Artists and
Design-ers, Dover, Toronto共1966兲.
13. T. Ojala, T. Maenpaa, M. Pietikainen, J. Viertola, J. Kyllonen, and S. Huovinen, “Outex—New framework for empirical evaluation of tex-ture analysis algorithms,” inProc. of Int. Conf. on Pattern Recogni-tion, vol. 1, pp. 701–706, IEEE, Piscataway, NJ 共2002兲; http:// www.outex.oulu.fi/outex.php.
14. C. K. Chui,An Introduction to Wavelets, Academic Press, New York
共1992兲.
15. C. M. Pun and M. C. Lee, “Log-polar wavelet energy signatures for rotation and scale invariant texture classification,”IEEE Trans. Pat-tern Anal. Mach. Intell.25共5兲, 590–603共2003兲.
16. A. Laine and J. Fan, “Texture classification by wavelet packet signa-tures,”IEEE Trans. Pattern Anal. Mach. Intell.15共11兲, 1186–1191
共1993兲.
Xudong Xie received his BEng in elec-tronic engineering and MSc in signal and information processing from the Depart-ment of Electronic Engineering, Tsinghua University, Beijing, China, in 1999 and 2002, respectively. In 2006, he received his PhD from the Department of Electronic and Information Engineering, at The Hong Kong Polytechnic University, Hong Kong. From March 2008 to October 2008, he was a research associate at the Department of Electronic Engineering, at The City University of Hong Kong, Hong Kong. After being a postdoctoral research fellow at the Department of Electronic Engineering, Tsinghua University, Beijing, he joined the Broadband Network and Digital Media Center at the Department of Automation, School of Information Science and Technology, Tsing-hua University, Beijing, China, where he is currently an assistant professor. His research interests include image analysis, pattern recognition, and computer vision.
Qionghai Dai received his BS in math-ematics from Shanxi Normal University, China, in 1987, and ME and PhD in com-puter engineering and automatic control from Northeastern University, China, in 1994 and 1996, respectively. After being a postdoctoral research affiliate at the De-partment of Automation, Tsinghua Univer-sity, Beijing, he is currently a professor in that department. His research interests in-clude digital video processing and commu-nication, computer vision, and computational photography.
Kin-Man Lam received his associateship in electronic engineering with distinction from The Hong Kong Polytechnic Univer-sity共formerly called Hong Kong Polytech-nic兲in 1986. He received his MSc in com-munication engineering from the Department of Electrical Engineering, at the Imperial College of Science, Technol-ogy and Medicine, England, in 1987, and his PhD from the Department of Electrical Engineering at the University of Sydney, Australia, in 1996. Currently, he is an associate professor in the Department of Electronic and Information Engineering, The Hong Kong Polytechnic University. He is the chairman of the IEEE Hong Kong Chapter of Signal Processing and an associate editor of the
EURASIP Journal of Image and Video Processing. He has pub-lished more than 100 technical articles in international journals and conferences. His current research interests include facial image analysis, image and video processing, and computer vision.
Hongya Zhao received her MSE degree from Northeastern University, Shenyang, China, in 2002, and her PhD degree from the Department of Mathematics of Hong Kong Baptist University, Hong Kong, in 2006. She is currently a research associate in the Department of Electronic Engineer-ing, City University of Hong Kong, Hong Kong. Her current research interests in-clude bioinformatics, statistics, and pattern recognition.
Table 6Texture classification based on different training sets.
共%兲 Set I Set II Set III Average
500 images for training 99.4 100.0 95.3 99.2 25 images for training 88.7 98.7 90.4 92.3