Risk stratification of patients admitted to hospital with covid-19 using
the ISARIC WHO Clinical Characterisation Protocol: development and
validation of the 4C Mortality Score
Stephen R Knight, NIHR clinical research fellow1*, Antonia Ho, senior clinical lecturer in infectious diseases*2, Riinu Pius, senior data manager 1, Iain Buchan, professor of public health and informatics3, Gail Carson, head of ISARIC global support centre4, Thomas M Drake, clinical research fellow1, Jake Dunning, head of emerging infections and zoonoses and senior clinical lecturer in respiratory
infections5,6, Cameron J Fairfield, MRC clinical fellow1, Carrol Gamble, professor of medical statistics7, Christopher A Green, senior clinical lecturer and consultant physician in infectious diseases8, Rishi Gupta, NIHR doctoral clinical research fellow9, Sophie Halpin, supervising data manager 7, Hayley E Hardwick, project manager10, Karl A Holden, NIHR academic clinical fellow in paediatrics10, Peter W Horby, professor of emerging infectious diseases4, Clare Jackson, senior data manager7, Kenneth A Mclean, clinical research fellow1, Laura Merson, head of data ISARIC4, Jonathan S Nguyen-Van-Tam, professor of health protection11,Lisa Norman, research assistant1, Mahdad Noursadeghi, professor of infectious diseases12, Piero L Olliaro, professor of poverty related infectious diseases13, Mark G Pritchard, speciality registrar in public health medicine13, Clark D Russell, clinical lecturer in infectious diseases13, Catherine A Shaw, research manager14, Aziz Sheikh, professor of primary care research and development1, Tom Solomon, professor of neurology and director NIHR health protection research unit in emerging and zoonotic infections10, Cathie Sudlow, director of health data research and director UK BHF data science centre16, Olivia V Swann, clinical lecturer in paediatric infectious diseases17, Lance CW Turtle , senior clinical lecturer and consultant physician in infectious diseases10, Peter JM Openshaw, professor of experimental medicine6, J Kenneth Baillie, academic consultant in critical care medicine17, Malcolm G Semple, professor of outbreak medicine and child health and consultant physician in
paediatric respiratory medicine9,19,$ , Annemarie B Docherty, senior clinical lecturer and honorary consultant in critical care 1,$, Ewen M Harrison, professor of surgery and data science 1,15,$, on behalf of the ISARIC4C investigators.
* joint first authors $ joint senior authors Corresponding author Malcolm G Semple
[email protected] @Tweediechap @CCPUKstudy Affiliations
1. Centre for Medical Informatics, The Usher Institute, University of Edinburgh, UK
2. Medical Research Council University of Glasgow Centre for Virus Research, Glasgow, UK 3. Institute of Population Health Sciences, University of Liverpool, UK
4. ISARIC Global Support Centre, Centre for Tropical Medicine and Global Health, Nuffield Department of Medicine, University of Oxford, UK
2 6. National Heart and Lung Institute, Imperial College London, UK
7. Liverpool Clinical Trials Centre, University of Liverpool, UK
8. Institute of Microbiology & Infection, University of Birmingham, UK 9. Institute of global health, University College London, UK
10. NIHR Health Protection Research Unit, Institute of Infection, Veterinary and Ecological Sciences, Faculty of Health and Life Sciences, University of Liverpool, UK
11. Division of Epidemiology and Public Health, University of Nottingham School of Medicine, UK 12. Division of Infection and Immunity, University College London, UK
13. Centre for Tropical Medicine and Global Health, Nuffield Department of Medicine, University of Oxford, UK
14. Queen’s Medical Research Institute, University of Edinburgh, UK 15. Department of Clinical Surgery at The University of Edinburgh, UK 16. Health Data Research UK, Gibbs Building, 215 Euston Road, London, UK 17. Department of Child Life and Health, University of Edinburgh, UK 18. Roslin Institute, University of Edinburgh, Edinburgh, UK
19. Respiratory Medicine, Alder Hey Children’s Hospital, Institute in The Park, University of Liverpool, Alder Hey Children’s Hospital, Liverpool, UK
Abstract
Objectives To develop and validate a pragmatic risk score to predict mortality for patients admitted to hospital with covid-19.
Design Prospective observational cohort study: ISARIC WHO CCP-UK study (ISARIC Coronavirus Clinical Characterisation Consortium [4C]). Model training was performed on a cohort of patients recruited between 6 February and 20 May 2020, with validation conducted on a second cohort of patients recruited between 21 May and 29 June 2020.
Setting 260 hospitals across England, Scotland, and Wales.
Participants Adult patients (≥18 years) admitted to hospital with covid-19 admitted at least four weeks before final data extraction.
Main outcome measures In-hospital mortality.
Results There were 34 692 patients included in the derivation dataset (mortality rate 31.7%) and 22 454 in the validation dataset (mortality 31.5%). The final 4C Mortality Score included eight variables readily available at initial hospital assessment: age, sex, number of comorbidities, respiratory rate, peripheral oxygen saturation, level of consciousness, urea, and C-reactive protein (score range 0-21 points). The 4C risk stratification score demonstrated high discrimination for mortality (derivation cohort: AUROC 0.79; 95% CI 0.78 - 0.79; validation cohort 0.78, 0.77-0.79) with excellent calibration (slope = 1.0). Patients with a score ≥15(n = 2310, 17.4%) had a 67% mortality (i.e., positive predictive value 67%) compared with 1.0% mortality for those with a score ≤3 (n = 918, 7%; negative predictive value 99%).
Discriminatory performance was higher than 15 pre-existing risk stratification scores (AUROC range 0.60-0.76), with scores developed in other covid-19 cohorts often performing poorly (range 0.63-0.73). Conclusions We have developed and validated an easy-to-use risk stratification score based on
commonly available parameters at hospital presentation. This outperformed existing scores,
demonstrated utility to directly inform clinical decision making, and can be used to stratify inpatients with covid-19 into different management groups. The 4C Mortality Score may help clinicians identify patients with covid-19 at high risk of dying during current and subsequent waves of the pandemic. Study registration ISRCTN66726260
4
Introduction
Disease resulting from infection with severe acute respiratory syndrome coronavirus 2 (SARS-CoV-2), has a high mortality rate with deaths predominantly due to respiratory failure.1 As of 30th July 2020,
there are over 17 million confirmed cases worldwide and at least 660 000 deaths.2,3 As hospitals around
the world are faced with an influx of patients with covid-19, there is an urgent need for a pragmatic risk stratification tool that will allow the early identification of patients infected with SARS-CoV-2 who are at the highest risk of death, to guide management and optimise resource allocation.
Prognostic scores attempt to transform complex clinical pictures into tangible numerical values.
Prognostication is more difficult when dealing with a severe pandemic illness such as covid-19, as strain on healthcare resources and rapidly evolving treatments alter the risk of death over time. Early
information has suggested that the clinical course of a patient with covid-19 is different from that of pneumonia, seasonal influenza or sepsis.4 The majority of patients with severe covid-19 have developed
a clinical picture characterised by pneumonitis, profound hypoxia, and systemic inflammation affecting multiple organs.1
A recent review identified many prognostic scores used for covid-19,5 which varied in their setting,
predicted outcome measure, and the clinical parameters included.The large number of risk
stratification tools reflects difficulties in their application, with most scores demonstrating moderate performance at best and no benefit to clinical decision-making.6,7 It has been found that many novel
covid-19 prognostic scores have a high risk of bias, which may reflect development in small cohorts, and many have been published without clear details of model derivation and testing.5 To our knowledge, a
risk stratification tool is yet to be developed and validated within a large national cohort of hospitalised patients with covid-19.
Our aim was to develop and validate a pragmatic, clinically relevant risk stratification score using routinely available clinical information at hospital presentation to predict in-hospital mortality in hospitalised covid-19 patients and then compare this with existing prognostic models.
Methods
Study design and setting
The International Severe Acute Respiratory and emerging Infections Consortium (ISARIC) WHO Clinical Characterisation Protocol UK (CCP-UK) study is an ongoing prospective cohort study in 260 acute care hospitals across England, Scotland, and Wales (National Institute for Health Research Clinical Research Network Central Portfolio Management System ID: 14152) performed by the ISARIC Covid-19 Clinical Characterisation Consortium (ISARIC-4C). The protocol and further study details are available online.8
Model development and reporting followed the Transparent Reporting of a multivariate prediction mode for Individual Prediction or Diagnosis (TRIPOD) guidelines.9 The study was performed according to
a pre-defined protocol (Appendix 1).
Participants
Patients aged ≥18 years old with a completed index admission to one of 260 hospitals in England, Scotland, or Wales were included.8 Reverse transcriptase-PCR was the only mode of testing available
during the period of study. The decision to test was at the discretion of the clinician attending the patient, and not defined by protocol. The enrolment criterion “high likelihood of infection” reflected that a preparedness protocol cannot assume a diagnostic test will be available for an emergent pathogen. In this activation, site training emphasised importance of only recruiting proven cases.
Data collection
Demographic, clinical and outcomes data were collected using a pre-specified case report form.
Comorbidities were defined according to a modified Charlson Comorbidity Index10; those collected were:
chronic cardiac disease; chronic respiratory disease (excluding asthma); chronic renal disease (estimated glomerular filtration rate ≤30); mild-to-severe liver disease; dementia; chronic neurological conditions; connective tissue disease; diabetes mellitus (diet, tablet or insulin-controlled); HIV/AIDS, and
malignancy. These were selected a priori by a global consortium to provide rapid, coordinated clinical investigation of patients presenting with any severe or potentially severe acute infection of public interest and enabled standardisation.
Clinician-defined obesity was also included as a comorbidity due its likely association with adverse outcomes in patients with covid-19.11,12 Patients with missing data on all comorbidities were assumed to
have no comorbidities. The clinical information used to calculate prognostic scores was taken from the day of admission to hospital.13 No generally accepted approaches exist to estimate sample size
requirements for derivation and validation studies of risk prediction models. We used all available data to maximise the power and generalisability of our results. Model reliability was enhanced by our use of a validation cohort and sensitivity analyses
6 Outcomes
The primary outcome was in-hospital mortality. This outcome was selected due to the importance of the early identification of patients likely to develop severe illness from SARS-CoV-2 infection (a ‘rule in’ test). We chose a priori to restrict analysis of outcomes to patients who were admitted more than four weeks before final data extraction (29th June 2020) to enable most patients to complete their hospital
admission.
Independent predictor variables
A reduced set of potential predictor variables was selected a priori including patient demographic information, common clinical investigations, and parameters consistently identified as clinically
important in covid-19 cohorts following methodology described by Wynants et al.5 Candidate predictor
variables were selected based on three common criteria:14 (1) patient and clinical variables known to
influence outcome in pneumonia and flu-like illness; (2) clinical biomarkers previously identified within the literature as potential predictors in covid-19 patients; and (3) values were available for at least two-thirds of patients within the derivation cohort.
With the overall aim to develop an easy-to-use risk stratification score, an a priori decision was made to include an overall comorbidity count for each patient within model development giving each
comorbidity equal weight, rather than individual comorbidities. Recent evidence suggests an additive effect of comorbidity in covid-19 patients, with increasing number of comorbidities associated with poorer outcomes.15
Model development
Models were trained using all available data up to 20th May 2020. The primary intention was to create a
pragmatic model for bedside use not requiring complex equations, online calculators, or mobile applications. An a priori decision was therefore made to categorise continuous variables in the final prognostic score.
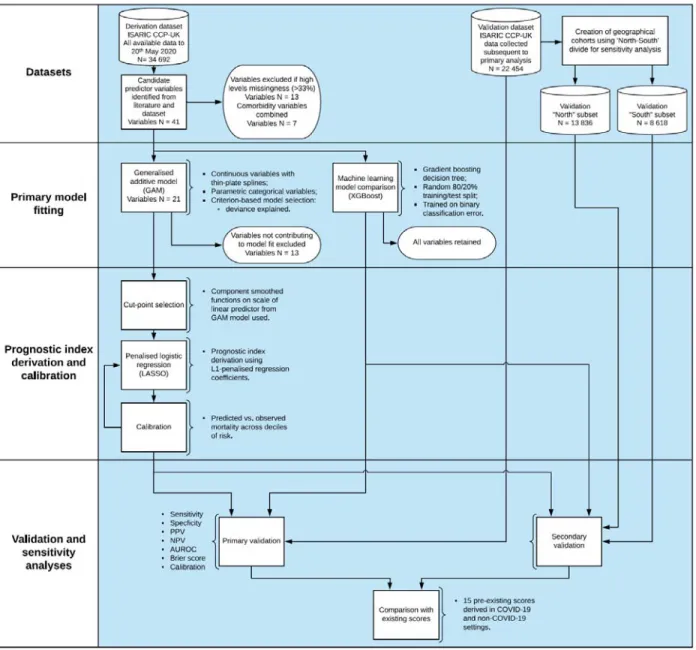
A three-stage model building process was used (Figure 1). Firstly, generalised additive models (GAMs) were built incorporating continuous smoothed predictors (thin-plate splines) in combination with categorical predictors as linear components. A criterion-based approach to variable selection was taken based on the deviance explained, the unbiased risk estimator, and the area under the receiver operating characteristic curve (AUROC) (see Appendix 2).
Secondly, plots of component smoothed continuous predictors were visually inspected for linearity and optimal cut-points were selected using the methods of Barrio et al.16
Lastly, final models using categorised variables were specified using least absolute shrinkage and selection operator (LASSO) logistic regression. L1-penalised coefficients were derived using 10-fold cross-validation to select the value of lambda (minimised cross-validated sum of squared residuals). Shrunk coefficients were converted to a prognostic index with appropriate scaling to create the
Machine learning approaches were used in parallel for comparison of predictive performance. Given issues with interpretability, this was intended to provide a “best-in-class” comparison of predictive performance when accounting for any complex underlying interactions. Extreme gradient boosting trees were used (XGBoost). All candidate predictor variables identified were included within the model, with the exception of those with high missing values (>33%). Individual major comorbidity variables, defined as chronic cardiac disease; chronic respiratory disease (excluding asthma); chronic renal disease
(estimated glomerular filtration rate ≤30 mL/min/1.73m2); moderate-to-severe liver failure (presence of
portal hypertension); diabetes mellitus (diet, tablet or insulin-controlled) and solid malignancy, together with obesity, were retained within the model to determine whether their inclusion enhanced predictive performance. An 80%/20% random split of the derivation dataset was used to define train/test sets. The validation datasets were held back and not used in the training process. A mortality label and design matrix of centred/standardised continuous and categorical variables including all candidate variables was used to train gradient boosted trees minimising the binary classification error rate (defined as number wrong cases / number all cases). Hyperparameters were tuned including the learning rate and maximum tree depth to maximise the AUROC in the test set.
Discrimination was assessed for all above models (4C and XGBoost model) using the AUROC in the derivation cohort, with 95% confidence intervals (CI) calculated using bootstrapping resampling (2000 samples). An AUROC value of 0.5 indicates no predictive ability, 0.8 is considered good, and 1.0 is perfect.17 Overall goodness-of-fit was assessed with the Brier score,18 a measure to quantify how close
predictions are to the truth ranging between 0 and 1, where smaller values indicate superior model performance. We plotted model calibration curves to examine agreement between predicted and observed risk across deciles of mortality risk to ascertain the presence of over- or under-prediction. Risk cut-off values were defined by the total point score for an individual which represented a low (<2% mortality rate), intermediate (2-14.9%) or high-risk (≥15%) groups, similar to commonly used pneumonia risk stratification scores.19,20
Sensitivity analyses of missing values in potential candidate variables were performed using multiple imputation by chained equations, under the missing at random assumption. Ten sets, each with 10 iterations, were imputed using available explanatory variables for both cohorts (derivation and validation). The outcome variable was included as a predictor in the derivation but not validation dataset. Model derivation was explored in imputed datasets. All models developed in the complete case derivation dataset were tested in the imputed validation dataset, with Rubin’s rules21 used to combine
model parameter estimates.
Model validation
Patients entered subsequently into the ISARIC WHO CCP-UK study after 20th May 2020 were included in
a separate validation cohort (Figure 1). We determined discrimination, calibration, and performance across a range of clinically relevant metrics. To avoid bias in the assessment of outcomes, patients who admitted within four weeks prior to data extraction on 29th June 2020 were excluded.
A sensitivity analysis was also performed, with stratification of the validation cohort by geographical location. This geographical categorisation was selected based on well-described economic and health inequalities between the north and south of the UK.22,23 Recent analysis has demonstrated the impact of
8 deprivation on risk of dying with covid-19.24 As a result, population differences between regions may
change the discriminatory performance of risk stratification scores. Two geographical cohorts were created, based on north-south geographical locations across the United Kingdom as defined by Hacking et al.22 A further sensitivity analysis was performed to determine model performance in ethnic minority
groups, given reported differences in covid-19 outcomes.25
All tests were two-tailed and p values <0.05 were considered statistically significant. We used R (version 3.6.3) with the finalfit, glmnet, pROC, recipes, xgboost, rmda, and tidyverse packages for all statistical analysis.
Comparison with existing risk stratification scores
All derived models in the derivation dataset were compared within the validation cohort with existing scores. Model performance was assessed using the AUROC statistic, sensitivity, specificity, positive predictive value (PPV), and negative predictive value (NPV). Existing risk stratification scores were identified through a systematic literature search of EMBASE, WHO Medicus, and Google Scholar databases. We used the search terms “pneumonia”, “sepsis”, “influenza”, “COVID-19”, “SARS-CoV-2”, “coronavirus” combined with “score”’ and “prognosis”. We applied no language or date restrictions.The last search was performed on 1st July 2020. Risk stratification tools were included whose variables were
available within the database and had accessible methodology for calculation.
Performance characteristics were calculated according to original publications, and score cut-offs for adverse outcomes were selected based on the most commonly used criteria identified during the literature search. Cut-offs were the score value for which the patient was considered at low- or high-risk of adverse outcome, as defined by study authors. Patients with one or more missing input variables were omitted for that particular score.
A decision curve analysis (DCA) was also performed.26 Briefly, assessment of the adequacy clinical
prediction models can be extended by determining clinical utility. Using DCA, a clinical judgment of the relative value of benefits (treating a true positive) and harms (treating a false positive) associated with a clinical prediction tool can be made. The standardised net benefit was plotted against the threshold probability for considering a patient “high risk” for age alone and the best discriminating models applicable to >50% of patients in the validation cohort.
Patient and public involvement
This was an urgent public health research study in response to a Public Health Emergency of
International Concern. Patients or the public were not involved in the design, conduct, or reporting of this rapid response research.
10
Results
In the derivation cohort, we collected data from 34 692 patients between 6th February 2020 and 20th
May 2020. The overall mortality was 31.7% (10 998 patients). The median age of patients in the cohort was 74 (interquartile range (IQR) 59-83) years. 58.3% (20 184) were male and 75.3% (26 135) patients had at least one comorbidity. Demographic and clinical characteristics for the derivation and validation datasets are shown in Table 1.
Model development
In total, 41 candidate predictor variables measured at hospital admission were identified for model creation (Figure 1; Appendix 2). Following the creation of a composite variable containing all seven individual comorbidities and the exclusion of 13 variables due to high levels of missing values (Appendix 3), 21 variables remained.
Generalised additive modelling (GAM) identified eight important predictors of mortality; age, sex, number of comorbidities, respiratory rate, peripheral oxygen saturation, Glasgow Coma Scale (GCS), urea, and C-reactive protein (CRP) (for variable selection process, see Appendix 4). Given the a priori need for a pragmatic score for use at the bedside, continuous variables were converted to factors with cut-points chosen using component smoothed functions (on linear predictor scale) from GAM model (Appendix 5).
On entering variables into a penalised logistic regression model (LASSO), all variables were retained within the final model (Appendix 6). Penalised regression coefficients were converted into a prognostic index using appropriate scaling (4C Mortality Score range 0-21 points; Table 2).
The 4C Mortality Score demonstrated good discrimination for in-patient death within the derivation cohort (Table 3) with performance that approached that of the XGBoost model. The 4C Mortality Score showed good calibration (Calibration slope = 1; Figure 2) across the range of risk and no adjustment to the model was required.
Table 1. Demographic and clinical characteristics for derivation and validation cohorts for patients hospitalized with covid-19.
Derivation cohort (n = 34 692)
Validation cohort (n = 22 454) Mortality (%) 10 998 (31.7) 6428 (28.6)
Age on admission (years) <50 4397 (12.7) 2825 (12.6)
50-59 4603 (13.3) 2630 (11.7)
60-69 5563 (16.0) 3155 (14.1)
70-79 7986 (23.0) 4971 (22.1)
≥80 12 143 (35.0) 8873 (39.5)
Sex at Birth Male 20 184 (58.3) 12 202 (54.4)
Female 14 411 (41.7) 10 211 (45.6) Ethnicity White 25 680 (83.2) 16 837 (85.0) South Asian 1423 (4.6) 786 (4.0) East Asian 269 (0.9) 138 (0.7) Black 1108 (3.6) 765 (3.9) Other Ethnic Minority 2387 (7.7) 1275 (6.4) Chronic cardiac disease 10 192 (32.0) 6853 (33.9)
Chronic kidney disease 5451 (17.3) 3682 (18.4)
Malignant neoplasm 3201 (10.2) 2144 (10.8)
Moderate or severe liver disease 581 (1.9) 427 (2.2)
Clinician-reported obesity 3250 (11.3) 2127 (11.9)
Chronic pulmonary disease (not
asthma) 5684 (17.9) 3671 (18.3) Diabetes 8245 (26.3) 4210 (22.0) Number of comorbidities 0 8557 (24.7) 5524 (24.6) 1 9633 (27.8) 6045 (26.9) ≥2 16 502 (47.6) 10 885 (48.5) Respiratory Rate 22.0 (8.0) 20.0 (8.0)
Peripheral oxygen saturation (%) 94.0 (6.0) 94.0 (5.0)
Systolic blood pressure (mmHg) 125.0 (33.0) 129.0 (33.0)
Diastolic blood pressure (mmHg) 70.0 (19.0) 73.0 (20.0)
Temperature (°C) 37.3 (1.6) 37.1 (1.5)
Heart Rate (bpm) 90.0 (27.0) 90.0 (28.0)
Glasgow Coma Score 15.0 (0.0) 15.0 (0.0)
pH 7.4 (0.1) 7.4 (0.1)
Bicarbonate (mmol/L) 24.5 (4.5) 24.4 (5.0)
Infiltrates on chest radiograph 13 984 (62.9) 8244 (61.1)
12 Derivation cohort
(n = 34 692)
Validation cohort (n = 22 454) White cell count (109/L) 7.4 (5.0) 7.6 (5.3)
Neutrophil count (109/L) 5.6 (4.6) 5.8 (4.9)
Lymphocyte count (109/L) 0.9 (0.6) 0.9 (0.7)
Haematocrit (%) 35.0 (40.6) 25.2 (38.6)
Platelet Count (109/L) 215.0 (120.0) 223.0 (126.0)
Prothrombin (seconds) 13.2 (3.0) 13.2 (3.2)
Activated partial thromboplastin time
(APTT) (seconds) 29.6 (8.6) 29.2 (8.8)
Sodium (mmol/L) 137.0 (6.0) 137.0 (6.0)
Potassium (mmol/L) 4.1 (0.8) 4.1 (0.7)
Total bilirubin (mg/dL) 10.0 (7.0) 10.0 (7.0)
Alanine aminotransferase (ALT)
(units/L) 26.0 (27.0) 25.0 (26.0)
Aspartate aminotransferase (AST)
(units/L) 42.0 (41.0) 48.0 (53.0)
Lactate dehydrogenase (Units/L) 432.0 (330.2) 416.5 (311.8)
Glucose (mmol/L) 6.8 (3.1) 6.8 (3.2)
Urea (mmol/L) 7.1 (6.4) 7.3 (6.8)
Creatinine (µmol/L) 86.0 (53.0) 86.0 (56.0)
Lactate (mmol/L) 1.5 (1.0) 1.5 (1.1)
C-reactive protein (CRP) (mg/dL) 85.0 (121.0) 78.0 (120.0)
Values stated as median with IQR in parentheses for continuous variables, patient number with percentage in parentheses for categorical variables. Comorbidities were defined using the Charlson Comorbidity Index, with the addition of clinician-defined obesity. Information on missing data contained within Appendix 3.
Table 2. Final 4C Mortality Score for in-hospital mortality in patients with covid-19. Prognostic index derived from penalised logistic regression (LASSO) model.
Variable 4C Mortality Score Age (years) <50 50-59 +2 60-69 +4 70-79 +6 ≥80 +7
Sex at birth Female
Male +1
Number of comorbidities*
0
1 +1
≥2 +2
Respiratory rate (breaths/minute)
<20
20-29 +1
≥30 +2
Peripheral oxygen saturation on room air (%) ≥92
<92 +2
Glasgow Coma Scale 15
<15 +2 Urea (mmol/L) ≤7 7-14 +1 >14 +3 CRP (mg/dL) <50 50-99 +1 ≥100 +2
14 Table 3. Model discrimination in derivation cohort.
AUROC, area under receiver operator curve; CI, confidence interval.
Model AUROC 95% CI Brier score
4C Mortality Score 0.79 0.78 to 0.79 0.174
Machine learning comparison
.
CC-BY-NC-ND 4.0 International license
It is made available under a
is the author/funder, who has granted medRxiv a license to display the preprint in perpetuity.
The copyright holder for this preprint
this version posted August 2, 2020. .
https://doi.org/10.1101/2020.07.30.20165464
16
.
CC-BY-NC-ND 4.0 International license
It is made available under a
is the author/funder, who has granted medRxiv a license to display the preprint in perpetuity.
The copyright holder for this preprint
this version posted August 2, 2020. .
https://doi.org/10.1101/2020.07.30.20165464
Model validation
The validation cohort included data from 22 454 patients collected between 21st May 2020 and 29th June
2020 who had at least four weeks follow-up. The overall mortality was 28.6% (10 998 patients). The median age of patients in the cohort was 76 (interquartile range (IQR) 60-85) years. 12 202 (54.4%) were male and 16 930 patients (75.4%) had at least one comorbidity (Table 1). Missing data for predictor variables within the validation cohort are summarised in Appendix 7.
Discrimination of the 4C Mortality Score in the validation cohort was similar to that of the XGBoost model. Calibration was also found to be excellent in the validation cohort (Calibration slope = 1; Appendix 8), with a similar Brier score to the derivation cohort (0.174). The 4C Mortality Score demonstrated good performance in clinically relevant metrics, across a range of cut-offs (Table 4). Four risk groups were defined with corresponding mortality rates determined (Table 5): low risk (0-3 score; mortality rate 1.0%), intermediate risk (4-8 score; 9.8%), high risk (9-14 score; 35.2%), and very high risk (≥15 score; 66.8%). Performance metrics demonstrated a high sensitivity (99.8%) and negative predictive value (NPV; 99.0%) for the low-risk group, covering 6.9% of the cohort and a corresponding mortality rate of 1.0%. Patients in the intermediate risk group (score 4-8; n = 3007, 22.7%) had a mortality rate of 9.8% (NPV 90.2%). High-risk patients (score 9-14; n = 7009, 52.9%) had a 35.2% mortality (NPV 64.8), while patients scoring ≥15(n = 2310, 17.4%) had a 66.8% mortality (positive predictive value 66.8%).
Comparison with existing tools
A total of 15 risk stratification scores were identified through a systematic literature search 6,20,27–39 The
4C Mortality Score compared well against existing risk stratification scores in predicting inpatient mortality (Table 6). Risk stratification scores originally validated in patients with community-acquired pneumonia (n = 9) generally had higher discrimination for inpatient mortality in the validation cohort (e.g., A-DROP [AUROC 0.74; 95%CI 0.73-0.75], E-CURB65 [0.76; 0.74-0.79]) (Figure 3A) than those developed within covid-19 cohorts (n = 4: Surgisphere [0.63; 0.62-0.64], DL score [0.67; 0.66-0.68], COVID-GRAM [0.71; 0.68-0.74] and Xiescore [0.73; 0.71-0.76]). Performance metrics for the 4C Mortality Score compared well against existing risk stratification scores at specified cut-offs (Appendix 10).
The number of patients in whom risk stratification scores could be applied differed due to certain variables not being available, either due to missingness or because they were not tested for/recorded in clinical practice. Seven scores could be applied to fewer than 2000 patients (<10%) in the validation cohort, due to the requirement for biomarkers or physiological parameters that were not routinely captured (e.g. lactate dehydrogenase [LDH]).
Decision curve analysis demonstrated that the 4C Mortality Score had better clinical utility across the range of threshold risks compared with the best performing existing scores applicable to >50% of the validation cohort (A-DROP and CURB65).
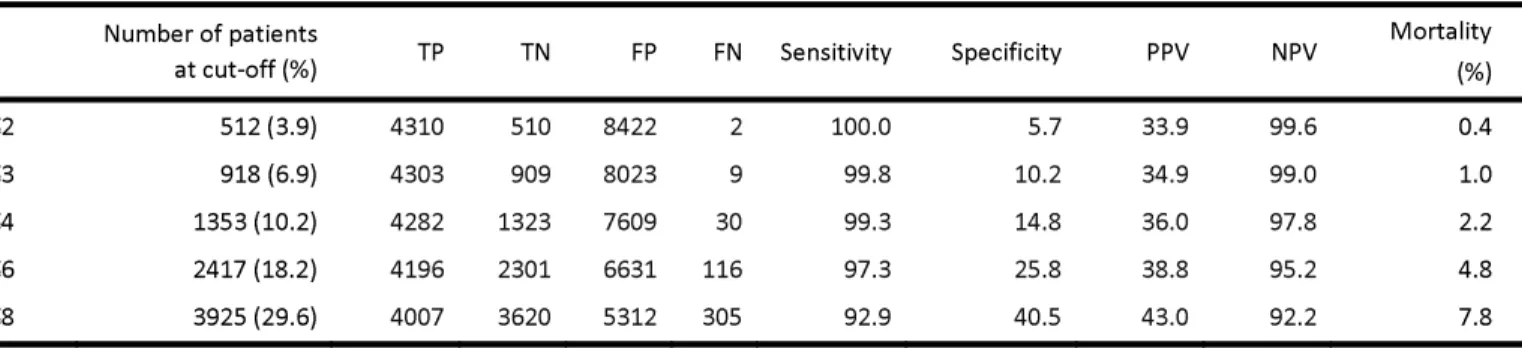
18 Table 4. Performance metrics of 4C Mortality Score to rule-out mortality (A) and rule-in mortality (B) at different cut-offs in validation cohort.
A
B
Number of patients
at cut-off (%) TP TN FP FN Sensitivity Specificity PPV NPV Mortality (%)
≥9 9319 (70.4) 4007 3620 5312 305 92.9 40.5 43.0 92.2 43.0
≥11 7109 (53.7) 3489 5312 3620 823 80.9 59.5 49.1 86.6 49.1
≥13 4495 (33.9) 2571 7008 1924 1741 59.6 78.5 57.2 80.1 57.2
≥15 2310 (17.4) 1542 8164 768 2770 35.8 91.4 66.8 74.7 66.8
TP, true positive; TN, true negative; FP, false positive; FP, false positive; PPV, positive predictive value; NPV, negative predictive value.
Table 5. Comparison of mortality rates for 4C Mortality Score risk groups across derivation and validation cohorts
Derivation cohort Validation cohort Risk group Number of
patients (%) Mortality (%) patients (%) Number of Mortality (%) Low (0-3) 1275 (6.5) 1.5 918 (6.9) 1.0 Intermediate (4-8) 4642 (23.8) 9.9 3007 (22.7) 9.8 High (9-14) 10 430 (53.4) 38.1 7009 (52.9) 35.2 Very high (≥15) 3175 (16.3) 69.8 2310 (17.4) 66.8 Overall 19522 34.2 13244 32.6 Number of patients
at cut-off (%) TP TN FP FN Sensitivity Specificity PPV NPV
Mortality (%) ≤2 512 (3.9) 4310 510 8422 2 100.0 5.7 33.9 99.6 0.4 ≤3 918 (6.9) 4303 909 8023 9 99.8 10.2 34.9 99.0 1.0 ≤4 1353 (10.2) 4282 1323 7609 30 99.3 14.8 36.0 97.8 2.2 ≤6 2417 (18.2) 4196 2301 6631 116 97.3 25.8 38.8 95.2 4.8 ≤8 3925 (29.6) 4007 3620 5312 305 92.9 40.5 43.0 92.2 7.8
Table 6. Discriminatory performance of risk stratification scores within validation cohort to predict inpatient mortality in patients hospitalised with covid-19. See appendix 10 for other metrics.
Validation cohort (N = 22 454) Number of patients with
required parameters AUROC (95% CI)
SOFA 190 0.60 (0.50 - 0.69) qSOFA 17 716 0.62 (0.62 - 0.63) SMARTCOP 476 0.63 (0.58 - 0.68) Surgisphere* 17 359 0.63 (0.62 - 0.64) NEWS2 17 455 0.66 (0.65 - 0.67) SCAP 358 0.66 (0.60 - 0.71) DL score* 15 142 0.67 (0.66 - 0.68) CRB65 17 716 0.69 (0.68 - 0.69) COVID-GRAM* 1152 0.71 (0.68 - 0.74) DS-CRB65 17 127 0.72 (0.71 - 0.73) CURB65 14 318 0.72 (0.72 - 0.73) PSI 358 0.73 (0.67 - 0.78) Xie score* 1627 0.73 (0.71 - 0.76) A-DROP 14 338 0.74 (0.73 - 0.75) E-CURB65 1438 0.76 (0.74 - 0.79) 4C Mortality Score* 13 244 0.78 (0.77 - 0.79) Machine learning comparison (XGBoost) - 0.79 (0.78 - 0.80) *novel covid-19 risk stratification score
Sensitivity analysis
Multiple imputation was performed in both the derivation and validation cohorts (predictor variables n = 41). Prognostic models derived using from the multiply imputed derivation cohort had poorer
performance than models derived using complete case data. This was true whether performance was assessed in the complete case or multiply imputed validation datasets. As a sensitivity analysis, the final model was assessed in the multiply imputed datasets. Discriminatory performance demonstrated a small reduction (≤0.02 change in AUROC) (Appendix 11) across both derivation and validation cohorts. After stratification of the validation cohort into two geographical cohorts (validation north and south; Appendix 12), discrimination remained similar for the 4C Mortality Score in both the North (AUROC 0.78, 95%CI 0.77-0.79) and South (0.77, 0.76-0.79) subsets (Appendix 13).
20
Discussion
Principal findings
We have developed and validated the eight-variable 4C Mortality Score for in-patient death in a UK prospective cohort of 57 146 patients hospitalised with covid-19. The 4C Mortality Score uses patient demographics, clinical observations, and blood parameters that are commonly available at the time of hospital admission and can accurately predict patients at a high risk of in-hospital death. It compared favourably to other models, including ‘best-in-class’ machine learning techniques and demonstrated consistent performance across the validation cohorts including good clinical utility in a decision curve analysis.
Model performance compared well against other generated models, with minimal loss in discrimination despite its pragmatic nature. A machine learning approach demonstrated a marginal improvement in discrimination, but at the cost of interpretability, the requirement for many more input variables, and the requirement for an app/website calculator limiting use at the bedside. The 4C Mortality Score demonstrated good applicability within the validation cohort (around 60% population) and consistency across all performance measures.
Comparison with other studies
The 4C Mortality Score contains parameters reflecting patient demographics, comorbidity, physiology, and inflammation on hospital admission. It shares characteristics with existing prognostic scores for sepsis and community-acquired pneumonia, as well as for scores developed in covid-19 patients. Altered consciousness and high respiratory rate are included in most risk stratification scores for sepsis and community-acquired pneumonia,19,20,27,28,31,32,35 while elevated urea is also a common component.19,20,27
Increasing age is a strong predictor of inpatient mortality within our hospitalised covid-19 cohort and is commonly included in other existing covid-19 scores,36,40,41 together with comorbidity36,40,41 and elevated
CRP.39,42
Discriminatory performance of existing covid-19 scores applied to our cohort was lower than reported in derivation cohorts (DL score 0.74; COVID-GRAM 0.88; Xie score 0.98).36,37,39 The use of small inpatient
cohorts from Wuhan, China for model development may have resulted in over-fitting,limiting generalisability in other cohorts.37,39 The Xie score demonstrated the highest discriminatory power
(0.73), including age, lymphocyte count, LDH and peripheral oxygen saturations. However, we were only able to calculate this score for <10% of the validation cohort, as LDH is not routinely captured on
admission in the UK.
Due to challenges of clinical data collection during an epidemic, missing data is common, with choice of predictors influenced by data availability.39 Complete case analysis often leads to exclusion of a
substantial proportion of the original sample, subsequently leading to a loss of precision and power.43
However, the assessment of missing data on model performance in novel covid-19 risk stratification scores has been limited36 or unexplored37,39, potentially introducing bias and further limiting
generalisability to other cohorts. We found discriminatory performance in both derivation and validation cohorts remained similar after the imputation of a wide range of variables (41), further supporting the validity of our findings.
The presence of comorbidities is handled differently in covid-19 prognostic scores, either included individually,39,41 given equal weight,36 or found to have no predictive effect.37 Recent evidence suggests
an additive effect of comorbidity in covid-19 patients, with increasing number of comorbidities associated with poorer outcomes.15 In our cohort, the inclusion of individual comorbidities within the
machine learning model conferred minimal additional discriminatory performance, supporting the inclusion of an overall comorbidity count.
Strengths and limitations of this study
The ISARIC WHO CCP-UK study represents the largest prospectively collected covid-19 hospitalised patient cohort in the world and reflects the clinical data available in most economically developed healthcare settings. We developed a clinically applicable score with clear methodology and tested it against existing risk stratification scores in a large hospitalised patient cohort. It compared favourably to other prognostic tools, with good to excellent discrimination, calibration and performance
characteristics.
The 4C Mortality Score has several methodological advantages over current covid-19 prognostic scores. The use of penalised regression methods, an event-to-variable ratio greater than 100 reducing the risk of model over-fitting,44,45 and the use of clinical parameters at first assessment increases the clinical
applicability of the score and limits use of highly selective predictors prevalent in other risk stratification scores.4,46 In addition, the sensitivity analyses demonstrated that score performance was robust.
Our study has limitations. First, we were unable to evaluate the predictive performance of a number of existing scores that comprise a large number of parameters (for example APACHE II47), as well as several
other covid-19 prognostic scores that include computed tomography findings or uncommonly measured biomarkers.5 In addition, several potentially relevant comorbidities, such as hypertension, previous
myocardial infarction and stroke15 were not included in data collection. Their inclusion might have
impacted upon or improved 4C Mortality Score performance and generalisability.
Second, a proportion of recruited patients had incomplete episodes and were thus excluded from the analysis. Selection bias is possible if patients with incomplete episodes, such as those with prolonged hospital admission, had a differential mortality risk to those with completed episodes. Nevertheless, the size of our patient cohort compares favourably to other datasets for model creation. Furthermore, the patient cohort on which the 4C Mortality Score was derived comprised hospitalised patients who were seriously ill (mortality rate of 30.5%) and were of advanced age (median age 74 years). Further external validation is required to determine whether the 4C Mortality Score is generalisable among younger patients and in settings outside the UK.
Conclusions and policy implications
We have derived and validated an easy-to-use eight-variable risk stratification score that enables accurate stratification of hospitalised covid-19 patients by mortality risk at hospital presentation. Application within the validation cohorts demonstrated this tool may guide clinician decisions, including treatment escalation.
22 The key aim of clinical risk stratification scores is to support clinical management decisions. Three risk classes were identified and demonstrated similar adverse outcome rates across the validation cohort. Patients with a 4C Mortality Score falling within the low-risk groups (mortality rate 1%) might be suitable for management in the community, while those within the intermediate-risk group were at lower risk of mortality (mortality rate 10%; 23% of the cohort) and may be suitable for ward-level monitoring. Similar mortality rates have been identified as an appropriate cut-off in pneumonia risk stratification scores (CURB-65 and PSI).19,20 Meanwhile patients with a score ≥9 were at high risk of death (43%), which may
prompt aggressive treatment, including the commencement of steroids,48 and early escalation to critical
care if appropriate.
List of figures
Figure 1. Model derivation and validation workflow.
Figure 2. A, distribution of patients across range of 4C Mortality Score in derivation cohort. B, observed inpatient mortality across range of 4C Mortality Score in derivation cohort. C, predicted versus observed probability of inpatient mortality (calibration; red line) with distribution of patients across predicted probability (vertical black lines) for 4C Mortality Score within derivation cohort.
Figure 3. Receiver operator curves (ROC) (A) and decision curve analysis (B) for most discriminating three models applicable to >50% of validation population, together with age alone (spline). B, Lines are shown for standardised net benefit at different risk thresholds of treating no patients (black) and treating all patients (grey).
References
1. Yang X, Yu Y, Xu J, Shu H, Xia J, Liu H, et al. Clinical course and outcomes of critically ill patients with SARS-CoV-2 pneumonia in Wuhan, China: a single-centered, retrospective, observational study. Lancet Respir Med. 2020;8(5):475–81.
2. COVID-19 Map [Internet]. Johns Hopkins Coronavirus Resource Center. [cited 2020 May 31]. Available from: https://coronavirus.jhu.edu/map.html
3. COVID-19 situation reports [Internet]. [cited 2020 Jun 1]. Available from:
https://www.who.int/emergencies/diseases/novel-coronavirus-2019/situation-reports
4. Tolksdorf K, Buda S, Schuler E, Wieler LH, Haas W. Influenza-associated pneumonia as reference to assess seriousness of coronavirus disease (COVID-19). Eurosurveillance. 2020 Mar
19;25(11):2000258.
5. Wynants L, Calster BV, Bonten MMJ, Collins GS, Debray TPA, Vos MD, et al. Prediction models for diagnosis and prognosis of covid-19 infection: systematic review and critical appraisal. BMJ [Internet]. 2020 Apr 7 [cited 2020 May 31];369. Available from:
https://www.bmj.com/content/369/bmj.m1328
6. Chen J-H, Chang S-S, Liu JJ, Chan R-C, Wu J-Y, Wang W-C, et al. Comparison of clinical
characteristics and performance of pneumonia severity score and CURB-65 among younger adults, elderly and very old subjects. Thorax. 2010 Nov;65(11):971–7.
7. Gupta RK, Marks M, Samuels THA, Luintel A, Rampling T, Chowdhury H, et al. Systematic
evaluation and external validation of 22 prognostic models among hospitalised adults with COVID-19: An observational cohort study. medRxiv. 2020 Jul 26;2020.07.24.20149815.
8. Features of 20Q133 UK patients in hospital with covid-19 using the ISARIC WHO Clinical Characterisation Protocol: prospective observational cohort study | The BMJ [Internet]. [cited 2020 May 30]. Available from: https://www.bmj.com/content/369/bmj.m1985
9. Collins GS, Reitsma JB, Altman DG, Moons KGM. Transparent reporting of a multivariable
prediction model for individual prognosis or diagnosis (TRIPOD): the TRIPOD statement. BMJ. 2015 Jan 7;350:g7594.
10. Charlson ME, Pompei P, Ales KL, MacKenzie CR. A new method of classifying prognostic
comorbidity in longitudinal studies: development and validation. J Chronic Dis. 1987;40(5):373–83. 11. Sattar N, McInnes IB, McMurray JJV. Obesity Is a Risk Factor for Severe COVID-19 Infection:
Multiple Potential Mechanisms. Circulation. 2020 07;142(1):4–6.
12. Simonnet A, Chetboun M, Poissy J, Raverdy V, Noulette J, Duhamel A, et al. High Prevalence of Obesity in Severe Acute Respiratory Syndrome Coronavirus-2 (SARS-CoV-2) Requiring Invasive Mechanical Ventilation. Obesity (Silver Spring). 2020;28(7):1195–9.
24 13. Dunning JW, Merson L, Rohde GGU, Gao Z, Semple MG, Tran D, et al. Open source clinical science
for emerging infections. The Lancet Infectious Diseases. 2014 Jan 1;14(1):8–9.
14. Moons KGM, Altman DG, Reitsma JB, Ioannidis JPA, Macaskill P, Steyerberg EW, et al. Transparent Reporting of a multivariable prediction model for Individual Prognosis or Diagnosis (TRIPOD): explanation and elaboration. Ann Intern Med. 2015 Jan 6;162(1):W1-73.
15. Guan W, Liang W, Zhao Y, Liang H, Chen Z, Li Y, et al. Comorbidity and its impact on 1590 patients with COVID-19 in China: a nationwide analysis. European Respiratory Journal [Internet]. 2020 May 1 [cited 2020 Jul 18];55(5). Available from: https://erj.ersjournals.com/content/55/5/2000547 16. Barrio I, Arostegui I, Quintana JM, Group I-C. Use of generalised additive models to categorise
continuous variables in clinical prediction. BMC Med Res Methodol. 2013 Jun 26;13:83.
17. Mandrekar JN. Receiver Operating Characteristic Curve in Diagnostic Test Assessment. Journal of Thoracic Oncology. 2010 Sep;5(9):1315–6.
18. Steyerberg EW, Vickers AJ, Cook NR, Gerds T, Gonen M, Obuchowski N, et al. Assessing the performance of prediction models: a framework for some traditional and novel measures. Epidemiology. 2010 Jan;21(1):128–38.
19. Lim WS, Eerden MM van der, Laing R, Boersma WG, Karalus N, Town GI, et al. Defining community acquired pneumonia severity on presentation to hospital: an international derivation and
validation study. Thorax. 2003 May 1;58(5):377–82.
20. Fine MJ, Auble TE, Yealy DM, Hanusa BH, Weissfeld LA, Singer DE, et al. A prediction rule to identify low-risk patients with community-acquired pneumonia. N Engl J Med. 1997 Jan 23;336(4):243–50.
21. Rubin DB, editor. Multiple Imputation for Nonresponse in Surveys [Internet]. Hoboken, NJ, USA: John Wiley & Sons, Inc.; 1987 [cited 2020 Jul 18]. (Wiley Series in Probability and Statistics). Available from: http://doi.wiley.com/10.1002/9780470316696
22. Hacking JM, Muller S, Buchan IE. Trends in mortality from 1965 to 2008 across the English north-south divide: comparative observational study. BMJ [Internet]. 2011 Feb 15 [cited 2020 Jul 8];342. Available from: https://www.ncbi.nlm.nih.gov/pmc/articles/PMC3039695/
23. Buchan IE, Kontopantelis E, Sperrin M, Chandola T, Doran T. North-South disparities in English mortality1965–2015: longitudinal population study. J Epidemiol Community Health. 2017 Sep 1;71(9):928–36.
24. Deaths involving COVID-19 by local area and socioeconomic deprivation - Office for National Statistics [Internet]. [cited 2020 Jul 23]. Available from:
https://www.ons.gov.uk/peoplepopulationandcommunity/birthsdeathsandmarriages/deaths/bull etins/deathsinvolvingcovid19bylocalareasanddeprivation/deathsoccurringbetween1marchand17a pril
25. Ethnicity and Outcomes from COVID-19: The ISARIC CCP-UK Prospective Observational Cohort Study of Hospitalised Patients by Ewen M. Harrison, Annemarie B. Docherty, Benjamin Barr, Iain Buchan, Gail Carson, Tom M. Drake, Jake Dunning, Cameron J. Fairfield, Carrol Gamble,
Christopher A. Green, Chris Griffiths, Sophie Halpin, Hayley E. Hardwick, Antonia Ho, Karl A. Holden, Joe Hollinghurst, Peter W. Horby, Clare Jackson, Srinivasa Vittal Katikireddi, Stephen Knight, Ronan Lyons, James MacMahon, Kenneth A. Mclean, Laura Merson, Derek Murphy, Jonathan S. Nguyen-Van-Tam, Lisa Norman, Piero L. Olliaro, Manish Pareek, Roberta Piroddi, Riinu Pius, Jonathan M. Read, Clark D. Russell, Naveed Sattar, Catherine A. Shaw, Aziz Sheikh, Ian P. Sinha, Olivia Swann, David Taylor-Robinson, Daniel Thomas, Lance Turtle, Peter JM Openshaw, J. Kenneth Baillie, Malcolm G. Semple, ISARIC4C InvestigatorsQ:: SSRN [Internet]. [cited 2020 Jul 30]. Available from: https://papers.ssrn.com/sol3/papers.cfm?abstract_id=3618215
26. Vickers AJ, Elkin EB. Decision Curve Analysis: A Novel Method for Evaluating Prediction Models. Medical Decision Making. 2006 Nov;26(6):565–74.
27. Miyashita N, Matsushima T, Oka M. The JRS Guidelines for the Management of Community-acquired Pneumonia in Adults:An Update and New Recommendations. Internal Medicine. 2006;45(7):419–28.
28. Bauer TT, Ewig S, Marre R, Suttorp N, Welte T, CAPNETZ Study Group. CRB-65 predicts death from community-acquired pneumonia. J Intern Med. 2006 Jul;260(1):93–101.
29. Dwyer R, Hedlund J, Henriques-Normark B, Kalin M. Improvement of CRB-65 as a prognostic tool in adult patients with community-acquired pneumonia. BMJ Open Respir Res. 2014;1(1):e000038. 30. Liu J, Xu F, Hui Zhou, Wu X, Shi L, Lu R, et al. Expanded CURB-65: a new score system predicts
severity of community-acquired pneumonia with superior efficiency. Sci Rep. 2016 Mar 18;6:22911.
31. National Early Warning Score (NEWS) 2 [Internet]. RCP London. 2017 [cited 2020 Jul 23]. Available from: https://www.rcplondon.ac.uk/projects/outputs/national-early-warning-score-news-2 32. Singer M, Deutschman CS, Seymour CW, Shankar-Hari M, Annane D, Bauer M, et al. The Third
International Consensus Definitions for Sepsis and Septic Shock (Sepsis-3). JAMA. 2016 Feb 23;315(8):801–10.
33. Charles PGP, Wolfe R, Whitby M, Fine MJ, Fuller AJ, Stirling R, et al. SMART-COP: a tool for predicting the need for intensive respiratory or vasopressor support in community-acquired pneumonia. Clin Infect Dis. 2008 Aug 1;47(3):375–84.
34. Vincent JL, Moreno R, Takala J, Willatts S, De Mendonça A, Bruining H, et al. The SOFA (Sepsis-related Organ Failure Assessment) score to describe organ dysfunction/failure. On behalf of the Working Group on Sepsis-Related Problems of the European Society of Intensive Care Medicine. Intensive Care Med. 1996 Jul;22(7):707–10.
26 35. Yandiola PPE, Capelastegui A, Quintana J, Diez R, Gorordo I, Bilbao A, et al. Prospective comparison
of severity scores for predicting clinically relevant outcomes for patients hospitalized with community-acquired pneumonia. Chest. 2009 Jun;135(6):1572–9.
36. Liang W, Liang H, Ou L, Chen B, Chen A, Li C, et al. Development and Validation of a Clinical Risk Score to Predict the Occurrence of Critical Illness in Hospitalized Patients With COVID-19. JAMA Intern Med [Internet]. 2020 May 12 [cited 2020 Jun 1]; Available from:
https://jamanetwork.com/journals/jamainternalmedicine/fullarticle/2766086
37. Xie J, Hungerford D, Chen H, Abrams ST, Li S, Wang G, et al. Development and external validation of a prognostic multivariable model on admission for hospitalized patients with COVID-19. medRxiv. 2020 Apr 7;2020.03.28.20045997.
38. Surgisphere - Mortality Risk Calculator [Internet]. [cited 2020 Jun 1]. Available from: https://surgisphere.com/research-tools/mortality.php
39. Zhang H, Shi T, Wu X, Zhang Z, Wang K, Bean D, et al. Risk prediction for poor outcome and death in hospital in-patients with COVID-19: derivation in Wuhan, China and external validation in London, UK | medRxiv [Internet]. [cited 2020 Jul 23]. Available from:
https://doi.org/10.1101/2020.04.28.20082222
40. Caramelo F, Ferreira N, Oliveiros B. Estimation of risk factors for COVID-19 mortality - preliminary results. medRxiv. 2020 Feb 25;2020.02.24.20027268.
41. Williams RD, Markus AF, Yang C, Salles TD, Falconer T, Jonnagaddala J, et al. Seek COVER: Development and validation of a personalized risk calculator for COVID-19 outcomes in an international network. medRxiv. 2020 May 29;2020.05.26.20112649.
42. Luo X, Zhou W, Yan X, Guo T, Wang B, Xia H, et al. Prognostic value of C-reactive protein in patients with COVID-19. Clin Infect Dis [Internet]. [cited 2020 Jun 1]; Available from:
https://academic.oup.com/cid/advance-article/doi/10.1093/cid/ciaa641/5843450
43. Sterne JAC, White IR, Carlin JB, Spratt M, Royston P, Kenward MG, et al. Multiple imputation for missing data in epidemiological and clinical research: potential and pitfalls. BMJ [Internet]. 2009 Jun 29 [cited 2020 Jul 30];338. Available from: https://www.bmj.com/content/338/bmj.b2393 44. Pavlou M, Ambler G, Seaman SR, Guttmann O, Elliott P, King M, et al. How to develop a more
accurate risk prediction model when there are few events. BMJ [Internet]. 2015 Aug 11 [cited 2020 May 23];351. Available from: https://www.ncbi.nlm.nih.gov/pmc/articles/PMC4531311/
45. Peduzzi P, Concato J, Feinstein AR, Holford TR. Importance of events per independent variable in proportional hazards regression analysis. II. Accuracy and precision of regression estimates. J Clin Epidemiol. 1995 Dec;48(12):1503–10.
46. Song Y, Zheng S, Li L, Zhang X, Zhang X, Huang Z, et al. Deep learning Enables Accurate Diagnosis of Novel Coronavirus (COVID-19) with CT images. medRxiv. 2020 Feb 25;2020.02.23.20026930.
47. Knaus WA, Draper EA, Wagner DP, Zimmerman JE. APACHE II: a severity of disease classification system. Crit Care Med. 1985 Oct;13(10):818–29.
48. Welcome — RECOVERY Trial [Internet]. [cited 2020 Jun 23]. Available from: https://www.recoverytrial.net/
28
End matter
What is already known on this topic
• There is a lack of robust, validated clinical prediction tools to identify patients with covid-19 who are at the highest risk of mortality
• Given uncertainty about how to stratify covid-19 patients, there is considerable interest in risk stratification scores to support frontline clinical decision making
• Available risk stratification tools however suffer from a high risk of bias, small sample size resulting in uncertainty, poor reporting and lack of formal validation
What this study adds
• The majority of existing covid-19 risk stratification tools performed poorly in our cohort – caution should be applied when using novel tools based on small patient populations to in-hospital cohorts with covid-19
• In contrast, our 4C (Coronavirus Clinical Characterisation Consortium) score is an easy-to-use and valid prediction tool for inpatient mortality, accurately categorising patients as being at low, intermediate, high, or very high-risk of death
• This pragmatic and clinically applicable score outperformed other risk stratification tools and had similar performance to more complex models
Statements
The study protocol is available at http://isaric4c.net/protocols; study registry https://www.isrctn.com/ISRCTN66726260.
The Corresponding Author has the right to grant on behalf of all authors and does grant on behalf of all authors, a worldwide licence
(http://www.bmj.com/sites/default/files/BMJ%20Author%20Licence%20March%202013.doc) to the Publishers and its licensees in perpetuity, in all forms, formats and media (whether known now or created in the future), to i) publish, reproduce, distribute, display and store the Contribution, ii)
translate the Contribution into other languages, create adaptations, reprints, include within collections and create summaries, extracts and/or, abstracts of the Contribution and convert or allow conversion into any format including without limitation audio, iii) create any other derivative work(s) based in whole or part on the on the Contribution, iv) to exploit all subsidiary rights to exploit all subsidiary rights that currently exist or as may exist in the future in the Contribution, v) the inclusion of electronic links from the Contribution to third party material where-ever it may be located; and, vi) licence any third party to do any or all of the above.
Acknowledgments
This work uses data provided by patients and collected by the NHS as part of their care and support #DataSavesLives. We are extremely grateful to the 2,648 frontline NHS clinical and research staff and volunteer medical students, who collected this data in challenging circumstances; and the generosity of the participants and their families for their individual contributions in these difficult times. We also acknowledge the support of Jeremy J Farrar, Nahoko Shindo, Devika Dixit, Nipunie Rajapakse, Piero Olliaro, Lyndsey Castle, Martha Buckley, Debbie Malden, Katherine Newell, Kwame O’Neill, Emmanuelle Denis, Claire Petersen, Scott Mullaney, Sue MacFarlane, Chris Jones, Nicole Maziere, Katie Bullock, Emily Cass, William Reynolds, Milton Ashworth, Ben Catterall, Louise Cooper, Terry Foster, Paul Matthew Ridley, Anthony Evans, Catherine Hartley, Chris Dunn, Debby Sales, Diane Latawiec, Erwan Trochu, Eve Wilcock, Innocent Gerald Asiimwe, Isabel Garcia-Dorival, J. Eunice Zhang, Jack Pilgrim, Jane A Armstrong, Jordan J. Clark, Jordan Thomas, Katharine King, Katie Alexandra Ahmed, Krishanthi S Subramaniam , Lauren Lett, Laurence McEvoy, Libby van Tonder, Lucia Alicia Livoti, Nahida S Miah, Rebecca K. Shears, Rebecca Louise Jensen, Rebekah Penrice-Randal, Robyn Kiy, Samantha Leanne Barlow, Shadia
Khandaker, Soeren Metelmann, Tessa Prince, Trevor R Jones, Benjamin Brennan, Agnieska Szemiel, Siddharth Bakshi, Daniella Lefteri, Maria Mancini, Julien Martinez, Angela Elliott, Joyce Mitchell, John McLauchlan, Aislynn Taggart, Oslem Dincarslan, Annette Lake, Claire Petersen, and Scott Mullaney.
ISARIC Coronavirus Clinical Characterisation Consortium (ISARIC4C) Investigators
Consortium Lead Investigator J Kenneth Baillie, Chief Investigator Malcolm G Semple, Co-Lead
Investigator Peter JM Openshaw. ISARIC Clinical Coordinator Gail Carson. Co-Investigators: Beatrice Alex, Benjamin Bach, Wendy S Barclay, Debby Bogaert, Meera Chand, Graham S Cooke, Annemarie B
Docherty, Jake Dunning, Ana da Silva Filipe, Tom Fletcher, Christopher A Green, Ewen M Harrison, Julian A Hiscox, Antonia Ying Wai Ho, Peter W Horby, Samreen Ijaz, Saye Khoo, Paul Klenerman, Andrew Law,
30 Wei Shen Lim, Alexander, J Mentzer, Laura Merson, Alison M Meynert, Mahdad Noursadeghi, Shona C Moore, Massimo Palmarini, William A Paxton, Georgios Pollakis, Nicholas Price, Andrew Rambaut, David L Robertson, Clark D Russell, Vanessa Sancho-Shimizu, Janet T Scott, Louise Sigfrid, Tom Solomon, Shiranee Sriskandan, David Stuart, Charlotte Summers, Richard S Tedder, Emma C Thomson, Ryan S Thwaites, Lance CW Turtle, Maria Zambon. Project Managers Hayley Hardwick, Chloe Donohue, Jane Ewins, Wilna Oosthuyzen, Fiona Griffiths. Data Analysts: Lisa Norman, Riinu Pius, Tom M Drake, Cameron J Fairfield, Stephen Knight, Kenneth A Mclean, Derek Murphy, Catherine A Shaw. Data and Information System Manager: Jo Dalton, Michelle Girvan, Egle Saviciute, Stephanie Roberts Janet Harrison, Laura Marsh, Marie Connor. Data integration and presentation: Gary Leeming, Andrew Law, Ross Hendry. Material Management: William Greenhalf, Victoria Shaw, Sarah McDonald. Outbreak Laboratory Volunteers: Katie A. Ahmed, Jane A Armstrong, Milton Ashworth, Innocent G Asiimwe, Siddharth Bakshi, Samantha L Barlow, Laura Booth, Benjamin Brennan, Katie Bullock, Benjamin WA Catterall, Jordan J Clark, Emily A Clarke, Sarah Cole, Louise Cooper, Helen Cox, Christopher Davis, Oslem Dincarslan, Chris Dunn, Philip Dyer, Angela Elliott, Anthony Evans, Lewis WS Fisher, Terry Foster, Isabel Garcia-Dorival, Willliam Greenhalf, Philip Gunning, Catherine Hartley, Antonia Ho, Rebecca L Jensen, Christopher B Jones, Trevor R Jones, Shadia Khandaker, Katharine King, Robyn T. Kiy, Chrysa Koukorava, Annette Lake, Suzannah Lant, Diane Latawiec, L Lavelle-Langham, Daniella Lefteri, Lauren Lett, Lucia A Livoti, Maria Mancini, Sarah McDonald, Laurence McEvoy, John McLauchlan, Soeren Metelmann, Nahida S Miah, Joanna Middleton, Joyce Mitchell, Shona C Moore, Ellen G Murphy, Rebekah Penrice-Randal, Jack Pilgrim, Tessa Prince, Will Reynolds, P. Matthew Ridley, Debby Sales, Victoria E Shaw, Rebecca K Shears, Benjamin Small, Krishanthi S Subramaniam, Agnieska Szemiel, Aislynn Taggart, Jolanta Tanianis, Jordan Thomas, Erwan Trochu, Libby van Tonder, Eve Wilcock, J. Eunice Zhang. Local Principal
Investigators: Kayode Adeniji, Daniel Agranoff, Ken Agwuh, Dhiraj Ail, Ana Alegria, Brian Angus, Abdul Ashish, Dougal Atkinson, Shahedal Bari, Gavin Barlow, Stella Barnass, Nicholas Barrett, Christopher Bassford, David Baxter, Michael Beadsworth, Jolanta Bernatoniene, John Berridge , Nicola Best , Pieter Bothma, David Brealey, Robin Brittain-Long, Naomi Bulteel, Tom Burden , Andrew Burtenshaw, Vikki Caruth, David Chadwick, Duncan Chambler, Nigel Chee, Jenny Child, Srikanth Chukkambotla, Tom Clark, Paul Collini, Catherine Cosgrove, Jason Cupitt, Maria-Teresa Cutino-Moguel, Paul Dark, Chris Dawson, Samir Dervisevic, Phil Donnison, Sam Douthwaite, Ingrid DuRand, Ahilanadan Dushianthan, Tristan Dyer, Cariad Evans , Chi Eziefula, Chrisopher Fegan, Adam Finn, Duncan Fullerton, Sanjeev Garg, Sanjeev Garg, Atul Garg, Jo Godden, Arthur Goldsmith, Clive Graham, Elaine Hardy, Stuart Hartshorn, Daniel Harvey, Peter Havalda, Daniel B Hawcutt, Maria Hobrok, Luke Hodgson, Anita Holme, Anil Hormis, Michael Jacobs, Susan Jain, Paul Jennings, Agilan Kaliappan, Vidya Kasipandian, Stephen Kegg, Michael Kelsey, Jason Kendall, Caroline Kerrison, Ian Kerslake, Oliver Koch, Gouri Koduri, George Koshy , Shondipon Laha, Susan Larkin, Tamas Leiner, Patrick Lillie, James Limb, Vanessa Linnett, Jeff Little, Michael MacMahon, Emily MacNaughton, Ravish Mankregod, Huw Masson , Elijah Matovu, Katherine
McCullough, Ruth McEwen , Manjula Meda, Gary Mills , Jane Minton, Mariyam Mirfenderesky, Kavya Mohandas, Quen Mok, James Moon, Elinoor Moore, Patrick Morgan, Craig Morris, Katherine
Mortimore, Samuel Moses, Mbiye Mpenge, Rohinton Mulla, Michael Murphy, Megan Nagel, Thapas Nagarajan, Mark Nelson, Igor Otahal, Mark Pais, Selva Panchatsharam, Hassan Paraiso, Brij Patel, Justin Pepperell, Mark Peters, Mandeep Phull , Stefania Pintus, Jagtur Singh Pooni, Frank Post, David Price, Rachel Prout, Nikolas Rae, Henrik Reschreiter, Tim Reynolds, Neil Richardson, Mark Roberts, Devender Roberts, Alistair Rose, Guy Rousseau, Brendan Ryan, Taranprit Saluja, Aarti Shah, Prad Shanmuga, Anil Sharma, Anna Shawcross, Jeremy Sizer, Richard Smith, Catherine Snelson, Nick Spittle, Nikki Staines ,
Tom Stambach, Richard Stewart, Pradeep Subudhi, Tamas Szakmany, Kate Tatham, Jo Thomas, Chris Thompson, Robert Thompson, Ascanio Tridente, Darell Tupper - Carey, Mary Twagira, Andrew Ustianowski, Nick Vallotton, Lisa Vincent-Smith, Shico Visuvanathan , Alan Vuylsteke, Sam Waddy, Rachel Wake, Andrew Walden, Ingeborg Welters, Tony Whitehouse, Paul Whittaker, Ashley Whittington, Meme Wijesinghe, Martin Williams, Lawrence Wilson, Sarah Wilson, Stephen Winchester, Martin Wiselka, Adam Wolverson, Daniel G Wooton, Andrew Workman, Bryan Yates, Peter Young.
Contributions
MG Semple is guarantor and corresponding author for this work, and attests that all listed authors meet authorship criteria and that no others meeting the criteria have been omitted.
Contributor role taxonomy (CRediT).
Conceptualisation SRK, AH, RP, GC, JD, PWH, LM, JSN-V-T, CS, PJMO, JKB, MGS, ABD, EMH, Data curation: RP, SH, KAH, CJ, KAM, LM, LN, CDR, CAS, MGS, ABD, EMH. Formal analysis: SRK, AH, RP, TMD, CJF, KAM, MGP, LT, EMH. Funding acquisition: PWH, JSN-V-T, TS, PJMO, JKB, MGS, ABD. Investigation: SRK, AH, CDR, OVS, LT, PJMO, JKB, MGS, ABD, EMH. Methodology: SRK, AH, RP, IB, KAM, CAS, AS, CS, ABD, EMH. Project administration: SH, HEH, CJ, LM, LN, CDR, CAS, MGS. Resources: CG, PWH, LM, TS, MGS, EMH. Software: SRK, RP, KAM, OVS. Supervision: SRK, RP, CG, HEH, PWH, PLO, PJMO, JKB, MGS, EMH. Visualisation: SRK, RP, MGP, EMH. Writing-original draft: SRK, EMH. Writing-review and editing: SRK, RG, AH, RP, IB, GC, TMD, JD, CJF, LM, MN, JSN-V-T, PLO, MGP, CDR, AS, CS, OVS, LT, PJMO, JKB, MGS, ABD, EMH.
Funding
This work is supported by grants from: the National Institute for Health Research (NIHR) [award CO-CIN-01], the Medical Research Council [grant MC_PC_19059] and by the NIHR Health Protection Research Unit (HPRU) in Emerging and Zoonotic Infections at University of Liverpool in partnership with Public Health England (PHE), in collaboration with Liverpool School of Tropical Medicine and the University of Oxford [award 200907], NIHR HPRU in Respiratory Infections at Imperial College London with PHE [award 200927], Wellcome Trust and Department for International Development [215091/Z/18/Z], and the Bill and Melinda Gates Foundation [OPP1209135], and Liverpool Experimental Cancer Medicine Centre (Grant Reference: C18616/A25153), NIHR Biomedical Research Centre at Imperial College
London [IS-BRC-1215-20013], EU Platform foR European Preparedness Against (Re-) emerging Epidemics (PREPARE) [FP7 project 602525] and NIHR Clinical Research Network for providing infrastructure support for this research. PJMO is supported by a NIHR Senior Investigator Award [award 201385]. LT is
supported by the Wellcome Trust [award 205228/Z/16/Z]. MN is funded by a WT investigator award (207511/Z/17/Z) and the NIHR University College London Hospitals Biomedical Research Centre. The views expressed are those of the authors and not necessarily those of the DHSC, DID, NIHR, MRC, Wellcome Trust or PHE.
32
Competing Interests
All authors have completed the ICMJE uniform disclosure form at www.icmje.org/coi_disclosure.pdf and declare:
AB Docherty reports grants from Department of Health and Social Care, during the conduct of the study; grants from Wellcome Trust, outside the submitted work; CA Green reports grants from DHSC National Institute of Health Research UK, during the conduct of the study; PW Horby reports grants from Wellcome Trust / Department for International Development / Bill and Melinda Gates Foundation, grants from NIHR, during the conduct of the study; JS Nguyen-Van-Tam reports grants from Department of Health and Social Care, England, during the conduct of the study; and is seconded to the Department of Health and Social Care, England (DHSC); MN is supported by a Wellcome Trust investigator award and the NIHR University College London Hospitals Biomedical Research Centre (BRC). PJM Openshaw reports personal fees from consultancies and from European Respiratory Society; grants from MRC, MRC Global Challenge Research Fund, EU, NIHR BRC, MRC/GSK, Wellcome Trust, NIHR (HPRU in Respiratory
Infection), and NIHR Senior Investigator outside the submitted work. His role as President of the British Society for Immunology was unpaid but travel and accommodation at some meetings was provided by the Society. JK Baillie reports grants from Medical Research Council UK; MG Semple reports grants from DHSC National Institute of Health Research UK, grants from Medical Research Council UK, grants from Health Protection Research Unit in Emerging & Zoonotic Infections, University of Liverpool, during the conduct of the study; other from Integrum Scientific LLC, Greensboro, NC, USA, outside the submitted work. L Turtle reports grants from Health Protection Research Unit in Emerging & Zoonotic Infections, University of Liverpool, during the conduct of the study and grants from the Wellcome Trust outside the submitted work. EM Harrison, H Ardwick, J Dunning, R Gupta, R Pius, L Norman, KA Holden, JM Read, G Carson, L Merson, J Lee, D Plotkin, L Sigfrid, S Halpin, C Jackson, and C Gamble, all declare: no support from any organisation for the submitted work; no financial relationships with any organisations that might have an interest in the submitted work in the previous three years; and no other relationships or activities that could appear to have influenced the submitted work.
Ethical approval
Ethical approval was given by the South Central – Oxford C Research Ethics Committee in England (Ref: 13/SC/0149), and by the Scotland A Research Ethics Committee (Ref: 20/SS/0028). The study was registered at https://www.isrctn.com/ISRCTN66726260.
Data sharing
We welcome applications for data and material access via our Independent Data And Material Access Committee (https://isaric4c.net).
Dissemination to participants and related patient and public communities
ISARIC4C has a public facing website isaric4c.net and twitter account @CCPUKstudy. We are engaging with print and internet press, television, radio, news, and documentary programme makers. We will explore distribution of findings with The Asthma UK and British Lung Foundation Partnership and take advice from NIHR Involve and GenerationR Alliance Young People’s Advisory Groups.
0 1000 2000 3000 4000 0 5 10 15 20 Score value Patient count
A
B
C
0.0 0.1 0.2 0.3 0.4 0.5 0.6 0.7 0.8 0.9 1.0 0.0 0.1 0.2 0.3 0.4 0.5 0.6 0.7 0.8 0.9 1.0 Predicted probability Obser ved probability 0 20 40 60 80 100 0 5 10 15 20 Score value Probability of death (%)0.0
0.2
0.4
0.6
0.8
1.0
0.0
0.2
0.4
0.6
0.8
1.0
Standardised N
et Benefit
4C
A-DROP
CURB65
Age
All
None
High Risk Threshold
0.00 0.25 0.50 0.75 1.00 0.00 0.25 0.50 0.75 1.00