http://wrap.warwick.ac.uk
Original citation:
Colledani, M., Bolognese, L., Ceglarek, Darek, Franchini, F., Marine, C. and Mistry, A..
(2015) Multi-objective early-stage design of automotive hybrid assembly lines. Procedia
CIRP, Volume 28 . pp. 125-130. ISSN 2212-8271
Permanent WRAP url:
http://wrap.warwick.ac.uk/67487
Copyright and reuse:
The Warwick Research Archive Portal (WRAP) makes this work of researchers of the
University of Warwick available open access under the following conditions.
This article is made available under the Attribution-NonCommercial-NoDerivatives 4.0
(CC BY-NC-ND 4.0) license and may be reused according to the conditions of the
license. For more details see:
http://creativecommons.org/licenses/by-nc-nd/4.0
/
A note on versions:
The version presented in WRAP is the published version, or, version of record, and may
be cited as it appears here.
Procedia CIRP 28 ( 2015 ) 125 – 130
2212-8271 © 2014 The Authors. Published by Elsevier B.V. This is an open access article under the CC BY-NC-ND license (http://creativecommons.org/licenses/by-nc-nd/4.0/).
Selection and peer-review under responsibility of the International Scientific Committee of the “3rd CIRP Global Web Conference” in the person of the Conference Chair Dr. Alessandra Caggiano.
doi: 10.1016/j.procir.2015.04.021
ScienceDirect
3rd CIRP Global Web Conference
Multi-objective early-stage design of automotive hybrid assembly
lines
Colledani M.
a*, Bolognese L.
b, Ceglarek D.
c, Franchini F.
d, Marine C.
e, Mistry A.
faPolitecnico di Milano, Via la Masa 1, Milan 20157, Italy b Comau, Via Rivalta 30, Grugliasco, Torino, 10095, Italy
cInternational Manufacturing Centre, WMG, University of Warwick, Coventry, CV4 7AL, UK d Enginesoft, Via Panciatichi, 40, 50127 Firenze – Italy.
eStadco Limited, Hortonwood, Telford, Shropshire TF1 7LL, UK fJaguar Land Rover, Halewood, Merseyside, UK
* Corresponding author. Tel.: +39-02-23998530 ; fax: +39-02-23998585 .E-mail address: [email protected] .
Abstract
Hybrid assembly lines include multiple assembly technologies, such as RSW (Resistance Spot Welding) and RLW (Remote Laser Welding). The early-stage design of these automotive assembly lines is a critical, multi-objective task. The design process is typically carried out in industry by continuous iterations between the process design department and the simulation and systems engineering department. This results in a time consuming and cost-inefficient procedure. This paper presents a novel approach and a software platform to support the early stage design of hybrid assembly lines. It relies on the integration of a Process Concept Generator and a System Configuration Module, which is based on analytical performance evaluation models, thus drastically reducing the overall time and cost of the design procedure. The effectiveness of the proposed approach in industrial settings is shown by a real door assembly line in the automotive industry, analyzed within the EU FP7 funded project RLW Navigator.
© 2014 The Authors. Published by Elsevier B.V.
Selection and peer-review under responsibility of the International Scientific Committee of the 3rd CIRP Global Web Conference in the person of the Conference Chair Dr. Alessandra Caggiano
Keywords: Assembly; Automotive; Remote Laser Welding; System Design; Optimization;
1. Introduction, motivation and objective
The early stage design of automotive assembly lines is a challenging task typically involving the selection of the proper resources, the definition of the assembly tasks, the task assignment to the different stations, the definition of the material flow and the verification of the system performance against multiple design requirements, such as throughput, cost, floor-space, and energy. In the industrial practice this task is usually carried out by multiple iterations between the design department, which selects the resources and the assembly sequence, and the simulation department, which optimizes the configuration and verifies the performance by discrete event simulation models, also
taking into consideration the machine reliability parameters [1]. However, this design methodology leads to a time-consuming procedure that usually requires between 30 and 60 days to converge. Due to the shorter and shorter design times required by the customers in this highly dynamic industry, this performance represents a bottleneck to the whole assembly line delivery process. Moreover, due to the lack of specific software platforms to support the early stage design process, the knowledge generated during the design is typically not re-used for future problems [2]. As a matter of fact, this important phase is still based on humanly driven, trial and error approaches that also reduce the ability of delivering first-time-right designs, thus ending up in expensive design adjustments and modifications during the system commissioning phase.
© 2014 The Authors. Published by Elsevier B.V This is an open access article under the CC BY-NC-ND license (http://creativecommons.org/licenses/by-nc-nd/4.0/).
126 M. Colledani et al. / Procedia CIRP 28 ( 2015 ) 125 – 130
These limitations are even more evident while designing automotive assembly lines that integrate multiple assembly technologies, namely hybrid assembly lines. For example, Remote Laser Welding (RLW) is an emerging technology in automotive applications enabling five times shorter processing times, 30% reduction in energy consumption and higher flexibility with respect to the traditional Resistance Spot Welding (RSW) technology [3]. However, due to the need of a tight part-to-part gap control, usually included between 0.05 mm and 0.3 mm, RLW cannot be applied to any type of weld, but only specific assembly tasks can be performed by RLW. Therefore, RLW enabled assembly lines are usually hybrid in the sense that they integrate both RSW and RLW technologies. These features make the design of the assembly line more complex, as a larger number of technically feasible line options need to be evaluated to optimize the system configuration.
This paper presents a new methodology implemented in a software platform to support the design of hybrid assembly lines in the automotive industry, developed within the EU funded project “RLW Navigator”. The platform is based on the integration of a Process Concept Generator, where the user is enabled to quickly populate the assembly line with technological contents, selecting the resources from a component database, and a System Configuration Module, where several system configurations can be tested before implementation by exploiting the features of a fast performance evaluation module, based on approximate analytical methods. The main advantages of the proposed methodology are shown by application to a real assembly line in Jaguar Land Rover. The reminder of the paper is organized as follows. In section 2 the methodology is outlined with respect to the main phases of the proposed approach. In section 3 the specific methods and tools included in the platform are explained in details. Section 4 shows the results obtained by the application of the approach to the industrial reference case. Conclusions and future research directions are discussed in section 5.
2.Outline of the approach
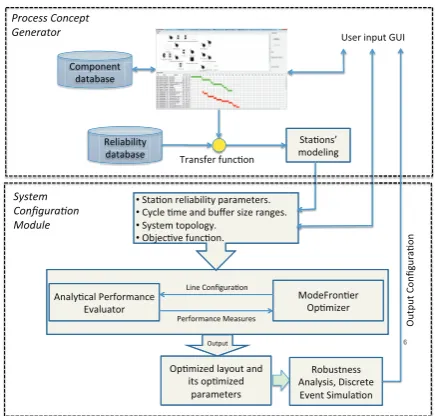
The phases of the developed design approach are represented in Figure 1. In the first layer, the Process Concept Generator, the designer can interact with the software platform through a customized user interface to populate the system with resources, selected from a pre-defined database, thus generating an initial assembly line configuration. In this phase, basic system Key Performance Indicator (KPIs) are also visualized to enable the user to check the expected cost and the cycle time of the solution during the design process. The resources can be clustered into stations performing a homogenous set of operations. Moreover, initial task
[image:3.595.308.526.300.508.2]sequencing can be performed and visualized within this platform. Once the initial configuration has been generated, the reliability data of the different resources are automatically retrieved by the reliability database and the station models as well as the system topology to be further optimized are provided in input to the second layer, by the so-called transfer function. In the second layer, the System Configuration Module, a set of different alternative system configurations are automatically generated by an optimization algorithm and analyzed by the analytical performance evaluation model. Upon convergence of the selected optimization algorithm, the Pareto-optimal configurations are exported and visualized to the user via GUI. The user can perform post-processing activities, such as robustness analysis and simulation, to validate the provided configurations before implementation. The designer can further refine the optimal solution and run a new optimization by using the ability of continuously interacting with the software platform.
Fig. 1. Phases of the developed assembly line design approach.
As it can be noticed, the developed platform features relevant innovations with respect to scientific state-of-the-art approaches. For example, in [4] a method for assembly line design was presented, based on the automatic generation of system design options and on simulation-based optimization. In our approach, the first phase is expert-driven, while the second phase is based on fast analytic optimization procedures. All in all, this approach provides to the designer the ability to control and manage the process in each design phase, thus avoiding the generation of black-box solutions that are typically not accepted by industrial users. In the following, the methods and tools adopted in each phase of the approach are presented in details.
6
($!! '&#!
!$! $)!
•#$!#( !#!",
•($&!")!",
•("## (,
•$'&$,
&!$ !!"&!" $)(&# #" $) !#!" &# &# # #" #( #" !"!&$ &"#"" (""+"!# '#&$ "! &# # #" #( #" !"!&$ "! &# ($!! '&#! !$! $)!
•#$!#( !#!",
•($&!")!",
•("## (,
3. Methods and tools description
3.1.Process Concept Generator
In the Process Concept Generation layer, a user-driven approach is adopted, that is preliminary to the automated system configuration optimization. Although some of the activities performed in this layer could be supported by advanced algorithms and methods, for example Assembly Line Balancing (ALB) tools [5][6], a specific requirement for this platform gathered from the industrial partners of the RLW Navigator project was to keep this procedure driven by the experts’ knowledge. The main reason is to ensure the usability of the platform and the full control of the user on the design procedure. The Process Concept Generator is composed of several tools that support the following activities:
• Design requirements and constraint assignment. • Selection of resources from a database. • Task assignment and sequencing. • Clustering resources into stations.
The first activity is the definition of the design requirements. In detail, the user can assign the maximal annual volume, the annual working days, the working shifts per day, the working time per shift and the expected average OEE (Overall Equipment Effectiveness), typically fixed to 80%.
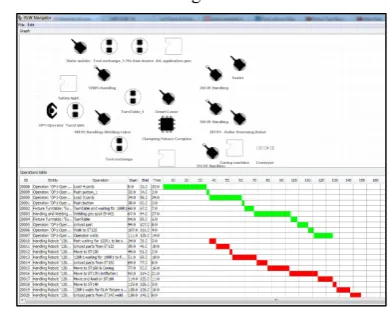
For supporting the second activity, a database of resources has been populated by exploiting the competence of the industrial experts within the project. The resources in the database have been characterized by attributes, including the cost, the required floor-space and the size (small, medium and large). The characterization of the resources has been specifically targeted to an early design phase, thus avoiding very specific technical details. For example, fixtures, pedestal spot welders, turntables, 6-axis and 7-axis robots, laser welding robots, laser sources, process monitoring devices, etc. can be selected from this database. Upon selection, the software visualizes the presence of these elements in the 2D workspace with basic icons. The next activity the user can perform is task assignment. For each resource, one or more activities can be selected from a comprehensive list of typical operations performed in automotive assembly lines. For example, clamping, riveting, welding, brazing, but also transfer, load, unload, etc. operations are selectable. To each activity an execution time can be assigned. Then, in the task-sequencing phase, the user is enabled to create relational links (precedence, parallel execution) between these activities. A task sequence graph, similar to the one reported in the lower part of Figure 2, is automatically generated. The user can directly interact with this activity schedule to adjust the plan with respect to the design cycle time requirements, also visualized in
this map. Finally, the user can cluster the resources into stations; if a resource is shared between more stations, specific operation units can be explicitly assigned to different stations.
Once these phases have been performed, knowledge based algorithms are embedded to automatically pre-process the data and transfer them, in a structured format, to the System Configuration Module. In details, the activities performed by these pre-processing functions are:
• Gathering of reliability parameters from a database. • Station model generation.
• System topology generation.
[image:4.595.319.515.236.392.2]These activities and the enabling features of the platform are described in the following.
Fig. 2. Snapshot of the Process Concept Generator.
For each of the selected components, reliability data consisting of the MTTF (Mean Time to Failure) and the MTTR (Mean Time to Repair) are extracted from a component database. In the developed platform, the database adopted by Comau, industrial partner of the project, has been integrated. Starting from these data at component level, the station models are generated. Each station is characterized by multiple failure modes, each one being connected to a resource that is part of the station. If a resource is shared among multiple stations, a weighting factor is used to adjust the probability of failure proportionally to the time of the operation units executed in each station. For example, a station formed of five resources will be characterized by five different failure modes, each one with its specific MTTF and MTTR. The cycle time of the station is also obtained by the execution times of the individual processes and the loading / unloading times.
128 M. Colledani et al. / Procedia CIRP 28 ( 2015 ) 125 – 130
buffers are denoted as Bi,j where i and j refer to the upstream and downstream stages, respectively. The capacity of each buffer is Ni,j. that is a real number. If no buffer is present between two stations, Ni,j can assume value ‘0’. The topology of the system is described by the set of its directed connections, or branches, from stage ito stage j. More formally:
(1)
This formally organized set of data, together with the target requirements set by the user, are provided in input to the System Configuration Module.
3.2. System Configurator Module
In this layer, starting from the user-driven initial line design, several optional line configurations are generated and evaluated against multiple KPIs, also considering the station reliability parameters. In other words, with respect to the initial design, in this phase of the design process the possibility that the stations fail due to random disturbances, thus generating the propagation of blocking and starvation events throughout the line, are considered. The multi-objective optimization problem solved in this layer can be formulated as follows:
(2)
where LB and UB are respectively lower and upper bounds that are set by the user as constraints and retrieved directly from the GUI. The KPIs that compose the objective function are as follows:
• Ehour: energy per time unit.
• Ctot: total cost of the configuration, including both
investment and operational costs, scaled to a time unit.
• Rtot: total number of robots.
• Ntot: total buffer space, directly related to the total floor-space of the system.
In addition, a constraint on the minimal production rate, TH, measured in Jobs per Hours (JPH), that has to be delivered by the system is imposed. The decision variables of the problem include the size of each buffer, Ni,j, the cycle time allocated to each station, CTiand the number of robots per station,Ri.
In order to efficiently solve this multi-objective optimization problem and to find the configurations that lay on the Pareto front, an optimization algorithm integrated with an analytic performance evaluation model are adopted. The control of the flow of information between the two software modules and the evolution of the optimization algorithm are performed by a workflow implemented within the commercial software platform ModeFrontier 4.5. ModeFrontier is a software tool developed by Esteco SpA that supports multi-objective optimization and integration between multi-domain software modules. The analytical model, that will be discussed in the next section, is integrated within the platform as an executable kernel. The ModeFrontier workflow controls the exchange of data between the optimization algorithm and the performance evaluation module. The specific optimization algorithm can be selected among a pre-defined suite of algorithms already implemented in ModeFrontier, including genetic algorithms, simulated annealing, gradient-based algorithms, and other soft computing techniques. Moreover, the optimization output can be visualized by using pre-defined graph templates available in the software platform. All in all, this integrated platform allows exploring thousands of alternative line configurations in less than 1 hour, thus drastically reducing the assembly line design times.
3.2.1. Analytical performance evaluation model
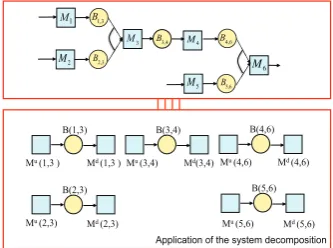
[image:5.595.334.501.529.653.2]The core method of the System Configuration Moduleis a performance evaluation tool based on decomposition-based approximate analytical methods. The idea of the decomposition approach is to decompose the NS-station system into a set of NS-1 two-machine one-buffer sub-systems, i.e. one for each buffer in the original system. Each two-machine linel(i,q)(Figure 3) is associated to a specific buffer B(i,q), with (i,q) in , of the original system and can be evaluated by the exact analytical solution provided in [7].
Fig. 3. Approximate analytical performance evaluation method based on the system decomposition.
=
{
(i,j)i ,j}
Min E
{
hour,Ctot,Rtot,Ntot}
st:THTHtarget
LB(CTi)CTiUB(CTi) i=1,..,NS
LB(Ni,j)Ni,jUB(Ni,j) (i,j)
Ntot= Ni,j
(i,j)
,Rtot= Rii=1
NS
M4 B3,4 B4,6 B1,3
1
M
M6 B2,3
M2
B5,6 M5
M3
B(1,3)
Mu (1,3 ) Md (1,3 )Mu (3,4) Md(3,4)Mu (4,6)
Mu (2,3) Md (2,3)
Md (4,6)
Mu (5,6) Md (5,6) B(2,3)
B(3,4) B(4,6)
B(5,6)
According to the decomposition logic, all the interruptions of the material flow entering (leaving) the buffer Bk are modelled by the pseudo-machine Mu(k) (Md(k)), including starvation (blocking) events. The parameters of these pseudo-machines are iteratively updated by considering the performance of the neighboring sub-systems by decomposition equations, until convergence is met. The decomposition equations for this class of systems are inspired by those derived in [8]. They are not reported in this paper due to space limitations. Upon convergence the main system performance measures can be estimated. This method was proved to be accurate in estimating the system KPIs, showing errors against simulation below 3%.
3.3.Post processing methods and tools
The multi-objective optimization approach described in the previous paragraphs allow to generate the Pareto front, i.e the set of solutions where none of the objective functions can be improved in value without degrading some of the other objectives. However, in order to select the most suitable solution among those that lie on the Pareto front additional tools are implemented in the platform, namely Robustness Analysis and Discrete Event Simulation tools. These tools apply only to the line configurations that are found on the Pareto front, thus drastically reducing the computational time required for the whole design optimization procedure.
The Robustness Analysis module has the goal of testing the robustness of the line configuration with respect to uncertainty in the input reliability parameters. Indeed, reliability parameters are extracted by a database that stores nominal failure frequencies and repair times. However, in real systems, the observed time to failure and time to repair for a specific resource is a function of implementation decisions, including the control mechanisms, the maintenance procedures and the skill of the operators, that are typically not considered in the early stage design [9]. These phenomena can cause the reliability parameters observed in practice to be drastically biased with respect to nominal values.
In the robustness analysis implemented in the proposed design platform, different uncertainty levels, whose degree is directly set by the user through the GUI, are considered and specific reliability parameters observations are sampled from these distributions. Then, the cumulative distribution function of the production rate achieved by the different configurations in the Pareto front is estimated by a Monte Carlo approach. The result is the estimate of the probability to achieve the desired throughput constraint under defined uncertainty levels, for the Pareto optimal solutions.
Since the adopted analytical method is approximate, there is a need to further validate the provided results by
comparison with Discrete Event Simulation (DES), only for the promising system configurations. In the platform a non-commercial DES module is included for post-processing and validating only the Pareto-optimal configurations. If the performance predicted by the analytical method is confirmed by simulation, then the optimal solution can be exported to the GUI to be visualized to the user. Otherwise, a different validated solution in the Pareto-front should be selected.
4. Application to a real automotive assembly line
The approach and the platform presented in this paper have been used to support the re-design of the Evoque L538 door assembly line in Jaguar Land Rover. In the current configuration, the only adopted assembly technology is RSW. The goal of the design process is to enable to integrate in the system both RSW and RLW technologies, thus reconfiguring the line into a hybrid assembly system.
The current system configuration, that represents the benchmark for this analysis, is briefly discussed in the following. The front doors for the 3-door and 5-door models are currently assembled in two identical and parallel lines, respectively assembling the left and right doors. The rear doors are assembled in a different line, where left and right doors are assembled sequentially in batches. The objects of this study are the front door lines, currently composed of 28 robots.
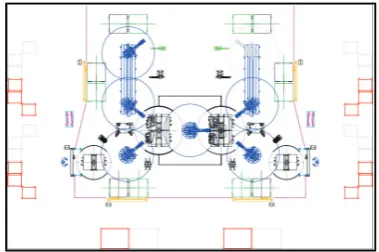
The aim of the analysis is to propose an optimized reconfiguration of these lines including the RLW technology and enabling to process both left and right doors in the same line, thus exploiting the flexibility of the laser welding process. To achieve this objective, the RLW Navigator consortium, have proposed progressively refined configurations of this new line. These initial designs have been optimized with the approach described in this paper. Due to space limitation, in this paper we discuss the application of the proposed approach only to the most advanced line configuration, reported in Figure 4.
130 M. Colledani et al. / Procedia CIRP 28 ( 2015 ) 125 – 130
[image:7.595.303.527.164.243.2]front populated with four potentially dominating configurations. Then, in the post-processing phase the discrete event simulation module has been executed to validate the results of the approximate analytical method. The results showed that the provided performance estimates were always within the 95% confidence interval of the simulation. Finally, robustness analysis has been applied to screen the four configurations in terms of probability of meeting the target throughput under uncertainty in the reliability parameters. The dominating system configuration provided a probability of 0.84 of exceeding the target throughput constraint with a high uncertainty in the input data (CV, Coefficient of Variations, equal to 0.25). A summary of the optimal line KPIs is reported in table 1, as compared to the current line configuration. As it can be noticed, the optimized line including RLW processes consistently decreases the total cost and the energy consumption, while meeting the target throughput. These results are obtained with a significantly lower number of robots (from 28 to 17). The developed platform efficiently supported the design process by reducing the optimization time to less than one hour.
Fig. 4. Re-designed hybrid door assembly line in JLR.
5.Conclusions
In this paper, a new methodology supported by a software platform for the early stage design of assembly lines is presented. The method drastically reduces the time to evaluate a large number of optional system configurations, enables knowledge re-use and increases the ability to provide right-first-time designs. It is worth to highlight that by using simulation as an evaluation tool, the same set of input data and the same level of detail of the analysis, that is typical of early stage design, would have been adopted [10]. Therefore, the approach proposed in this paper is not based on a simplification of the problem with respect to industrial and scientific practices. Although the developed platform has been specifically designed for hybrid automotive assembly lines, it can be in principle applied to system design problems in different industries. Future research will be
[image:7.595.82.272.335.461.2]devoted to the integration of the System Configuration Modulewith a lower level fixture design tool and a robot path planning and off-line programming tool for obtaining an holistic and integrated multi-disciplinary line design and optimization platform.
Table 1. Comparison among the current and the new line configuration (the time unit length is omitted for confidentiality reasons).
KPI Current configuration
Hybrid RLW configuration
%
Throughput [part/t.u.] 0.455 0.46 +1% Total cost [Euro/t.u.] 0.55 0.38 -30%
N° robots 28 17 -39%
Energy [kJ/t.u.] 194.5 83.2 -57%
Acknowledgements
This work is funded under the FP7-2011-NMP-ICT-FoF program: “RLW Navigator - Remote Laser Welding System Navigator for Eco & Resilient Automotive Factories”. Grant agreement 285051.
References
[1] Genikomsakis, K., Tourassis V., 2008. A simulation based assessment of alternative assembly line configurations. IEEE International Conference on Systems, Man and Cybernetic. [2] Hu, S.J., Ko, J., Weyand, L., ElMaraghy, H. A., Lien, T. K., Koren,
Y., Shpitalni, M., 2011. Assembly system design and operations for product variety, CIRP Annals – Manufacturing Technology, 60/2: 715-733.
[3] Michalos, G., Makris, S., Papakostas, N., Mourtzis, D., Chryssolouris, G., 2010. Automotive assembly technologies review: challenges and outlook for a flexible and adaptive approach. CIRP Journal of Manufacturing Science and Technology. 2(2), 81-91.
[4] Michalos, G., Makris, S., Mourtzis, D., 2012. An intelligent search algorithm-based method to derive assembly line design alternatives. International Journal of Computer Integrated Manufacturing. 25, No.3, 211-229.
[5] Boysen, N., Fliedner, M., Scholl, A., 2006. A classification of assembly line balancing problems. European Journal of Operational Research. 183(2), 674-693.
[6]Rekiek, B., Doigui, A., Delchambre, A., Bratcu, A., 2002. State of art of optimization methods for assembly line design. Annual Reviews in Control. 26, 163-174.
[7] Gershwin, S-B., Tan, B., 2009. Analysis of a General Markovian Two-stage Continuous Flow Production System with a Finite
Buffer, International Journal of Production Economics, 120, 2,
327-339.
[8]Colledani M., Tolio T., 2005. A Decomposition Method to Support
the Configuration/Reconfiguration of Production Systems, Annals of the CIRP. 54/1: 441-444.
[9] Colledani M., Teferi A. 2013. Impact of Machine Reliability Data Uncertainty on the Design and Operation of Manufacturing Systems. Procedia CIRP 7, 557-562.
[10] Spieckermann, S., Gutenschwager, K., Heinzel, H., Voß, S., 2000.
Simulation- based Optimization in the Automotive Industry -A