Light scattering models for real-time bacteria
characterisation in water based environments.
CHLIVEROS, Georgios.
Available from Sheffield Hallam University Research Archive (SHURA) at:
http://shura.shu.ac.uk/19461/
This document is the author deposited version. You are advised to consult the
publisher's version if you wish to cite from it.
Published version
CHLIVEROS, Georgios. (2005). Light scattering models for real-time bacteria
characterisation in water based environments. Doctoral, Sheffield Hallam University
(United Kingdom)..
Copyright and re-use policy
ProQuest Number: 10694342
All rights reserved INFORMATION TO ALL USERS
The quality of this reproduction is dependent upon the quality of the copy submitted. In the unlikely event that the author did not send a com plete manuscript and there are missing pages, these will be noted. Also, if material had to be removed,
a note will indicate the deletion.
uest
ProQuest 10694342
Published by ProQuest LLC(2017). Copyright of the Dissertation is held by the Author.
All rights reserved.
This work is protected against unauthorized copying under Title 17, United States C ode Microform Edition © ProQuest LLC.
ProQuest LLC.
789 East Eisenhower Parkway P.O. Box 1346
Light Scattering Models for Real-Time Bacteria Characterisation in
Water based Environments
Georgios Chliveros
A thesis submitted in partial fulfilment of the requirements of Sheffield Hallam University
for the degree of Doctor of Philosophy
Sheffield Hallam University Materials & Engineering Research Institute
The undersigned hereby certify that they have read and recommend to the Faculty of Arts, Computing, Engineering and Sciences for acceptance a thesis entitled “Light Scattering Models for Real- Time Bacteria Characterisation in W ater based Environments” by Georgios Chliveros in partial fulfillment of the requirements for the degree of Doctor of Philosophy.
Dated: Submitted: 14 January 2005
Research Supervisors: ______________________________ Professor M. A. Rodrigues
Dr D. Cooper
Contents
List of Tables viii
List of Figures ix
Abstract xvi
Acknowledgements xvii
List of Publications xviii
1 Introduction 1
2 A review of light scattering:
functions, patterns and bacterial cells 7
2.1 Introduction... 8
2.2 Bacterial cells: morphology and relation to optical properties... 9
2.3 Candidates for drinking water abstraction: Bacterial Ecosystem... 17
• 2.4 Application of Light Scattering theory to biological c e l l s ... 22
2.5 Mie scattering and the Rayleigh-Debye approxim ation ... 29
2.6 On equipment based on light scattering... 33
2.7 Discussion... 35
3 On inhomogeneous particles of spherical symmetry 37 3.1 Introduction... 38
3.2 The exact solution of the n-layer p ro b le m ... 42
3.3 Approximate solution for near-index p a rtic le s... 50
3.4 Evaluation of the approximation m odel... 67
3.5 Validation and applicability limits of the approximation m o d e l... 72
4 The generalised ellipsoidal Rayleigh-Debye approxim ation 79
4.1 Introduction... 80
4.2 Approximate solutions on near-index ellipsoidal geometries... 81
4.3 Geometrical properties and the n-layer approximation... 90
4.4 Evaluation of the ellipsoidal approximation m odel ... 98
4.5 Theoretical considerations and problem s...107
4.6 Conclusions... 108
5 On the violation of the independent scattering condition 110 5.1 Introduction...I l l 5.2 A stochastic algorithm for multi-particle simulation . ...I l l 5.3 A procedure for calculating the intensity p ro file ...119
5.4 C o n c lu sio n ... 126
6 Conclusions and further development 128 6.1 Conclusions... 129
6.2 Further d ev elo p m en t...133
References 136 A MATLAB Implementation of the n-layer Mie scattering problem 146 A .l Comments on functions...147
A.2 Generating F unctions... 148
A.2.1 The functions RBI and R B 2 ...148
A:2.2 The function ALegendr . . ...149
A.3 Main Routines... 149
A.3.1 The function nLayerAmp . ... 149
A.3.2 The function nlayerScaCoeff... 151
A.4 End Result F u nctions... 154
A.4.1 The Function nlayerlntensity... 154
A.4.2 The Function nlayerEfficiencies... 155
A.4.3 The Function DegreeOfPolarisation...155
A.5 General C o m m en ts...156
A.6 Calculation of Scattered Intensity...157
B Matlab implementation of a 2-Iayer model 161
B.l Impementation of Wyatt’s Rayleigh-Debye m o d e l...161
C Matlab Implementation of n-layer generalised Rayleigh-Debye models 163 C.l Implementation of the n-layer spherical m odel. ...163
C.1.1 Finding the coefficients for the Scattering Functions ... 163
C .l.2 The scattering amplitude fu n c tio n ... 164
C .l.3 Calculation of the Intensity...165
C. 1.4 Calculating the Relative Difference: generalised mRDG versus Mie exact so lu tio n ... 165
C.2 Implementation of the n-layer ellipsoidal m o d e l...167
C.2.1 The Assymetric Size D istrib u tio n ... 167
C.2.2 Input estimation fu n c tio n s...169
C.2.3 Calculation of Scattering Amplitude and Intensity... 170
D Matlab Implementation of Monte Carlo 172 D .l Description of the MC algorithm and initial param eters...172
D.2 Matlab code for generation of positions in 3D sp a c e ... 175
List of Tables
2.1 EU directive 79/869/EEC: Only the bacteriological content for exami nation from possible sources of potable samples is shown. The sample container’s material is required to be sterilized glass. Salmonella num bers indicate the necessity for absence per 1000ml. The remainder as indicated is taken from recent additions as per [1, 2], the Central Disease Control, USA security code... . 2.2 Literature Summary for values of optical properties derived from light
sc a tte rin g ... 4.1 An example for calculating the values for orientation angle (3 depending
List of Figures
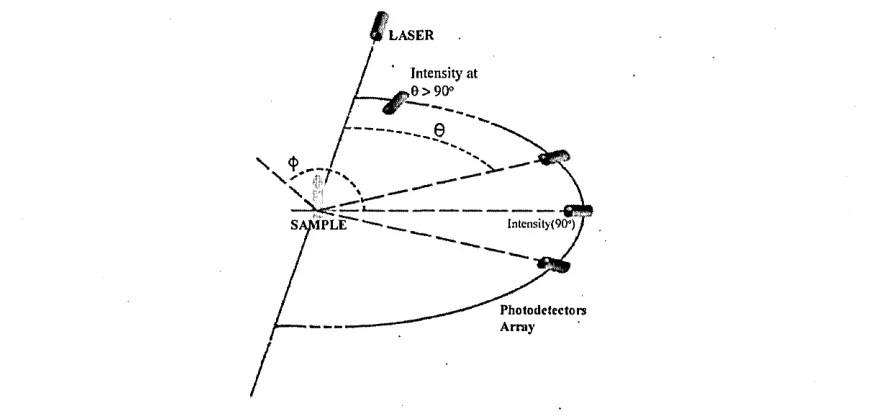
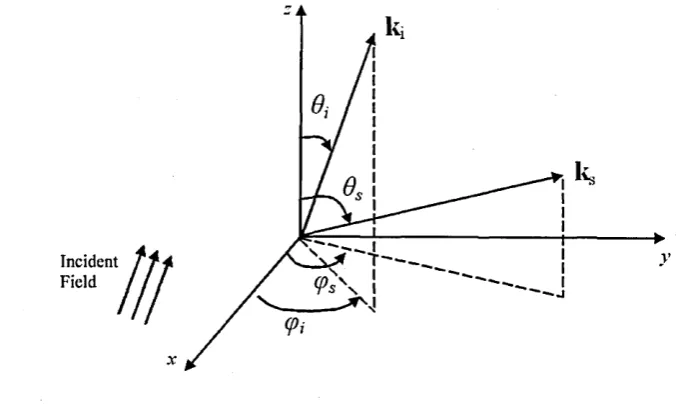
2.1 A commonly used configuration for multi angle light scattering measure ments. The detectors and laser source are placed on the horizontal plane so as to cover the range for 9 E (0,7r). Note that the laser source is coplanar with the array of detectors... 8 2.2 A classification system based on the Gram reaction of the cell; that is to
say the behaviour, structure of the cell wall ... 10 2.3 A Gram (+) cell wall: Chemical composition. Notice that the capsule
layer only appears if condensed polymers form; this is an indication of
virulence... 11 2.4 Most common bacterial cells in relation to their external morphology.
Corresponding microscopic images are also provided: Reprinted with permission from Dr D. Kunkel (Dennis Kunkel Microscopy © ) ... 13 2.5 Schematic of the true structure of the prokaryotic cell. Note that features
are not shown to scale and have been emphasised to illustrate the multi layered structure... 14 2.6 The electron microscopy image of cross section of the Bacillus subtilis
endospore (right). A typical model that appears in most textbooks of mi crobiology to explain its structure can be seen on the left. Note phase light and phase dark regions of the microscopy image and the clear relationship with the diagrammatic illustration as shown here... 16 2.7 A freshwater lake eco-system and the distribution of bacteria on the lay
2.8 Light scattering theoretical models and applicability. Note that Mie scat tering would potentially solve most problems involving small particles provided that a rigorous solution could be obtained. On the diagram, (GO): Geometrical Optics and (AD): Anomalous Diffraction. We use GO and AD as examples of approximations that would be applied for parti cles having a largest dimension d > 40/im; for spheres this would be the radius for other external morphologies this would mean the major axis. By x we denote the size parameter defined by x = 2k0d, where d is the scatterer’s largest linear dimension... 22 2.9 Diagrammatic depiction of the cross section of a 2-layered spherical model.
The outer layer is placed at distance r2 from the centre and has a thickness Ar = r2 — ri within which a relative index of refraction m 2 is assumed; the inner core has a radius r\ and relative refractive index m \... . 28 3.1 An n-layered concentric sphere: i = 1, 2, .. ., n , . . . , N ... 43 3.2, A 2-layer sphere intensity pattern, following the results for B.sphaericus
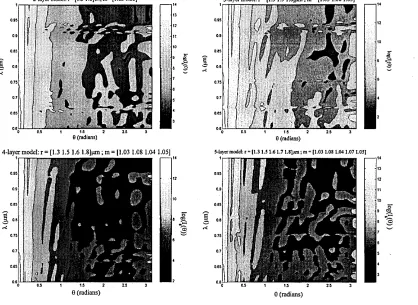
spores at A = 0.514/im [3]. Left: Light Intensity Pattern; Right: Polar plot at# 6 (0,180°)... 47 3.3 Light Intensity Patterns of 2 to 5 layer particles at multi-angle and variable
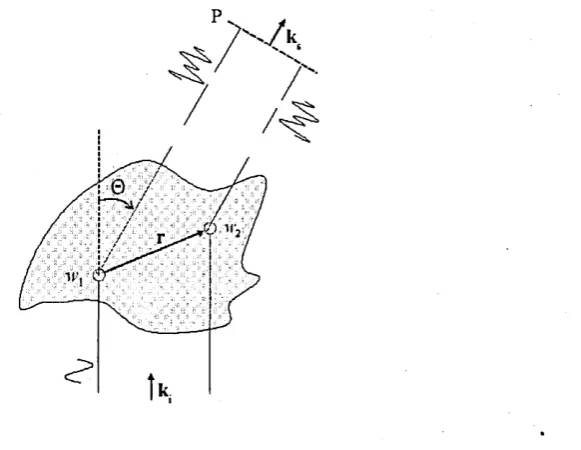
w av ele n g th ... 48 3.4 Scattering Geometry for the modified Rayleigh-Debye approximation . . 50 3.5 Depiction of the Scattering Plane in two dimensions: diffraction occurs at
direction k s, with respect to the incident field of direction kj. The angle between scattering and incidence is denoted by 0 . Far-field assumptions satisfied if observation plane P is placed at distance much greater than the dimension of scatterer. ... 51 3.6 A scattering particle of arbitrary shape with volume VQ, finite size. The
infinitesimal volume dVj is also in d ic a te d ... 52 3.7 Relationship between k*, k s and k ^ ... 56 3.8 Following Fig.3.5 for infinitesimal volumes dV, indicating projections of
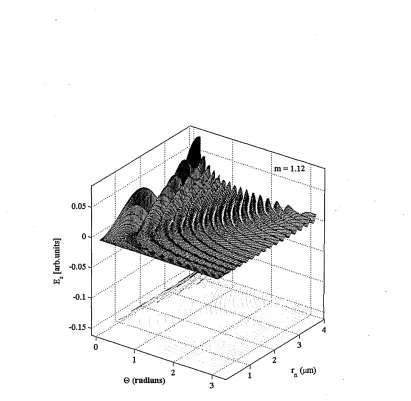
3.9 Behaviour of the solution for the n-th layer, using Bessel functions of order 3/2. The scattering amplitude of the function (Es) for the n-th layer, is indicated on the z-axis at all detection points (0 ) and increments of radius rn E [0,4]//m. The relative refractive index value for the n-th
layer is m n = 1.12. The contour of the 3D plot is drawn on the xy plane ( 0 ,r n)... 63 3.10 A diagrammatic expression of the physical meaning of generalised n-
layer Rayleigh-Debye spherical approximation. Note the similarities of this depiction with other disciplines, for example telecommunications en gineering, from which the notation has been adopted... 65 3.11 Illustrating patterns of angular dependence for 2-layer equivalent mod
els of spherical bacteria: From top to bottom: the generalised Rayleigh- Debye approximation, the exact Mie theory and the Rayleigh-Debye ap proximation. Note that the number of minima of the generalised mRDG appears to resemble the Mie solution more closely than the Rayleigh- Debye model scattering pattern... 68 3.12 A comparison between 2-layer equivalent models on backscattering (0 E
(n /2 ,7r)): the Rayleigh-Debye approximation (dotted line), the exact Mie theory (solid line) and the generalised mRDG approximation (dashed line). Note that the last minimum in the curve of the generalised mRDG is closer to Mie model than the Rayleigh-Debye prediction (illustrated in the figure via projection of dotted line on the axis of 0 ) ... 69 3.13 A two layer model from the exact solution indicated by the solid line and
from the mRDG indicated by the dotted line. The core is assumed to be of radius ly m and corresponding relative refractive index 1.1 whilst the outer layer has radius 1.1 ym and corresponding relative refractive index 1.3 70 3.14 Resulting scattering patterns of angular dependence for the generalised
Rayleigh-Debye approximation. The solid line depicts the result for 2 layers, the dotted line represents results for 4 layers and the dashed line corresponds to 5 layers... 71 3.15 n = 2. Relative difference mapping between generalised RDG and Mie
3.16 Relative difference mapping between generalised RDG and Mie scatter ing for a 6 layer spherical model. Both the result for indexed and its mapping to sorted values of (r, m) are indicated... 75 3.17 From Left to Right relative difference maps between generalised Rayleigh-
Debye and Mie scattering for: 3-layers hence n = 3 and 5-layers hence
n = 5. At the top we have the indexed relative difference mapping and at the bottom the corresponding averaged sorted indexed values... 76 4.1 Illustration of integrating by taking cross sections of the solid found by
planes perpendicular to the line of the bisectrix. The cross section shown here in detail has an area A and infinitesimal thickness dp, where p is the projection of the positioning vector r on the bisectrix. Note a change in the assumption of incidence; the incident direction denoted by ki is parallel to the z axis of a global coordinate system, and the scattering angle is the polar angle 6, and as a result, linking this to Chapter 3, 9 = 0 . 84 4.2 Cross section of the n-layered ellipsoid. Note that the n — 1 layer is at
distance gn- \ from the centre of the ellipsoid; whilst the n-th layer area is placed between pn_i and gn with relative refractive index m n... 87 4.3 A diagrammatic illustration of the generalised n-layer Rayleigh-Debye
ellipsoidal approximation as a graph network. Once again we use the for malism of notation from other engineering principles. The node denoted by 0 means the i — 1 value with respect to the array of values and for the largest linear dimension only... 89 4.4 Spherical triangle showing the position of the major axis of the ellipsoid
(v) with respect to the directions of incidence (i) and scattering (s). The bisectrix has the direction (p)... . . . 91 4.5 On the example for calculating values for orientation angle. A non-linear
relationship between the cosines of /?, {0/2) is revealed in the plot be tween the cosines (bottom). The plot situated on the top of this fig ure, clearly illustrates the lag between the cosines and for values of 0 E
(0,27r). We have used the values of the example of Table 4.1, that is
4.6 Scattered intensity from an ellipsoid with different source radiation at in cidences of a = [0,7r/4, 77t/4] resulting in the plots indicated from top to bottom respectively, with the equivalent polar plots on the right. For the cell it is assumed a 3-layered structure with relative refractive index array of values m* = [1.04 1.1 1.01] and array of values for the distances from the centre of the cell Qi = [0.88 1.045 1.1]... 95 4.7 The 3D scattering patterns from three distinct cases of 3-layer prolate
spheroids: The prolate spheroid type I, where the axial ratio is such that
t = 1.4; the prolate spheroid type II, where t = 2.8; and a prolate spheroid type III, where t = 14. Note that the angle of incidence is constant at
a = 90°. The volume of all spheroids is 1.1/mi3 whilst the values for relative refractive index equal those of the example in Figure 4.6. . . . 97 4.8 An ensemble of N 0 particles within a volume AV^ that is within the ‘cone
of reception’ of detector. The detector in this depiction is assumed within the solid angle formed by its cone of reception as cast in the total volume
Vt... 99 4.9 Size distributions with + /^right = 0.30. The solid line curve depicts
the symmetrical size distribution, /qeft = Alight- The dashed line curve de picts an asymmetric size distribution with negative skewness, K,\eit = 0.2, bright — 0.1. The dotted line curve depicts an asymmetric size distribution with positive skewness, Kieft = 0.1, /^right = 0.2... 103 4.10 The angular dependence of the scattering ratio for an n-layer ellipsoid.
Top: n=3, a three layer ellipsoid model with different axial ratios (dashed line: t < 1, solid line: t — 1, dotted line: t > 1). Middle: n=4, a four layer ellipsoid model with different axial ratios. Bottom: n=6, a six layer ellipsoid model with different axial ratios...105 4.11 Isolating prominent peaks from the simulation results of Figure 4.10. The
5.1 Absolute global coordinate system and Scattering local coordinate sys tem. For i scattering events to take place with m being the last one. Note that incident radiation or photons with direction ki, coincide with direc tion of the Z axis of the global coordinates system whilst the last scatter ing event follows the direction-k ^ at polar angles 0yvo) <A/v0 of the local coordinate system... 113 5.2 Calculating the separation djj+i between a successive pair of ellipsoids
placed at points Oj (Xj, Yj, Zj) and Oj+i ( X j +i, Tj+i, Zj +i), enclosed within spherical boundaries of corresponding radii Rj and R j+i. The radii cor respond to the largest linear dimension of the ellipsoids. ...115 5.3 Assuming an ensemble of 40 scattering particles with maximum separa
tion 0.25 mm. Note that we have assumed prolate spheroids where c = s
and a = b = ts, with the axial ratio t being a real number uniformly distributed in the range (0.1,12). The sizes s for the spheroids in the il lustrations at the bottom, have been overemphasized by a factor 10 so as to be visible. We illustrate for different orientation randomly selected, for the 40 scattering particles... 117 5.4 An ensemble of 50 scattering particles with maximum separation 0.25
mm. The point cloud is indicated at the top whilst the Pair Occurrence distribution function of d /L is provided at the bottom...118 5.5 Pair Occurrence distribution function of d/L for an ensemble of 100 scat
tering particles. Note that in contrast to the function with 50 particles (Figure 5.4) it tends towards resembling an exponentially decreasing func tion... 119 5.6 Results for the normalised scattered intensity profile as a continuous func
tion approximated from discrete scattering exit events. We have assumed 109 injected photons and spheroidal geometry for the bacterial cells. We illustrate results for N a = 5 x 10⁸ at the top and N 0 = 50 x 108 at the bottom. The ensemble has particles of the same number (n) of layers in ternal structure; namely n = 2,3,4,5 and n = 10 indicated by successive lines from solid to increased dotted lines...125 A .l Structure of interaction between the Matlab functions: Generating Func
A.3 A 2-layer Mie scattering model for unpolarised incidence but with a denser . cell wall...1 ... ,159 A.4 For a 2-layer Mie scattering model: (Left) The scattered intensity’s degree
of polarisation; (Right) he scattered intensity’s polarisation ratio for 2- layer Mie scattering model... 160 D .l Positions and ellipsoidal particles generated by the Metropolis MC algo
Abstract
Bacteria can be said to be small particles in terms of their volume and can be modelled as near-index particles when the average refractive index of their body is close to that of the medium in which they are suspended. This is the case with water based environments whereas the bacterial scatterer is said to be a ‘soft particle’ and within the Rayleigh-Debye experimental bounds of applicability. However, discrepancies in the past have illustrated insufficiency of geometric assumptions, such as spherical symmetry and simplistic inter nal structures, as well as the assumption of ‘transparency’ of the particle.
The aim of this work is to generalize the Rayleigh-Debye approximation in order to apply them to a wider class of not necessarily soft scatterers, hence departing from
\m — 1| <C 1 to \m — 1| < 1. We start by establishing a connection between the as sumption on the functional expression of the internal field of small particles and that of the function of refractive index, to a generalisation for arbitrary number o f layers within a particle of spherical symmetry. Based on the modification of the Rayleigh-Debye ap proximation (mRDG) with Bessel functions we proceed to formulate an extended version of the arbitrary layers particle for ellipsoidal forms. An application of this n-layer gener alised mRDG to the bacterial domain optical properties via simulation, re-establishes the limits of the Rayleigh-Debye approximation as a result of the internal field modification.
Acknowledgements
I would like to thank professor M.A. Rodrigues, my director of studies, for providing me with the opportunity to engage into research and his constant support during my studies. I am also thankful to Dr D. Cooper, my supervisor, and Dr J. Mills, research advisor, for their guidance through the early months of chaos and confusion. To Ms L. Harrison, A. Cooper and Jo Laughton, of ‘ACES’ administration, goes my outmost respect for hav ing the patience to continuously offer their help and advice. The same applies for Mr Ian Morrey, ‘ACES’ research tutor, for his continuous efforts to establish and promote a research culture.
This research would have not been possible if it was not for Dr Lyuba Alboul’s crucial comments, Dr Jacques Penders’ advice and the numerous discussions I had with Dr Alan Robinson. I am grateful to my past tutors, professor H. Rowlands (University of Wales) and Dr P. White (University of the West of England) for they shaped my academic ability and encouraged me to undertake this research programme.
I should acknowledge Dr Dennis Kunkel (Kunkel Microscopy), for providing high- definition microscopy images and Dr Z. Ulanowski (University of Hertfordshire) for shar ing his views on light scattering theory and related issues. I should also acknowledge partial financial support from Trident Management Ltd, and financial support for the year 2004 by SHU Enterprise Centre.
Most importantly, I am grateful to my parents for their patience and belief in me, even though they do not necessarily understand why or what I am actually doing. Finally, I wish to thank Panayiotis ‘Lord-Xipe’, Periklis ‘Red-Elf’, Nikos ‘JP’ and Christiana (for constantly reminding me who I am...); Zissis, Panos and Amir (for unconditionally offering their friendship); Christos, Socrates (RIP, 1998) and Petros (for remembering the past kept me focussed).
List of Publications
G. Chliveros (2005). ‘Characterisation of Endospores through Light Scattering Patterns’,
Poster Presentation’. Marie Curie Summer School in Knowledge Based Materials, 2005, Aachen(Germany).
G. Chliveros and M.A. Rodrigues (2004b). ‘Method and Apparatus fo r Particle Analysis'.
Great Britain Patent Application 0406055.4; 2004-03-17.
G. Chliveros, M.A. Rodrigues and D. Cooper (2004a). ‘Bacteria Cells as near-index Par ticles and the Calculation of Light Scattering’, Invited talk: Institute of Physics Workshop on Optical Techniques in Biomedical Instrumentation, Feb.2004, London(UK).
G. Chliveros, M.A. Rodrigues and D. Cooper (2003b). ‘A new n-Layer mRDG Ellip soidal Model of Light Scattering for Rapid Monitoring Tests of Coliforms in Potable Water Samples’, Institute o f Physics Series in Sensors: Proceedings of Sensors and their Applications XII, Limerick (Ireland), Sept.2003, pp 317-322.
G. Chliveros, M.A. Rodrigues and D. Cooper (2003a). ‘Modelling Populations of Prokary otic Cells: the n-Layered mRDG Approximation’, SCS-Europe Proceedings o f the 17th European Simulation Multi Conference [BioMed], Nottingham (UK), June2003, pp 338- 344.
Chapter 1
Introduction
“A likely impossibility is always preferable to an unconvincing possibility”
Aristotle, Rhetoric
Light scattering is the secondary radiation scattered by the induced oscillatory motion of protons/electrons within an obstacle when illuminated by a light source. This sec ondary radiation relates to the heterogeneity of the system (i.e. the collection of particles constituting the obstacle). As a result the interaction of a beam of light with any medium will result in the rise of scattering also known as density fluctuations. Other types of fluctuations also appear, for example concentration and orientation fluctuations. However when we are interested in the light scattering by particles, a fluctuation is not a particle in that sense. After all, scattering by fluctuations is usually much less than scattering by particles [4, p 7] [5]. However, there have been many attempts to identify the applicability of low angle scattering and the theory of fluctuations but most are limited to studies of biological motion [6] or chemotaxis, that is movement of cells from one band of the liquid media to another, and relating to the swimming speed of motile organisms [7], as well as rotational-translational effects on the scattering spectra at forward scattering angles [8].
Even though we are interested in the microscopic world (small particles), one would in theory solve the heterogeneous particle problem defined within Maxwell equations. In that sense, [9] was the first to provide a solution to the scattering and absorption by homogeneous spheres. Since then several papers have appeared that refine and extend the theory to non-symmetrical particles by assumptions on spherical equivalents, sphere with inclusions and others ([10, for example]).
samples [11]. For example in [12, 13], angular light scattering data obtained from a go- niometric module are interpreted by means of a 2-layer Mie model [4, pp 181-184],
However, most prokaryotic cells are of a complex makeup. In general 'the cell presents a structure that consists mainly of the cell wall, the plasma or cytoplasmic membrane, the cytoplasm and the nucleoid. Therefore, in order to generate a more accurate representa tion of the cell, one would model it as having various compartments within its volume and within these compartments the refractive index is different from that of the surround ing objects. In cells where the overall morphology can be approximated as that of a sphere (e.g. cocci), each of the structures internal or external to the plasma membrane can be modelled as a different layer in an n-layered spherically symmetric inhomoge- neous particle. Not many experimental studies appear in the literature, as we report in subsequent chapters. In this work we are interested in modelling the bacterial cell as a non-homogeneous body of assumed geometrical shape.
Finally, the models we have developed do not apply only to bacteria. Other examples, within the boundaries of applicability of our models, include characterisation of anthro pogenic aerosols from lidar sounding data, which contain multiple layers of soil erosion, salt, soot, organic and other compounds or even that of atmospheric sensing where the raindrop particles can be characterised by multiple layers of water of different thickness and composition (e.g. multiple ice/ liquid/ ice interfaces and so on).
Aims and organisation of the thesis
In the early days of our research we were interested in scattering from bacteria in water at low angles, that is to say when the scattering angle 9 is within 10 degrees with respect to the radiation incidence. Some prior experimental work on these instrumentation setups indicated that there is a strong correlation with increased scattering as concentration in creases by the use of, say, temperature applied on the sample over some period of time. However, concentrations alone would not lead to at least partial identification. That is to say, we are interested in models that may lead to identification protocols. As a result, we follow the line of research that is indicated in the literature as one that may lead to this aim: hence, scattering patterns of angular dependence. Even so, not many studies for bacteria appear where the bacterium is examined as a strongly inhomogeneous particle. Furthermore, limiting cases in terms of the cell’s geometry have been theoretically exam ined, mainly due to the lack of inhomogeneous models within the near-index regime.
all directions through mathematical simulation with both deterministic and stochastic el ements. By the term ‘physical meaning’ we imply the identification of physical structure rather than the direct identification of a specific bacterium. As such, commonly used mod els explore the idea by examining the biological cell as having a limited number of layers. In our work we propose that the bacterial cell must be investigated as an n-layer structure by extending a modification on the Rayleigh-Debye or Bom approximation applicable in the near-index regime, as is the case with bacteria in water based environments.
Applying our models as proposed within this thesis, that is a ‘predetermined geometri cal shape’ with an arbitrary number of layers, one would first explore the effect of altering the parameters of size overall (s) and per layer (s*), investigating values for the relative re fractive index (m*, i = 1, 2, . . . , n) and then infer, using some test statistic, the best model which may lead to partial identification. The predetermined geometric shape which we refer to is in fact either spherical or ellipsoidal/spheroidal. For a sphere of radius r the spherical shape is defined at a centre point (xD, yQ, zQ) by the expression
(x - x a)2 (y - yQ)2 (z - z0)2 =
r p l fp 2
whilst an ellipsoidal shape of semi-axes (a, 6, c) is defined by the expression
(x ~ x 0)2 (y - y0)2 (z - z0)2
a2 b2 c2
A spheroidal shape is an ellipsoid, that has an axis of symmetry. For example, sym metry about the z-axis, whereby a = b ^ c, and for other alternative combinations (b = c
or a = c). To the best of our knowledge we are the first to theoretically examine the cell as an n-layer structure and to propose such a mathematical extension within the near-index boundaries (m < 1.35), at the far-field observation points at distance R (where R s).
our approximating mathematical model. In these chapters, there are several notes and ob servations reported on the physical meaning of our findings on functional behaviour and we relate them to realisations of experimental value.
In the second part of the thesis (Chapters 3 and 4), the aim was to extend the spher ical model to any ellipsoidal geometric form using the basis we have built in proofs and discussions . We provide a new method for solving the multi-layered ellipsoidal problem and we show the effect of non-sphericity to the scattering pattern. Hence we illustrate that the relation of the number of peaks of the scattering pattern to size may lead to erro neous results. Furthermore we show that there is a dependence of backscattering on the three-dimensional scattering, hence there is a need for experiments that adapt this feature in the instrumentation setups. Finally, we devise experiments for populations where the condition of independent scattering is not violated. We devise a new frequency function for bacterial size distributions and apply it to a scattering ratio that has been proven to emphasize the backscattering effect. At the end of this part of the thesis we illustrate how our method can be applied to the case of super-spheroids, defined by
\ X - X 0 \* + \ y - j ^ + \ z - z X = l n > 2
an bn c
from which we were unable to infer an analytic expression.
In the third part of the thesis (Chapter 5) the aim was to investigate how our models would be used in cases where the independent scattering condition is violated. In that respect we have built an algorithm that generates such positions in three dimensional space, but avoiding the case of binding of cells, which can only be seen in water treatment processes in which we are not interested. That is to say that throughout the thesis, the major assumption is that the mathematical models developed will be used on samples from drinking water networks and in real time. Hence models that require extensive computational power are not considered.
Finally, in Chapter 6, the main results and conclusions of the thesis are outlined. Our main contributions are summarised as:
• Implementation of the computer algorithm for the n-layer exact solution
• A generalised solution to the n-layer near index problem based on modification to the Rayleigh-Debye approximation.
• A theoretical verification that limits of our generalised approximation with respect to the average relative refractive index cover a significant part of the bacteria do main.
• A theoretical study on the relative difference between the exact solution and our generalised approximation.
• A new method for determining the scattering amplitude or the form factor from particles of no apparent geometrical symmetry and for multi-layered internal struc tures.
• A new method for spheroids of multi-layered internal structure, in conjunction with a physical justification for polar asymmetry in the scattering pattern.
• A new procedure for treating populations of cells that exhibit skewed frequencies in their linear dimension, as long as the condition of independent scattering is satisfied. • Implementation of an algorithm for issuing positions and visualisation of media
densely populated with scattering ensembles where the independent scattering cri terion is violated.
• Modification of the Rayleigh-Debye phase function for densely packed random me dia to apply to n-layered ensembles.
• The theoretical finding that asymmetry in the scattering intensity’s profile due to orientation and curvature effects is evident, even for densely packed media.
Chapter 2
A review of light scattering:
functions, patterns and bacterial cells
The formulation of the problem of light scattering or diffraction can be said to be simple. Let vector E* denote the incident field on a scatterer(s) of volume V\ the re-constructed field inside the scatterer is denoted by E (r) where vector r denotes the distances within the boundaries of the cell, and the scattered field by vector E s. From Maxwell’s equations one should find the total field equal to E (r) inside V and to E* + E s outside V such that it satisfies the boundary conditions over V. Despite the simplicity of the scheme the solution depends on the geometric properties of the scatterer and its structure. Biological cells are in general of no specific structure. Furthermore the problem that is of usual experimental interest is defined as:
Definition 2.1. From a collection of sufficiently diluted cells, of assumed geometrical and optical properties, suspended in a liquid medium, which is illuminated by a laser beam of specified polarisation and wavelength, determine the sample’s physical characteristics in real-time.
In particular, bacteria in water based environments are considered to be ‘soft-scatterers’, and of no specific morphology in terms of internal structure relating to optical proper ties. For example, if one assumes a spherical particle, and one models the interior as an anisotropic tensor of relative refractive index, a general solution in a closed form cannot be obtained [14, 15, 4]. In this section we provide information from the literature that results in reasonable assumptions within our problem domain so that the problem can be analytically solved. Finally we attempt to link work from the literature towards charac terisation and possible identification of bacterial cells via the known instrumentation and
LASER
Intensity at
J*»0>9O°
Photodefcctors Array
Figure 2.1: A commonly used configuration for multi angle light scattering measure ments. The detectors and laser source are placed on the horizontal plane so as to cover the range for 6 G (0,7r). Note that the laser source is coplanar with the array of detectors.
2.1 Introduction
[image:29.614.96.531.51.260.2]For real-time identification, following Greenberg et.al. in [11, pp 9:22 - 9:24], the most rapid of tests is the fluorometric, by which method the release of carbon dioxide (C 02) is measured and detection of waterborne faecal coliforms is possible. The test is said to take place in about 1 hour. However it is very specific, that is to say, different protocols must be used for different bacteria genera. As a result the aim of any test in terms of time effectiveness for water samples must be within this time restriction. This applies to all research prototype methods. Concerning light scattering, it has been noted by Ulanowski [18] that light scattering equipment can produce patterns of angular de pendence within minutes, and following Wyatt [19] we can determine within another 20 minutes the external morphology, that is to say the geometric shape, of the cell. To char acterise the cell, we need to infer the optical properties and correlate them with some microbiological measure. To infer the optical properties from the scattering patterns we then need to use some theoretical background (Section 2.4). A system is said to be real time when the computation taking place is rapid, that is, fast enough to affect the input as it happens. As a result, the process of characterising bacteria cannot be said to be in real-time. However, the characterisation would be defined as such when a proposed method and computational algorithm do not significantly add in time to the characterisa tion process. This is what we refer to as real-time: the time taken for the computations within the algorithm.
Finally, by liquid medium we refer to the environment of interest, that is to say, water based environments from which abstraction of drinking water is possible. Thus airborne bacterial cells are excluded.
2.2 Bacterial cells: morphology and relation to optical properties
Bacteria are single cell (unicellular) organisms considered to be biologically extremely small in terms of size and multiply by cell division. Some are important agents in the cycles of nitrogen, carbon and other matter whilst others are pathogenic, causing dis ease to humans and animals. They can be found virtually in all environments and are included in the division of Prokaryotic Cells and have many important characteristics relating to their shape and internal structure. These features, extracted from the charac teristics found, are used in order to name them following the Bacteriological Code [20] established by the International Committee o f Systematic Bacteriology. The description
Bacteria
Archaea
Firmi cutes
DIVISION
---(PHYLA)
ThinCdlW all Thick Cell W dl W a ll-less Unusual Cell Walls
Gram(-) Gram(+)
CLASS
[image:31.614.98.500.42.283.2]---Ptoto^ttetic Cyanobacteria Rods, Coed Actinomycetes, Mycoplasmas
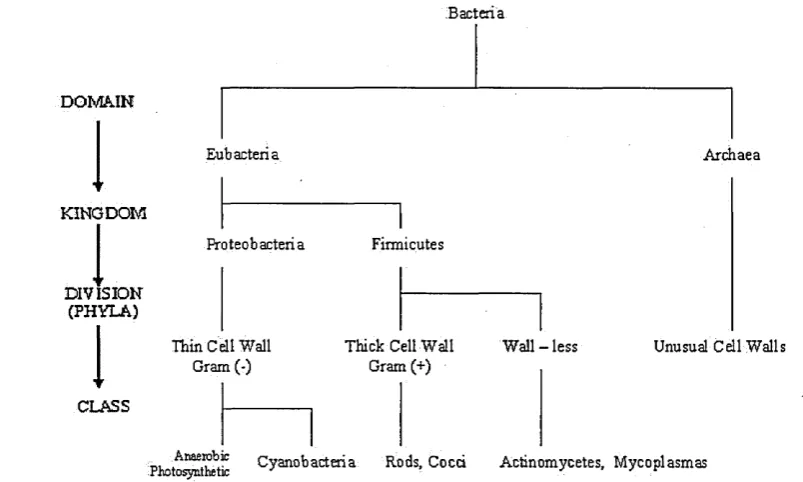
Figure 2.2: A classification system based on the Gram reaction of the cell; that is to say the behaviour, structure of the cell wall
that is attached in this naming code includes, amongst others, morphological characters, occurrence of cells as a result of multiplication by binary-fusion, ability of encapsulat ing and producing spores, as well as their reaction to Gram stain. What complements these characteristics are the enumeration of physiological and biochemical characteris tics, which cannot be directly monitored using light scattering. To avoid the demands of either taxonomy or a phylogenic system of classification, one would resort to a more pragmatic, artificial classification, which groups organisms according to their similari ties. The most complete work of such descriptive bacteriology is ‘Bergey’s manual of Systematic Bacteriology’[21], which contains names, descriptions of morphological and physiological properties with literature citations and the corresponding determinative key of classification. The terminology used is illustrated in Figure 2.2, with an example.
In this classification system, all bacteria can be said to be separated to two domains, that is Eubacteria and Archaea, and further on to five kingdoms, from which two appear for Eubacteria, namely the proteobacteria and firmicutes. From there several procedures have been applied as mentioned earlier to further classify bacteria to corresponding divi sions or Phyla. We adopt the most common of them which is separation by Gram staining and the reaction that bacteria have to this process2. A fixed bacteria smear, that is the
2Gram reaction is the process of identification through staining, bearing the name of its inventor DOMAIN
KINGDOM
Eubacteria
Capsule (condensed polymers)
, i Peptidoglycan Sheet
Cytoplasmic Membrane
Figure 2.3: A Gram (+) cell wall: Chemical composition. Notice that the capsule layer only appears if condensed polymers form; this is an indication of virulence.
bacteria prepared on a glass plate, is stained by violet crystal Gram solution, decolourised with ethanol and counterstained with a contrasting dye. After rinsing with water, some bacteria retain the original stain (Gram positive + ) whilst others retain the conterstain (Gram negative —). For identification purposes, the structure of the cell wall plays an important role. A Gram positive cell wall is generally described as a rigid structure of chemical composition as in Figure 2.3.
The phenomenon of Gram reaction can be explained by behaviour of the cell wall. Gram (+) cells have a cell wall with multiple layers, forming a thick rigid structure. As a result they are not susceptible to mechanical breakage in that they would sustain the shape and controlled porosity to possibly harmful agents such as antibiotics. In fact [1, 22] it is noted that the cell wall of Bacillus Anthracis becomes more rigid with increased doses of chlorine in water distribution systems, resulting in increased resistance to antibiotics, with possible life expectancy of up to two years. On the other hand Gram negative cells have a thin cell wall and are not as dense as their positive counterparts. In terms of light scattering one would, for example, try to link the behaviour of any part of the cell, in the current example the cell wall, with optical properties and in effect try to infer a similar classification system.
By employing the Lorentz-Lorenz formula as derived for optical frequencies com monly known as the Clausius-Mossoti equation [23] so that
m 2 — 1 M _ N Aa
where the right hand side of the equation is commonly known as the ‘molar refraction’ with M being the molecular weight and D being the molecular density. Na is the Avo-
gadro’s number, a is the polarisability of the molecule and m is the relative refractive index defined as the refractive index of the cell, or cell part, divided by the refractive index of the medium in which it is suspended. Rearranging the terms and taking into account the known fact from analytical chemistry [24] that the molar refraction is solely dependent on the sum of refractions of the bonds present in a given molecule, then for a mixture of different molecules and as a result for particle consisting of several mole cules, as is the case with bacteria, it has been shown [25] that for bacteria the average polarisability corresponds to the molar refraction factor
m 2 - 1 Na
a = m 2 + 2 3
i
where Ni is the number concentration in the molecule and a* is the polarisability of the
i-th molecule; the bacterium is taken to be a homogeneous body.
Bacteria of volume V are bodies that exceed the molecular level numbers; hence Equa tion 2.2 would result in [23]
& = v ~1l ' !^ v ” v - 1j v ^ v (2-3) where a corresponds to the average polarisability of a bacterium of volume V, which is now assumed to be a non-homogeneous body. This is a generalisation of Equation 2.2, [25], where it was assumed that the cell of volume V is homogeneous.
As a result, using this term explicitly in any modelling procedure would lead to an ad vance in the sciences related to the biochemical properties of the cell. In theory, inference of such a term could be applied to any internal structure of the cell and could identify apparent contributions. The latter would be true, as long as one establishes an experimen tal link between the said model and the microbiological properties, for example inference of the proportion of water content of the bacterium as in [3] and [26]. Inference , of the water content within bacterial cells of specific volume V0 and refraction increment as
is performed by using
m — 1 + csas (2.4)
Cy, — DW{1 - csV0) (2.5)
a direct result from Equations 2.2 and 2.3 in the proof of Ulanowski [25, Chapter 2], where
Coccus Bacillus Vibrio Fusiform
Sphere Rod like Comma shaped Ellipsoid
Staphylococcus Bacillus subtilis Vibrio Cholerae Escherichia Coli aureus
Figure 2.4: Most common bacterial cells in relation to their external morphology. Cor responding microscopic images are also provided: Reprinted with permission from Dr D. Kunkel (Dennis Kunkel Microscopy © )
and Ulanowski use the assumption m —> 1, so that [(m2 — l)/(m 2 + 2)] —» 2(m — l)/3 and thus accept extremely small phase shifts for light rays entering the medium and body within the cell; assuming ‘transparency’ of near-index particles. The reader is advised that we return to this aspect in Chapter 3, where we infer our main result and introduce our approximation model.
In terms of external morphology, these Prokaryotic cells, which are small in terms of size, can be found in many geometric shapes, but they are mainly distinguished [27] as rod-like, ellipsoids, curved rods or ‘comma-shaped’, and spherical (Figure 2.4). As a result, if one wishes to model bacteria in terms of light scattering or any other type of electro-magnetic radiation field, one should attempt to do so for most, if not all, of the said morphologies. The rod-like, in shape, bacteria such as the genus Escherichia are usually not more than lp m wide and 5/rni long whilst many Pseudomonads have a diameter of 0.4 — 0.7/im and a length of 2 — 3pm. Spherically shaped bacteria (hence the name cocci3) have a diameter varying from 0.6pm, in the case of micrococci, up to 1.1pm. There are a few larger forms of bacteria, but they are not commonly found in potable water samples and they multiply very slowly [28, 22].
As indicated in Figure 2.5, we have structures internal and external to the cell wall. With reference to Figure 2.3, external to the cell wall we may have a formation of poly mers, which may be condensed forming an external slime layer, the capsule. This is an
Nuclear Area
(DNA material)
Flagellum Ribosom es
Cytoplasm Granular
Inclusion Cytoplasmic Capsule
Membrane Cell Wall
Figure 2.5: Schematic of the true structure of the prokaryotic cell. Note that features are not shown to scale and have been emphasised to illustrate the multi-layered structure. indication of virulence, that is to say it may be a predictor of the cell’s ability to cause disease, causing the cell to be considered as pathogenic. Taking into account that Wyatt, in [19], has shown that polymers in solution can be analytically characterised, indicates that morphological features which have similar composition may need to be taken into account. That is to say, there is no reason to believe that light scattered from the capsule will be negligible, and as a result this morphological feature could be modelled as an ad ditional layer in terms of light scattering. Appearance in the model of such a layer would result in predicting pathogenic bacteria as opposed to possibly harmless ones.
medium, leading to cell death.
For bacteria the term cytoplasm will refer to the substance of the cell inside the cyto plasmic membrane, that is, enclosed DNA material (nucleoid), ribosomes and so on. Its composition is considered to be mainly water; that is, at least 76% [30] to 80% [27]. As a result if the cell is suspended in a water based environment then it is obvious that the relative refractive index m , defined as the refractive index of the cytoplasm divided by the refractive index of the medium, will be very close to unity, hence m —> 1 or |m — 1| <C 1. The nucleoid of a bacterial cell contributes a single long circular molecule of double stranded DNA, the bacterial chromosome. The nuclear area can be spherical or elongated depending on the cell’s external morphology. As such it can be assumed to follow the overall geometrical structure of the rest of the cell, unlike eukaryotic cells. Following, for example, the experimental work of Newman in [31], and verifications from several sim ulated nucleoids in the literature, it has been found that the contribution of this internal structure to scattered light is more significant in the backscattering angles. However, the use of simplistic models, as is the case with deployment of no more than 3-layered mod els, hybrid or otherwise, makes the finds questionable. It is of no dispute, however, that the main structures within the cytoplasm will produce scattering of light, and backscatter ing will be more emphasised [31,32] due to the appearance of extra intercellular material, hence layers.
Plasma Germ Cell Wall Membrane
Exosporium
Protoplast
— Inner Coats [image:37.615.137.465.44.251.2]---Outer Coats
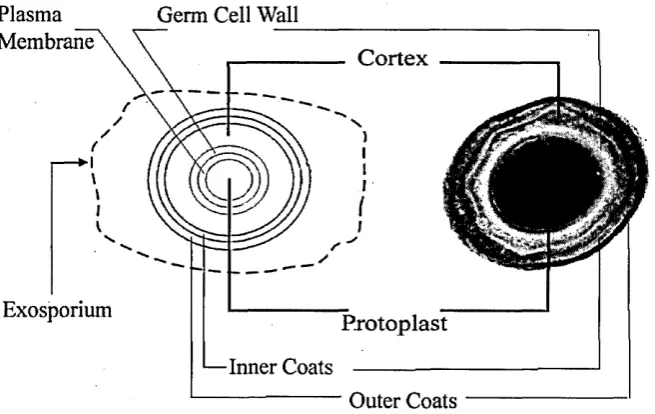
Figure 2.6: The electron microscopy image of cross section of the Bacillus subtilis en- dospore (right). A typical model that appears in most textbooks of microbiology to ex plain its structure can be seen on the left.'Note phase light and phase dark regions of the microscopy image and the clear relationship with the diagrammatic illustration as shown here.
observable by MALLS or light scattering in general.
However, a significant inclusion is the spore, also referred to as endospore. These structures are unique to bacteria and are highly durable with thick cell walls. Further more, following most microbiology textbooks, endospores have ‘. .. additional internal layers’ [36] [27]. They are formed as structures internal to the cell membrane via the process of sporulation, and they are released into their environment from the parent cell at the germination stage. The free spores may eventually be the same or larger than the parent cell’s size, or may be smaller. When they are within the cell they occur either ter minally, that is at the end of the cell, or centrally, and are significantly smaller in size. The free spores can in theory remain dormant [37] for many years and every vegetative cell produces only one spore. After germination the spore is released, and the parent cell dies; hence it is not a process of multiplication. Furthermore, the spore itself does not hold a mechanism for multiplication. As a result, techniques which are based on the outgrowth or multiplication of cells will fail. Furthermore the spore is very difficult to stain, hence optical microscopy counting and resulting induction trees of identification are difficult, if not impossible, to perform and obtain [38].
its metabolism or size, or dead is a research question of great experimental interest and has yet to be answered. Under the hypothesis that dormancy can be linked with highly dehydrated spores, there is still an issue involving the ‘wet’ spore’s water content. The total volumetric water content of such spores greatly varies, between 60 and 85%. If one takes into account that the ‘wet’ spore is probably completely permeable to water, finding the equilibrium of water in say the dominant internal features of Figure 2.6, namely the cortex / protoplast ratio of size and volumetric proportion of water, is problematic. By examining a summary of finds for the refractive index by light scattering (Section 2.4, Table 2.4) one would observe that vegetative, non-dormant spores have a small relative refractive index value which effectively means a less dense cortex (outer layer in the 2- layer spherical model); hence they are more permeable, suggesting a larger free water content in the protoplast. Even so, in the studies of Jones and Weiss [39] the spores of B. megaterium were subjected to high pulses of high energy, i.e. electron radiation. Acquiring corresponding spectra from wet and dry spores via a spectrometer, it was found that the spores following radiation had spectral signatures which were very similar. As a result, it was concluded that it was more likely that the spores normally maintained relatively dry regions within. Translating this to the question of how many layers should one use in a modelling procedure is open to interpretation; however it should be clear that a 2—layer model is too simplistic. It should be clear that the spore is a special case of inclusion, one which would be used for separation between bacteria that are able to sporulate and those which do not possess this ability, hence providing a taxonomic feature of identification [38]. However, in the same work it is noted that the Bacillus genus, given its name from the structure within which the spore is enclosed before sporulation, is commonly referred to as a rod-like particle when, in fact, it may be more realistic if one depicts it as an ellipsoid. Even for Group II Bacillus spores the author notes that they are not spherical but ellipsoidal, and that the common misconception derives from the 2—dimensionality of most microscopic observation techniques.
2.3 Candidates for drinking water abstraction:
Bacterial Ecosystem
in the quality monitoring of networks of potable waters. Biological processes in the nat ural environment that can be used in theory for abstraction of drinking water to a human consumption potable supply network [11] are strongly influencing the physical state and quality of water. Such ecosystems are freshwater lakes, water deposits and rivers. Bacte ria numbers are influenced mainly by the density of water and the nutrients to be found. Water has a maximum density at 4°C however this varies greatly depending upon the environment.
Every cell in a bacterial ecosystem has an age and size. The relationship between the two is not well understood and has been proved to be exceptionally complicated due to the complex biochemical interactions that take place. Furthermore there still exists a debate as to whether the mathematical relationship is deterministic or stochastic or a combination of the two. However when a cell population grows exponentially there is a greater number of smaller cells relative to the population size than that of larger cells. In general large cells are considered to be older than smaller cells, but once again this is taken as a heuristic result. When cells have reached a steady state of growth then a greater size of larger cells as opposed to smaller ones appears. This heuristic observation leads many researchers to model populations using the normal distribution where the variability, that is the spread of the curve, depends on the rate of inter-divisions of the cells [40] [22, pp253-277]. In particular, Stull in [41], by using differential light scattering measurements on 141 in dividual bacterial suspensions of Staphylococcus epidermidis and assuming a spherical homogeneous body with an average refractive index of 1.388, infers a discrete size dis tribution that closely matches, in the continuous sense, the normal frequency function. He relies on the assumption that the set of maxima angles in the scattering pattern for a particular radius value is unambiguous and he solves the direct problem in two steps. In the first step, depending on the number of peaks in the measured data, an appropriate range of radii is selected; in the second step, the set of measured peaked angles is fitted to the theoretical pattern of scattering. However, the model he employs is homogeneous and of spherical symmetry. As we will see in Chapter 4, Figure 4.6, this is not the case if theoretical patterns to be fitted on experimental data do not assume an axis of symmetry with respect to the incident radiation (Figure 2.1).
between two sister cells of Escherichia coli, there can be identified at least five different sources of random fluctuations. To summarise:
1. Change fluctuations: these arise in the synthesis or partitioning of critical macro molecules that depend on the bacteria growth
2. Systematic physiological changes: these may have arisen due to environmental vari ability (as we will see later in this section) or due to individual variability in cells due to inequality in separation during the growth cycle.
3. Behavioural changes: due to regulatory mechanisms of, for example, DNA replica tion
4. Mutational changes: as bacteria progress in their evolution, random mutations take place so as to adapt to changes in their environment. This may affect the size variability directly or indirectly.
5. Genetic change: that is groups of genes may change and production of new species may be rendered with new growth, size and division cycle properties.
These five sources of variation are not the only ones [44] but they have been identified to be the major contributors. They involve stochastic as well as deterministic elements [43] and the distinction as to whether one of the two process modelling procedures should be applied may be dependent on the number of critical events. If a few of those sources are dominant then distributions that emphasize positive or negative skewness must be used. Finally it is stated that continuous distributions, such as the Gamma frequency distribu tion, would be a useful alternative, but one should be cautious in the way the continuous distribution is fitted to the experimental data [45]. That is to say, when a number of samples has been taken there is an associated risk which stems from the sampling pro cedure, because if most samples are selected from within a specific range then this may not represent the true nature of the distribution (skewness effects may not be evident) 4. A model would be inferred if the events per sample are considered to be independent. Otherwise, the influence of correlation effects has to be determined in order to investigate the underlying relationships before averaging over the whole population.
Freshwater lakes present seasonal variations and temperature zones. For example in spring the cold water of a lake is warmed by the sun. As a result, the surface layer is warmed up and water in this layer decreases in density. The boundaries between zones can
Cyanobacteria
Oxygenic
Photosynthesis CO;
Aerobic Bacteria Cells
* Thermocline layer
Red & Green Sulphur
\ Bacteria
Anoxygenic Photosynthesis
[image:41.617.84.509.20.239.2]Sediment
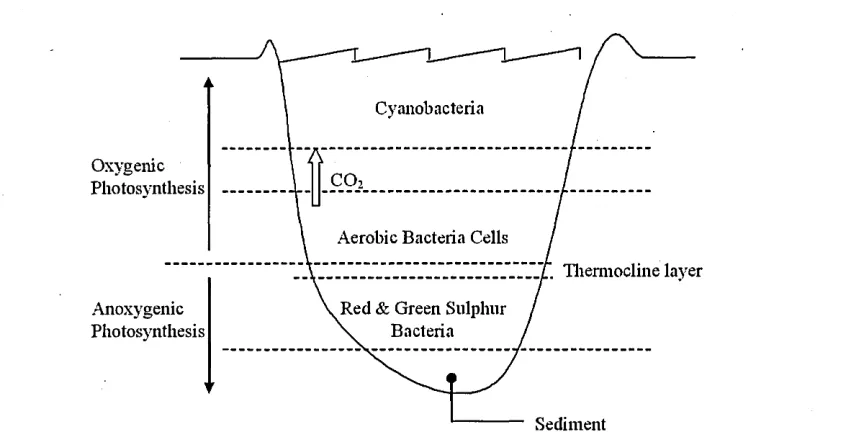
Figure 2.7: A freshwater lake eco-system and the distribution of bacteria on the layers. Waters above the thermocline layer (indicated by the arrow) constitute the epilimnion and below the said layer is the hypolimnion.
be very abrupt but, depending on depth, they may persist throughout the seasonal changes. However changes in temperature produce an increase of chemical compounds and nutrient concentration. Consequently, when deep waters become cooler, the nutrients rise to the surface and the bacteria population increases accordingly; the population that resides per layer of Figure 2.7 will increase rapidly depending on the nutrient concentrations. The metabolism and multiplication of bacteria will increase the biomass production, hence bacterial cells will increase in size/volume, as well as in their numbers per m l of water.
In the upper layers (epilimnion) which are penetrated by light, production of biomass will be increased and so will phototropic bacteria, for example the Cyanobacteria. In this case, oxygen is consumed and aerobic bacteria appear. However, in the lower lay ers (hypolimnion) only bacteria that have the ability tp utilise methane emissions will be present. This is because the hypolimnion will eventually stop producing oxygen, ren dering it completely anaerobic, and only methane will escape in the form of bubbles. As a result, anaerobic microbial processes take over. This results eventually in storage of a large portion of hydrogen sulphide and, if illumination is suitable, then purple and green sulphur bacteria will grow and form the primary biomass production. In this zone, appearance of Genera containing gas vacuoles, for example Amoebobacter, as well as flagella-propelled, for example Chromatium, is evident.
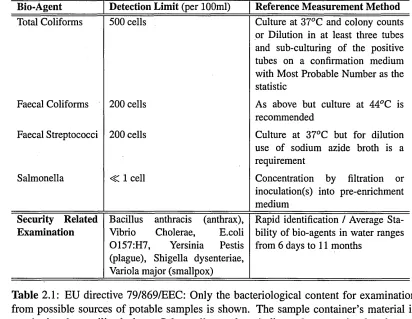
Bio-Agent Detection Limit (per 100ml) Reference Measurement Method Total Coliforms 500 cells Culture at 37°C and colony counts
or Dilution in at least three tubes and sub-culturing of the positive tubes on a confirmation medium with Most Probable Number as the statistic
Faecal Coliforms 200 cells As above but culture at 44°C is recommended
Faecal Streptococci 200 cells Culture at 37°C but for dilution use of sodium azide broth is a requirement
Salmonella <C 1 cell Concentration by filtration or inoculation(s) into pre-enrichment medium
Security Related Bacillus anthracis (anthrax), Rapid identification / Average Sta Examination Vibrio Cholerae, E.coli bility of bio-agents in water ranges
0157:H7, Yersinia Pestis (plague), Shigella dysenteriae, Variola major (smallpox)
[image:42.615.96.508.28.347.2]from 6 days to 11 months
Table 2.1: EU directive 79/869/EEC: Only the bacteriological content for examination from possible sources of potable samples is shown. The sample container’s material is required to be sterilized glass. Salmonella numbers indicate the necessity for absence per 1000ml. The remainder as indicated is taken from recent additions as per [1, 2], the
Central Disease Control, USA security code.
suitable for human consumption, as concentrations of unicellular organisms appear to be very low. However even a suspension of 105 bacterial cells per ml of water does not appear turbid to the naked eye. In terms of bacteria, the presence of coliforms, such as the Escherichia genus, and other genera (Salmonella and Streptococcus), and sulphur utilising bacteria in conjunction with the appearance of a strong smell of hydrogen sulphide, should serve as a strong warning signal of the poor water quality.
00
d « X d> 40 103 nm
GO
Rayleigh
m -
11
«1
Rayleigh - Debye Approximation ADM e Scattering Theory
Figure 2.8: Light scattering theoretical models and applicability. Note that Mie scattering would potentially solve most problems involving small particles provided that a rigorous solution could be obtained. On the diagram, (GO): Geometrical Optics and (AD): Anom alous Diffraction. We use GO and AD as examples of approximations that would be applied for particles having a largest dimension d > 40/xm; for spheres this would be the radius for other external morphologies this would mean the major axis. By x we denote the size parameter defined by x = 2kQd, where d is the scatterer’s largest linear dimension.
2.4 Application of Light Scattering theory to biological cells
In general models derived from light scattering by small particles can be applied to the do main of biological cells such as bacteria. However the latter depends on the applicability boundaries of the theory to be used. Various methods have been developed throughout the years but in most cases they relied on simplifying assumptions on the internal structure of the cell. In general Mie theory, which is a rigorous solution, has the widest applica bility range (Figure 2.8) as opposed to, for example, approximating theories, such as the Anomalous Diffraction (AD) and Geometrical Optics (GO). In Figure 2.8 the range of applicability for these theories has been related to the size parameter denoted by x and the relative refractive index, denoted by m. The size parameter is directly proportional to the largest linear dimension d of the particle, since by definition x = 2kQd, where kQ is the propagation constant at a fixed wavelength A (in vacuo) of incident radiation.
theory of scattering and absorption by small particles can be said to fall under four main categories:
1. Exact Methods: In the literature there appear to be three dominant theories. That is, solutions from separation of variables (Mie scattering), the T-matrix method and the integral equation method.
2. Numerical Methods: The theories that dominate the field are the Coupled Dipole Method (CDM - Purcell & Pennypacker) and Discrete Dipole Approximation (DDA - Draine & Flatau)
3. Approximate Methods: four dominant theories appear in the literature, that is, Rayleigh-Debye or Bom approximation (RDG), Anomalous Diffraction (AD), Geo metrical Optics (GO) and the WKB or higher energy approximation
4. Hybrid Methods: that is, appropriate combinations of the above
The most famous and widely used are Mie scattering [9] and the generalised Mie solutions [49, for example] as well as its variants, which fall under the separation of variables category. An example is the solution of scattering by spheres that are placed at close distances (agglomerates) illuminated by a Gaussian beam [50] and presented as a superposition of field components method. Any analytic solution depends on the number of terms required to terminate the scattering series, with the most commonly used criteria outlined in [10]. To take into account inhomogeneities in cells, it is obvious that the model had to be extended. In that respect, a solution for the 2-layer model, but for a variable outer layer refractive index, has been reported in [5] in the context of bacteria and similarly sized biological cells. Most often cited is the simplistic model of a two-layer sphere, in [51, 52] and more often in reprints of Bohren-Huffman’s book [4], which has been applied throughout the 1970’s. In order to infer optical properties from biological cells using this model, in [53,54, 3,55] the particle is considered to be a sphere consisting of two concentric layers. This model continues to be extensively used, for example in [12, 13, 56], even though the n-layer spherical problem has been proved to have an exact solution provided in [57, 58, for example] 5. Other solution methods to the concentric multi-layered sphere problem have been provided in the literature [59, 60], but the reader is warned that the expressions therein are not explicit.
Unfortunately, the cell is being depicted as having two contributing parts: the core or . nucleus and the cell wall or cytoplasm. It must be noted that Wyatt and Ulanowski were
the first to link 6 the two layer model with the water content within the cells [12, 61], and to perform the first experiments in that respect, but in general we can already intuitively understand issues arising from its use. On one hand, a microbiologist or biophysicist would immediately identify that the cell wall should be modelled as a separate structure (outer layer) and the cytoplasm as an internal layer which incorporates the nuclear area. Using this as prior knowledge one should model the cell as having at least three layers. Using this assumption, that is a three-layer Mie scattering model as applied to biological cells, it may be surprising that only the works of Lopatin [62, 63, ex-USSR publications in Russian] are found and are largely unknown, possibly due to the fact that an English translation cannot be found. On the other hand, it is often reported in all works cited above that on average 20% of the experimental scattering patterns obtained provide ambiguous results. This is often attributed to asymmetry, deviation from spherical symmetry, or inhomogeneity of the cells. The ambiguous results can be attributed to the inferiority of 2-layer or 3-layer models as descriptors of the extinction and scattering of light by biological particles/cells even in cases where the cell is expected to be spherical (for example, the cocci family of bacteria7 or sporulating bacterial cells8). This is clearly supported in [64] where, using electron microscopy, images of cross-sections of Bacillus spores were produced. In this study the electron microscopy images were taken after negative staining, thin-sectioning and freeze-etching. As a result any inferred values, on size or otherwise, are of no use since a destructive technique has been applied; however the finds on structure are significant. For it was reported that the Bacillus spores present a structure resembling a 4-layer model, where the cell wall structure is observed to be that of two-periodic layers (resulting in a total of 5 layers). Clearly an n-layer model in conjunction with multi-angle scattering equipment might have been adequate to identify this novel feature and relate to other characteristics of such a spore. That is to say, if this feature were unique, as is the case with Wahlberg’s finds, then this would be used as an identification protocol for the specific strain9.
The CDM and DDA [65] have been extensively used in astronomy and related dis ciplines. In effect a lattice of dipoles (or targets as preferred in the DDA terminology) generates a model of the particle under consideration. Assigning optical properties for each dipole, the lattice is then calculated by iteration and all fields are calculated. As should be obvious, the parameter space increases with the number of ‘targets’ needed to